Inês Sofia Cortes Eusébio Camacho
Licenciatura em BioquímicaEffects of UV radiation exposure on DNA
and DNA repair enzymes
Dissertação para obtenção do Grau de Mestre em Biotecnologia
Orientador: Doutor Filipe Folgosa, Investigador Pós-Doc, FCT-UNL
Co-orientador: Doutora Cristina M. Cordas, Investigadora Auxiliar, FCT-UNL Co-orientador: Prof. Doutora Alice S. Pereira, Professora Auxiliar, FCT-UNL
“Copyright”
Effects of UV radiation exposure on DNA
and DNA repair enzymes
Inês Sofia Cortes Eusébio Camacho Faculdade de Ciências e Tecnologia Universidade Nova de Lisboa
Em primeiro lugar, gostaria de agradecer aos meus orientadores, Dr. Filipe Folgosa, Dra. Cristina M. Cordas e Prof. Dra. Alice S. Pereira, por me terem dado a oportunidade de realizar a minha tese de mestrado no seu grupo de investigação. Estou deveras grata não só pela enorme ajuda científica, mas principalmente pelo apoio, estímulo e conselhos dados ao longo da realização deste trabalho.
Aos Drs. Filipe Folgosa e Cristina M. Cordas, gostaria ainda de agradecer a amizade, o companheirismo, a paciência, a disponibilidade e a compreensão demonstrados ao longo deste ano. Agradeço também as merecidas chamadas de atenção. Filipe e Cristina, vocês são os meus mentores! Pelo meu crescimento científico e pessoal, e por tudo, um muito obrigada!
Aos Profs. Drs. Pedro Tavares e Alice S. Pereira, agradeço o facto de me terem recebido no seu laboratório e facultado a utilização do seu material e equipamentos. Gostaria ainda de agradecer ao Prof. Dr. Pedro Tavares pelos debates e conversas inspiradoras (embora nem sempre de acordo), pelas suas opiniões e conselhos, e, principalmente, por acreditar em mim. Obrigada!
Agradeço à Daniela Penas, colega de laboratório, a ajuda e disponibilidade demonstradas. À Joana Wilton, Rui Almeida, Cristina Timóteo, Susana Ramos, Ana Pina e Leonor Morgado, agradeço o convívio e a boa disposição. Em suma, a todo o pessoal do laboratório 425 (presente no dia‐a‐dia e os que por lá passam de vez em quando), agradeço o excelente ambiente, a boa disposição e os momentos de convívio e descontracção que tanto me animaram durante este ano.
Às minhas amigas de Mestrado, Joana e Viviana, agradeço a amizade, o apoio, a motivação e os momentos de descontracção e “parvoíce” partilhados ao longo dos últimos dois anos. Obrigada por aturarem os meus stresses e devaneios constantes. À Joana, agradeço ainda as longas conversas telefónicas que tanto me animaram nesta fase. Obrigada!
Aos meus amigos, em especial ao Márcio, à Marina, à Susana e ao Natan, agradeço principalmente a compreensão pela minha “ausência” durante esta fase e o facto de estarem sempre disponíveis para me ouvir e animar. Prometo que vos recompenso! Agradeço a amizade, o apoio e os bons momentos passados ao longo destes anos. Obrigada por me aturarem!
Ao João, agradeço o amor, o carinho, a amizade, o apoio, a força e a paciência demonstrados ao longo destes anos e principalmente nesta fase.
Resumo
Na célula, a integridade do DNA está sob constante ameaça de agentes nocivos de origem endógena ou exógena, tais como as radiações UV e ionizantes e o stress oxidativo. Embora os efeitos destes agentes cancerígenos no DNA já tenham sido extensivamente estudados, muito pouco se sabe sobre o seu efeito nas enzimas de reparação do DNA.
O objectivo do presente trabalho foi o estudo do efeito da radiação UV na Endonuclease III de E. coli, uma DNA glicosilase pertencente ao sistema de reparação por excisão de bases. Esta enzima foi sobre‐expressa homologamente e posteriormente purificada com um rácio Fe/proteína de 3.88 ± 0.63 (holoproteína).
A exposição da Endonuclease III à radiação UV durante 45 min (dose equivalente a 19.77 kJ) conduz possivelmente à destruição das ligações Fe‐S do centro [4Fe‐4S] ou à conversão deste centro a um estado redox diferente.
Os ensaios de mobilidade electroforética realizados mostram que a ligação da Endonuclease III ao DNA plasmídico promove um retardamento da banda correspondente à forma superenrolada do DNA, indicativo da formação de complexo(s) Endonuclease III‐DNA. Estes ensaios mostram igualmente que a Endonuclease III é capaz de se ligar tanto à forma linear do DNA plasmídico como à superenrolada, embora com maior afinidade para a forma linear.
Ensaios de mobilidade electroforética realizados após 45 min de irradiação UV (19.77 kJ) revelam que, apesar de ocorrer um retardamento, os complexos formados são instáveis e dissociam‐ se durante a electroforese. Além disso, a presença de agregados proteína‐DNA sugere a desnaturação de algumas proteínas. Após 6 h de irradiação (158.18 kJ) não se formam complexos, o que permite concluir que as moléculas de Endonuclease III foram irreversivelmente danificadas.
Os estudos electroquímicos foram realizados por voltametria cíclica e de pulso diferencial, à temperatura ambiente e em condições anaeróbicas; a Endonuclease III livre e o complexo Endonuclease III‐DNA foram adsorvidos à superfície de um eléctrodo de grafite pirolítica não modificado. Pela primeira vez, foi observada a resposta electroquímica directa da Endonuclease III sem estar ligada ao DNA, com um par redox quasi‐reversível exibindo um potencial formal de 178 ± 9 mV vs. NHE. A ligação da Endonuclease III ao DNA plasmídico promove um desvio (19 mV vs. NHE) do par redox característico da Endonuclease III para potenciais mais positivos. A irradiação do complexo proteína‐DNA promove um desvio negativo de 25 mV vs. NHE no seu potencial redox.
Palavras‐chave: Endonuclease III; DNA plasmídico; complexo proteína‐DNA; radiação UV; ensaios de
Abstract
DNA integrity in the cell is under constant threat from damaging agents of endogenous or exogenous origin, such as UV light, ionizing radiation and oxidative stress. Although the effects of these carcinogens on DNA have been extensively studied, very little is known about their effect on DNA repair enzymes.
The aim of the present work was the study of the effect of UV radiation on E. coli Endonuclease III, a DNA glycosylase belonging to base excision repair system. This enzyme was homologously overexpressed and then purified with a Fe/protein ratio of 3.88 ± 0.63 (fully‐loaded form).
Endonuclease III exposure to UV radiation for 45 min (19.77 kJ dose) may lead to the destruction of the Fe‐S bonds of the [4Fe‐4S] cluster or to the conversion of this center into a different redox state.
Electrophoretic mobility shift assays with protein‐DNA complex showed that Endonuclease III binding to plasmid DNA promotes a retardation of the free supercoiled DNA band, indicative of Endonuclease III‐DNA complex(es) formation. These assays also showed that Endonuclease III is able to bind both linear and supercoiled plasmid DNA, although with higher affinity for the linear form.
Electrophoretic mobility shift assays performed after 45 min of UV irradiation (19.77 kJ) revealed that although shift occurred, the complexes formed were unstable and dissociated during electrophoresis. Moreover, the presence of aggregates suggests the unfolding of some Endonuclease III molecules. After 6 h of UV irradiation (158.18 kJ) no complexes are formed, leading to the conclusion that Endonuclease III molecules were irreversibly damaged.
The electrochemical studies were performed by cyclic and differential pulse voltammetry techniques, at room temperature and anaerobic conditions; Endonuclease III and Endonuclease III‐ DNA complex were adsorbed on a bare pyrolytic graphite electrode. For the first time, the direct electrochemical response of Endonuclease III unbound to DNA was observed, with a quasi‐reversible redox couple displaying a midpoint potential of 178 ± 9 mV vs. NHE. Endonuclease III binding to plasmid DNA promotes a positive shift (19 mV vs. NHE) in the characteristic redox couple of Endo III. Protein‐DNA complex UV irradiation promotes a negative shift in its redox potential of 25 mV vs. NHE.
Keywords: Endonuclease III; plasmid DNA; protein‐DNA complex; UV radiation; electrophoretic
Abbreviations, symbols and constants
Abbreviations
aa Amino acid
Abs Absorbance
Amp Ampicillin
AP Apurinic/apyrimidic
APE1 Apurinic/apyrimidic endonuclease APS Ammonium persulfate
Asp Aspartate
BCA Bicinchoninic Acid
BER Base excision repair bp (DNA) base pairs BSA Bovine serum albumin CE Counter electrode
CPD Cyclobutane pyrimidine dimers CT Charge transport
CV Cyclic voltammetry
D. vulgaris Desulfovibrio vulgaris strain Hildenborough
DPV Differential pulse voltammetry DR Direct repair
DSB Double‐strand break
E. coli Escherichia coli
Endo III Endonuclease III FCL Fe‐S cluster loop Fd Ferredoxin GPD Gly/Pro‐rich loop HhH Helix‐hairpin‐helix
ICL Interstrand crosslink
IPTG Isopropyl‐‐D‐thiogalactopyranoside LB Luria Bertani broth, known as Luria Broth LB/Agar/Amp Luria Broth containing Agar and Ampicillin LMW Low molecular weight
MMR Mismatch repair
MWCO Molecular weight cut‐off NER Nucleotide excision repair NHE Normal hydrogen electrode NHEJ Non‐homologous end joining OD Optic density
PDB Protein data bank pDNA Plasmid DNA PG Pyrolitic graphite Pol Polimerase
Rd Rubredoxin
RE Reference electrode RNS Reactive nitrogen species ROS Reactive oxygen species SCE Saturated calomel electrode SDS Sodium dodecyl sulfate
SDS‐PAGE Sodium dodecyl sulfate – Polyacrylamide gel electrophoresis SSB Single‐strand break
TEMED N,N,N’,N’‐tetramethylethylenediamine Tris Tris(hydroxymethyl)methylamine Trp Tryptophan
Symbols and constants
Ageom Geometric area
c Concentration
C Coulomb
ε Molar extinction coefficient
E Potential
E0' Formal reduction potential
Ep Peak potential
Epa Anodic peak potential
Epc Cathodic peak potential
ΔEp Potential difference
F Faraday constant
I Current
Ip Maximum peak current
Ipa Maximum anodic peak current
Ipc Maximum cathodic peak current
Ksh Heterogeneous electron‐transfer rate constant
mUA Milliunits of absorbance n Number of electrons NA Avogrado constant
R Molar gas constant
T Temperature
Scan rate
Table of contents
Chapter 1 Introduction 1
1.1 DNA damage and its consequences 1
1.1.1 Damage to the DNA nucleobases 1
1.1.2 Damage to the DNA backbone and Interstrand Crosslinks 2
1.2 DNA repair systems 3
1.2.1 Direct repair 4
1.2.2 Homologous recombination and Non‐homologous end joining 4 1.2.3 Nucleotide excision repair and Mismatch repair 5
1.2.4 Base excision repair 6
1.2.4.1 DNA glycosylases 9
1.2.4.2 HhH superfamily 10
1.2.4.3 Endonuclease III 12
1.2.4.4 Iron sulfur clusters 14
1.2.4.2 Iron sulfur clusters and DNA‐mediated charge transport: a facilitated
route for DNA repair 14
Chapter 2 Objectives 21
Chapter 3 E. coli cells transformation, homologous overexpression and purification
of recombinant Endonuclease III 23
3.1 Transformation 23
3.2 Overexpression in 2xYT, extraction and purification 24 3.3 Overexpression in M9 medium, extraction and purification 28
Chapter 4 Protein and iron quantifications 33
4.1 Protein quantification 33
4.2 Iron content determination 36
Chapter 5 Effect of UV radiation on plasmid DNA 39
5.1 pUC18 isolation 39
5.2 pUC18 digestion 41
5.3 Irradiation of linear and supercoiled pUC18 41
Chapter 6 Endonuclease III exposure to UV radiation and its effects 49
Chapter 7 Electrophoretic mobility shift assays with Endonuclease III‐DNA complex 51
Chapter 8 Electrochemical characterization of recombinant Endonuclease III 59 8.1 Study of Endonuclease III system reversibility 62
8.2 Endonuclease III surface coverage 64
Chapter 9 Electrochemical behavior of Endonuclease III, plasmid DNA and protein‐DNA
complex, before and after UV irradiation 71
9.1.1 Cyclic voltammetry assays 71
9.1.2 Differential pulse voltammetry assays 76
Chapter 10 Conclusions 83
Chapter 11 Future work 87
References 89
Appendices 95
Appendix A ‐ Instrumentation 96
Appendix B ‐ Protocols 98
B.1 Preparation of E. coli C43 (DE3) competent cells 98
B.2 Transformation of competent cells 99
B.2.1 E. coli C43 (DE3) competent cells transformation 99 B.2.2 NZY5α competent cells transformation 99 B.3 Plasmid DNA extraction and purification 100 B.3.1 E.Z.N.A. Plasmid Midi Kit (Omega) 100
B.3.2 NZYMiniprep Kit (NZYTech) 101
Appendix C ‐ Culture mediums 103
C.1 LB and LB/Agar media 103
C.2 2xYT medium 103
C.3 M9 medium 104
Appendix D ‐ Resource S chromatographic column 106
Appendix E ‐ Gels 107
E.1 Polyacrylamide Gel Electrophoresis in denaturing conditions (SDS‐PAGE) 107
E.2 Agarose gel electrophoresis 109
Appendix F ‐ Protein and iron quantifications 111
F.1 Protein quantification 111
F.1.1 Lowry’s method 111
F.1.2 BCA method 111
F.2 Iron content determination using Phenanthroline method 112
Appendix G ‐ pUC18 digestion 113
Appendix H ‐ Experimental details of the irradiation assays 114
Appendix I ‐ Electrochemical assays with recombinant Endonuclease III 115
Appendix J ‐ Electrochemical characterization of electrode surface 117
Appendix K ‐ Appendix References 119
Figures Index
Figure 1.1 | Examples of common lesions to DNA. _________________________________________________ 1
Figure 1.2 | Examples of agents that fragment deoxyribose sugars in DNA. _____________________________ 2
Figure 1.3 | DNA damage and repair mechanisms. ________________________________________________ 3
Figure 1.4 | Homologous recombination (HR) and non‐homologous end joining (NHEJ) repair systems. ______ 4
Figure 1.5 | Nucleotide excision repair (NER) and mismatch repair (MMR) systems. ______________________ 5
Figure 1.6 | Overview of base excision repair (BER) mechanism. ______________________________________ 8
Figure 1.7 | Reaction mechanism of DNA glycosylases. _____________________________________________ 9
Figure 1.8 | Comparison of the three‐dimensional structures of some enzymes belonging to the HhH DNA
glycosylase superfamily. _____________________________________________________________________ 11
Figure 1.9 | HhH superfamily motifs represented in E. coli Endo III (PDB ID 2ABK). ______________________ 12
Figure 1.10 | Sequence alignment between nth gene products. _____________________________________ 12
Figure 1.11 | Crystal structure of Geobacillus stearothermophilus Endo III bound to DNA containing an abasic
site (PDB ID 1P59). _________________________________________________________________________ 13
Figure 1.12 | DNA‐mediated CT attenuation by the presence of an abasic site or other lesions that affect
dynamic stacking. __________________________________________________________________________ 15
Figure 1.13 | Proposed model for long‐range DNA‐mediated CT in DNA repair. _________________________ 16
Figure 1.14 | Schematic representation of the type of methodology used in the electrochemical studies of Endo
III on HOPG, with and without electrode DNA‐modification [33]. ____________________________________ 17
Figure 1.15 | Cyclic voltammetry assays of Endo III on a DNA‐modified HOPG electrode. _________________ 18
Figure 1.16 | Cyclic voltammetry assays of Endo III on a bare HOPG electrode. _________________________ 18
Figure 1.17 | Illustration of the potentials vs. NHE for the redox couples of Endo III in the presence and absence
of DNA, on HOPG electrode. _________________________________________________________________ 19
Figure 3.1 | pET21c(+)‐Endo III cloning vector map. _______________________________________________ 23
Figure 3.2 | Schematic representation of the homologous overexpression of recombinant Endo III in E. coli, in
2xYT medium. _____________________________________________________________________________ 25
Figure 3.3 | Endo III production time course in 2xYT medium, analyzed by SDS‐PAGE. ___________________ 26
Figure 3.4 | Purity assessment of fractions collected from the Resource S chromatographic column by SDS‐
PAGE. ___________________________________________________________________________________ 27
Figure 3.5 | UV‐Vis spectrum of pure Endo III overexpressed in 2xYT medium. _________________________ 27
Figure 3.6 | Schematic representation of the homologous overexpression of recombinant Endo III in E. coli, in
M9 medium. ______________________________________________________________________________ 29
Figure 3.7 | Endo III production time course in M9 medium, analyzed by SDS‐PAGE. ____________________ 30
Figure 3.9 | Purity assessment of fractions collected from the Resource S chromatographic column by SDS‐
PAGE. ___________________________________________________________________________________ 31
Figure 3.10 | UV‐Vis spectrum of pure Endo III overexpressed in M9 medium. _________________________ 31
Figure 4.1 | UV‐Vis spectrum of Rubredoxin. ____________________________________________________ 34
Figure 4.2 | UV‐Vis spectrum of pure Endo III. ___________________________________________________ 34
Figure 4.3 | Calibration curve obtained with Rubredoxin standard for the Lowry method. ________________ 35
Figure 4.4 | Phenanthroline‐iron complex formation. _____________________________________________ 36
Figure 4.5 | Calibration curve for iron quantification using 1,10 ‐ Phenanthroline method. ________________ 37
Figure 5.1 | Schematic representation of the production of pUC18 in NZY5α cells. ______________________ 39
Figure 5.2 | pUC18 plasmid purity assessement by a 0.8 % agarose gel electrophoresis. __________________ 40
Figure 5.3 | pUC18 hidrolysis efficiency assessed by a 0.8 % agarose gel electrophoresis. _________________ 41
Figure 5.4 | A – Cabinet used in the UV irradiation experiments; B – Control unit and UV light on/off indicator
(blue light means its on); C – Cabinet’s interior, with the lifting sampler, the temperature sensor in the middle
of it and a graduated scale (on the right); D – Air exhaust and cylindrical Philips TUV PL‐S 5W/2P 1CT lamp. __ 42
Figure 5.5 | Photo‐radiometer HD2102.2 (Delta Ohm) with a probe LP471UVC (Delta Ohm). ______________ 42
Figure 5.6 | Effects of UV radiation on linear pUC18, assessed by 0.8 % agarose gel electrophoresis. ________ 43
Figure 5.7 | Linear pUC18 degradation with increasing time of UV radiation exposure. ___________________ 44
Figure 5.8 | Effects of UV radiation on supercoiled pUC18, assessed by 0.8 % agarose gel electrophoresis. ___ 45
Figure 5.9 | Effects of UV radiation on supercoiled pUC18, assessed by 0.8 % agarose gel electrophoresis. ___ 46
Figure 5.10 | Conversion of DNA supercoiled form to linear form with increasing time of UV radiation exposure.
________________________________________________________________________________________ 47
Figure 6.1 | Effects of UV radiation on Endo III (9.24 µM), assessed by SDS‐PAGE. _______________________ 49
Figure 6.2 | UV‐Vis spectrum of irradiated Endo III samples. _______________________________________ 50
Figure 7.1 | A – Binding of Endo III to supercoiled pUC18 in 0.1 M Tris‐HCl, pH 7.1 tested by EMSA. B ‐
Densitometric quantification of free control pDNA and complex band. _______________________________ 51
Figure 7.2 | Hill plot of Endo III binding to supercoiled DNA from EMSA. ______________________________ 52
Figure 7.3 | Binding of Endo III to linear pUC18 in 0.1 M Tris‐HCl, pH 7.1 tested by EMSA. ________________ 53
Figure 7.4 | Hill plot of Endo III binding to linear DNA from EMSA. ___________________________________ 53
Figure 7.5 | Binding of Endo III to supercoiled pUC18 in 50 mM Tris‐HCl, pH 7.1 tested by EMSA. __________ 54
Figure 7.6 | EMSAs with different periods of exposure to radiation. __________________________________ 56
Figure 8.1 | Endo III 3D‐structure (A) and its superficial electrostatic charge (B). ________________________ 59
Figure 8.2 | A – Experimental setup used in electrochemical assays. B – Electrochemical cell of one
compartment with a three‐electrodes configuration. ______________________________________________ 60
Figure 8.3 | Schematic representation of the methodology used in the electrochemical studies with Endo III on
PG. _____________________________________________________________________________________ 61
Figure 8.4 | Cyclic voltammogram of 183.88 M Endo III and comparison with the blank, obtained on bare PG
at = 50 mV/s. ____________________________________________________________________________ 61
Figure 8.5 | Plot of current intensity versus applied scan rate. ______________________________________ 63
Figure 8.6 | A – Plot of potential difference versus applied scan rate. B – Plot of anodic potential versus
logarithmic scan rate. _______________________________________________________________________ 63
Figure 8.7 | Endo III surface area determination (PDB ID 2ABK). _____________________________________ 66
Figure 8.8 | Cyclic voltammogram of Endo III at higher concentration and comparison with the blank, obtained
on bare PG at = 20 mV/s. __________________________________________________________________ 67
Figure 8.9 | Cyclic voltammograms of Endo III, obtained at small scan rates on bare PG. _________________ 67
Figure 8.10 | Variations of ∆ with 1/m. _____________________________________________________ 69
Figure 8.11 | Plot of estimated heterogeneous electron‐transfer rate constant versus applied scan rate. ____ 69
Figure 9.1 | Cyclic voltammograms of Endo III sample, before and after UV irradiation, obtained on bare PG at
= 5 mV/s. _________________________________________________________________________________ 71
Figure 9.2 | Cyclic voltammograms of pUC18 sample, before and after UV irradiation, obtained on bare PG at
= 5 mV/s. _________________________________________________________________________________ 72
Figure 9.3 | Cyclic voltammograms of the adsorbed complex, before and after UV irradiation, obtained on PG
at = 5 mV/s. _____________________________________________________________________________ 73
Figure 9.4 | Comparison of the cyclic voltammograms of Endo III, pUC18 and complex samples, before UV
irradiation, obtained on PG at = 5 mV/s. ______________________________________________________ 74
Figure 9.5 | Comparison of the cyclic voltammograms of Endo III, pUC18 and complex samples, after UV
irradiation, obtained on PG at = 5 mV/s. ______________________________________________________ 75
Figure 9.6 | Superimposition of protein and DNA stainings of the gel obtain by an EMSA performed with
protein‐DNA complex that was exposed to UV radiation for different periods of time. ___________________ 76
Figure 9.7 | Scheme of application of potentials in DPV. ___________________________________________ 77
Figure 9.8 | Differential pulse voltammograms of Endo III sample, before and after Uv irradiation, obtained on
PG, with 25 mV pulse amplitude and 5 mV step potential. __________________________________________ 78
Figure 9.9 | Differential pulse voltammograms of pUC18 sample, before and after UV irradiation, obtained on
PG, with 25 mV pulse amplitude and 5 mV step potential. __________________________________________ 78
Figure 9.10 | Differential pulse voltammograms of the adsorbed complex, before and after UV irradiation,
Figure 9.11 | Comparison of the differential pulse voltammograms of Endo III, pUC18 and protein‐DNA complex
samples, before UV irradiation, obtained on PG, with 25 mV pulse amplitude and 5 mV step potential. _____ 80
Figure 9.12 | Comparison of the differential pulse voltammograms of Endo III, pUC18 and protein‐DNA complex
samples, after UV irradiation, obtained on PG, with 25 mV pulse amplitude and 5 mV step potential. _ _____ 81
Figure 10.1 | Effects of 20 min of UV radiation exposure both on free Endo III and Endo III‐DNA complex. ___ 84
Figure E. 1 | A. NZYTech Low Molecular Weight (LMW) Standard. __________________________________ 109
Figure E. 2 | NZYDNA Ladder III (NZYTech) Standard. _____________________________________________ 110
Figure G. 1 | pUC18 cloning vector map. ______________________________________________________ 113
Figure I. 1 | Schematic representation of methods and conditions used in the electrochemical assays. _____ 116
Figure J. 1 | Voltammogram for pyrolytic graphite electrode test at various scan rates. _________________ 117
Figure J. 2 | Plot of the current peaks versus the square root of the applied scan rates, both for anodic and
cathodic peaks. ___________________________________________________________________________ 118
Tables Index
Table 1.1 | Human base excision repair DNA glycosylases, their substrate specificity and their homologous in
other species. Adapted from [8, 9, 17]. _________________________________________________________ 10
Table 4.1 | Molecular mass and aromatic amino acids composition of Endo III, Rubredoxin and BSA. _______ 33
Table 4.2 | Determination of iron content in Endo III. _____________________________________________ 37
Table 5.1 | Radiation doses used in irradiation assays. ____________________________________________ 43
Table 9.1 | Summary table of the midpoint potentials obtained by CV and DPV. ________________________ 81
Table C. 1 | Composition for 1 L LB or LB/Agar culture media. ______________________________________ 103
Table C. 2 | Composition for 1 L 2xYT medium broth. ____________________________________________ 103
Table C. 3 | Reagents used in the preparation of M9 Salts (10X) solution. ____________________________ 104
Table C. 4 | Composition of the medium to be sterilized. _________________________________________ 104
Table C. 5 | Reagents used in the preparation of M9 Medium. _____________________________________ 104
Table C. 6 | Reagents used in the preparation of vitamins solution (200x).____________________________ 105
Table E. 1 | Volumes of each solution used for a 12.5 % of acrylamide SDS‐PAGE. ______________________ 107
Table E. 2 | Stock solutions used for SDS‐PAGE. _________________________________________________ 108
Table F. 1 | Solutions used for Lowry’s method [9]. ______________________________________________ 111
Table F. 2 | Reagents and volumes (in mL) used for the calibration curve. ____________________________ 112
Table G. 1 | Composition of the reaction mixture for pUC18 hydrolysis. ______________________________ 113
Table I. 1 | Summary table of all the assays done until the Endo III electrochemical signal was obtained. ___ 115
Chapter 1 Introduction
During a lifetime, organisms are constantly exposed to harmful agents, both exogenous and endogenous, that may cause damage and jeopardize the integrity of their genome.
1.1DNA damage and its consequences
1.1.1Damage to the DNA nucleobases
A perplexing myriad of lesions threatens DNA integrity in three main ways. First, some chemical bonds in DNA tend to spontaneously disintegrate under physiological conditions. The simplest reaction that is potentially harmful to DNA is the spontaneous hydrolysis of nucleotide residues (depurination/depyrimidination), resulting in abasic sites (1, Figure 1.1). These are very base‐labile and can continue to fragment, in a spontaneous fashion, to form cytotoxic single‐strand breaks. Spontaneous or induced deamination of cytosine, adenine, guanine or 5‐methylcytosine converts the bases to the miscoding uracil (2), hypoxanthine, xanthine and thymine, respectively [1].
Figure 1.1 | Examples of common lesions to DNA. Abasic sites (1) and uracil (2) arise from hydrolysis; oxidative
damage results in the formation of 8‐oxoguanine (3) and thymine glycol (4); methylating agents form, among others, 3‐methyladenine (5) and O6‐methylguanine (6). UV radiation induces the formation of photoadducts
such as the cyclobutane pyrimidine dimers (CPD, 7) and (6‐4) photoadducts (8). Adapted from [2].
Second, the products of our own metabolism – byprodutcs – can have harmful effects on DNA. Enzymatic reactions have an error rate, and their reaction products include free radicals, such as reactive oxygen species (ROS) and reactive nitrogen species (RNS), products of lipid peroxidation (oxidation of polyunsaturated fatty acids in lipids) and endogenous alkylating agents [3]. ROS, such as superoxide anions, hydroxyl radicals and hydrogen peroxide, are a natural byproduct of the normal metabolism of oxygen [2]; however, exposure to environmental stress (e.g., UV or heat exposure), may increase ROS levels dramatically, leading to a condition known as oxidative stress. The most prominent oxidative base adducts include mutagenic 8‐oxoguanine (3) and thymine glycol (4), which can block DNA transcription and replication. Cofactors of enzymatic reaction can accidently methylate DNA to form the relative harmless 7‐methylguanine, cytotoxic 3‐methyladenine (5) and the mutagenic and cytotoxic O6‐methylguanine (6) [2].
In addition to lesions arising from normal cellular metabolism, there are numerous exogenous sources of damage. Harmful environmental agents include ultraviolet (UV) components of sunlight, ionizing radiation and genotoxic chemicals, such as cigarette smoke, alcohol or biocides and pesticides [3–5]. For many organisms, including humans, one of the most important environmental mutagen is the UV radiation. This type of radiation also lead to the formation of dipyrimidine photoadducts, principally cyclobutane pyrimidine dimers (CPD, 7) and (6‐4) photoadducts (8) [6]. Furthermore, excess of UV radiation can lead to ROS formation, as aforementioned.
1.1.2Damage to the DNA backbone and Interstrand Crosslinks
This type of injury occurs mostly through oxidation of the deoxyribose sugar, whose hydrogen atoms are highly reactive toward ROS. The primary products of these fragmentations are single‐ strand breaks (SSBs) (1, Figure 1.2). On the other hand, double‐strand breaks (DSBs) (2, Figure 1.2) are induced by ionizing radiation, X‐rays and chemotherapeutic drugs. DSBs can also occur during replication of SSBs and repair of interstrand crosslinks (ICLs) [2–4]. ICLs are highly cytotoxic because they block all processes that necessitate the separation of the two DNA strands (e.g., DNA replication and transcription) [2].
Figure 1.2 | ROS, ionizing radiation, X‐rays and chemotherapeutic drugs are examples of agents that fragment
deoxyribose sugars in DNA. These fragmentations lead to the formation of single‐ (SSBs, 1) and double‐strand
breaks (DSBs, 2). Adapted from [2].
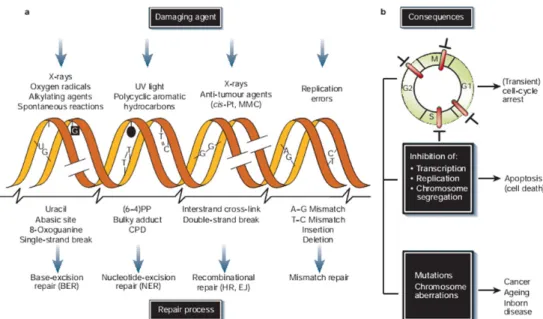
The outcome of DNA damage is diverse and generally adverse. Some lesions are primarily mutagenic, others mainly cytotoxic and cytostatic [3]. While acute effects, such as inhibition of transcription and replication, trigger cell‐cycle arrest or cell death (apoptosis), long‐term effects, namely irreversible mutations and chromosome aberrations, lead to ageing and oncogenesis [4]. As stated before, many lesions block transcription and can also interfere with DNA replication. Figure 1.3 provides an overview of the most important agents that cause DNA damage, the lesions formed, and the repair pathways employed to remove these lesions from DNA.
Figure 1.3 | DNA damage and repair mechanisms. a) Damaging agents (both of endogenous and exogenous
nature) cause DNA lesions that are counteract by lesion‐specific DNA repair systems; b) Acute effects arising from DNA damage can trigger cell‐cycle arrest or inhibition of DNA metabolism, which in turn can lead to
apoptosis. On the other hand, long‐term consequences of DNA injury can lead to ageing or oncogenesis.
Abbreviations: cis‐Pt and MMC, cisplatin and mitomycin C, respectively (both DNA‐crosslinking agents); (6–4)PP
and CPD, (6–4) photoproduct and cyclobutane pyrimidine dimer, respectively (both induced by UV light); HR, homologous recombination; EJ, end joining [4].
1.2DNA repair systems
As a consequence of the diversity of DNA injuries, cells have developed a sophisticated DNA maintenance apparatus, consisting of different repair systems (Figure 1.3). Although each system focus on a specific category of DNA lesion, as a whole they counteract most of the potentially mutagenic and cytotoxic lesions in order to re‐establish the correct genome structure [3, 4]. DNA damage causes a temporary arrest of cell‐cycle progression, allowing repair to take place prior to replication [7]. No correction procedure is going to be absolutely exact and error‐free, but repair of common DNA lesions clearly demands highly accurate performance [6]. The main, partly overlapping, DNA repair systems operating in mammals are direct repair (DR), base excision repair (BER), nucleotide excision repair (NER), mismatch repair (MMR), homologous recombination (HR) and non‐ homologous end joining (NHEJ) [4]. The first two systems are rather simple in molecular terms and their mechanisms have already been described in some detail; in contrast, the others are more complex repair pathways that are not yet fully understood [2].
1.2.1Direct repair
mutagenic lesion pairs with both C or T and is capable of fooling the mismatch repair system into triggering futile rounds of mismatch removal and subsequent reincorporation of the erroneous base by repair replication. The specific methyltransferase flips out the methylated nucleoside from DNA, accommodates it in its active‐site pocket, removes the deleterious non‐native methyl group from the guanine residue and transfers it to an internal cysteine. However, S‐methylcysteine is chemically very stable, so the protein irreversibly inactivates itself. This illustrates how in some situations an entire protein may be sacrificed for the repair of a single damaged base [3, 6].
1.2.2Homologous recombination and Non‐homologous end joining
HR is a highly complex and accurate pathway that uses an intact homologous DNA molecule as a template to repair a DSB. NHEJ is a relatively simple and not so accurate system that involves the re‐ ligation of broken DNA ends and does not require a homologous template [2] (Figure 1.4).
HR NHEJ
Figure 1.4 | Homologous recombination (HR) and non‐homologous end joining (NHEJ) repair systems. HR is
initiated by the recognition of a DSB by Rad52 protein. To promote strand invasion, the 5’‐3’ exonuclease
activity of the Rad50/Mre11/Nbs1 complex expose both 3’ ends. The ssDNA ends are bound by RPA protein. A
joint molecule between the damaged (red template) and undamaged DNA (blue template) is generated by a branch migration reaction involving various proteins. DNA polymerases and their associated factors carry out
repair synthesis (sequences in green) and Holliday junctions are formed. These are resolved by endonucleolytic
cleavage and rejoining in a reaction that may involve the Mus81 protein. In NHEJ mechanism, DSBs are
recognized by the Ku70 and Ku80 proteins, which specifically bind to DNA ends and form a complex with the DNA‐dependent protein kinase catalytic subunit (DNA‐PKCS). The ends of the break may be processed in a step
involving Rad50/Mre11/Nbs1 complex. This and XRCC4/DNA ligase IV complexes may be involved in the
processing and bridging of the DNA ends. The break is then sealed by XRCC4/DNA ligase IV. Adapted from [2].
Ku70 Ku80 DNA PKcs XRCC4 Lig4 ligation
processing and
bridging of ends
end binding
DSB
end recognition and processing
Holliday junction
Resolvase (Mus81 ?)
Polymerase /ε
+ associated factors
RPA, Rad51, Rad52,
Rad54, Rad51 paralogs
Brca2
Rad52
Rad50/Mre11/Nbs1
Nuclease(s)
strand invasion
repair synthesis
branch migration
1.2.3Nucleotide excision repair and Mismatch repair
Two of the three DNA excision repair systems that remove most of the damaged or inappropriate bases in DNA are the nucleotide excision repair (NER) and the mismatch repair (MMR).
NER is, probably, the most complicated of the excision repair systems. It deals with the wide class of bulky, helix‐distorting lesions that interfere with base pairing and generally obstruct transcription and normal replication. Two NER subpathways exist with partly distinct substrate specificity: global genome NER (GG‐NER) surveys the entire genome for distorting injury, and transcription‐coupled repair (TCR) deals with damage that blocks elongating RNA polymerases [2 , 4, 6]. On the other hand, MMR minimizes replication errors by a systematic survey of newly synthesized strands. It removes nucleotides mispaired by DNA polymerases and insertion/deletion (ranging from one to ten or more bases) that result from slippage during replication or recombination [4] (Figure 1.5).
GG‐NER TCR MMR
Figure 1.5 | Nucleotide excision repair (NER) and mismatch repair (MMR) systems.
CSA
CSB
NER lesion on a DNA
strand
lesion recognition
partial opening of DNA helix around
the lesion
TFIIH (helicase subunits XPB/XPD)
XPC‐hHR23B
stalled RNA polymerase
indicates a lesion
stalled RNA polymerase displacement
XPG
ERCC1‐XPF
full helix opening (stabilized by RPA) and damage verification (by XPA)
XPA/RPA
dual incision
XPG: 3’ incision / ERCC1‐XPF: 5’ incision
25‐32 nucleotides
containing the lesion
Repair synthesis and ligation
Replication factors
DNA ligase I
mismatch
mismatch recognition
MSH2/6 heterodimer (MutS)
or
MSH2/3 heterodimer (MutS)
exonuclease(s)
DNA helicases (?)
interaction of MLH complexes with
MSH complexes and replication
factors
PCNA
formation of a loop structure with
the MMR proteins at the base and mismatch lesion in the loop
Repair synthesis and ligation
Replication factors
DNA ligase I MLH1/PMS2 heterodimer (MutL)
or
MLH1/PMS1 heterodimer (MutL)
degradation of the error‐containing
1.2.4Base excision repair
The other mechanism belonging to DNA excision repair systems is the base excision repair. This system will be explained in much more detail because one of its core components is the subject of study in this thesis.
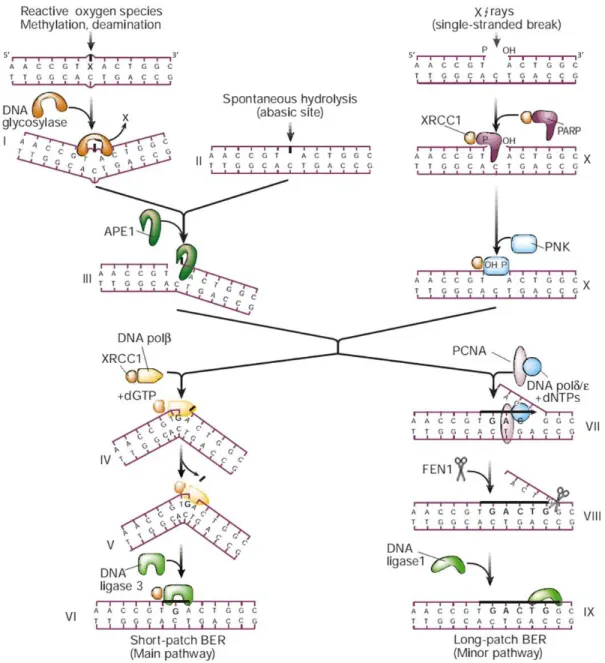
BER removes subtle, non‐bulky, DNA lesions through a “cut‐and‐patch” multistep mechanism that involves the participation of several enzymes. This robust and dynamic repair system is the main guardian against damage due to cellular metabolism, which includes oxidative lesions, methylation, deamination and hydroxylation products, spontaneous hydrolysis, and different kinds of single‐ strand breaks [1, 3, 4, 8]. These injuries may or may not impede transcription and replication, although they frequently miscode; BER is therefore particularly relevant for preventing mutagenesis [4]. BER is also one of the major systems that repair oxidative DNA damage caused by ROS (arising from ionizing radiation), to both purines and pyrimidines [7]. Compared with other DNA repair systems, BER is highly conserved from bacteria to human in terms of the core components of its machinery, for example, at the level of DNA glycosylases, key initiators of this repair system [5, 9, 10].
BER occurs in two overall steps and requires the coordinated action of only four enzymes: a DNA glycosylase, followed by apurinic/apyrimidinic (AP) endonuclease (APE1), DNA polymerase β and DNA ligase. The first step in this cascade, damage‐specific recognition and excision, is carried out by one of many DNA glycosylases that recognize damaged or mismatched bases and excise them from DNA. The second, a damage‐general processing, is accomplished by the three early mentioned downstream enzymes that carry out strand incision, gap‐filling and ligation, respectively [8, 10–12].
AP sites can be more cytotoxic and mutagenic than base lesions [1, 2, 6, 11]. When bound to DNA, APE1 hydrolyses the phosphodiester bond 5’ to the AP site to generate a nick (III). Then, this enzyme interacts and recruits to the site of repair the next enzyme in the BER pathway, polymerase (pol) [6]. In mammals, the so‐called short‐patch repair is the dominant mode for the remainder of the reaction. In this main pathway, DNA pol performs a one‐nucleotide gap‐filling reaction in the newly generated 3’‐OH (IV) and excises the 5’‐terminal abasic sugar‐phosphate residue at the strand break via its AP lyase activity (V) [4]. The nick in DNA is then sealed by DNA ligase III, restoring the integrity of the helix [2]. DNA ligase forms a heterodimer with the non‐catalytic XRCC1 protein (VI) and since pol also interacts with it, this subunit acts as a scaffold protein by bringing the polymerase and ligase together at the site of repair; further stabilization of the complex may be achieved by direct binding of the NH2‐terminal region of XRCC1 to the DNA single‐strand break [6–8].
A minor pathway of BER, the long‐patch repair, may instead occur in cases where the terminal sugar‐phosphate residue has a more complex structure that is relatively resistant to cleavage by the AP lyase function of pol . This minor pathway relies on DNA polimerases or that incorporate 2– 10 nucleotides after the AP site (VII) and the proliferating cell nuclear antigen (PCNA), a replication factor that acts as a DNA polymerase clamp, hence enhancing the activity of DNA pol /. The flap structure‐specific endonuclease (FEN‐1) binds PCNA and excises the displaced DNA flap (VIII). In this context, FEN‐1 binding to PCNA stimulates FEN‐1 endonuclease activity. Taken together, these findings suggest that PCNA promotes long‐patch BER via its ability to interact with and coordinate the enzymatic activities of a DNA polymerase and endonuclease FEN‐1. Therefore, PCNA acts as a scaffold protein in this alternative pathway in a way similar to that of XRCC1 in the main pathway. Finally, the last step in this minor pathway is the nick sealing by DNA ligase I (IX) [6, 8, 10, 14].
As described before, ROS and some exogenous agents, such as X‐rays, can cause SSBs by destruction of deoxyribose residues. Such damages are processed and repaired by the same enzymes that are responsible for the later stages of BER. An abundant nuclear protein, poly(ADP‐ribose) polymerase (PARP), which binds to and is activated by DNA strand breaks, and the recently identified polynucleotide kinase (PNK) (X) may be important when BER is initiated from a SSB to temporary protect and trim the ends for repair synthesis, acting as antirecombinogenic factors. PARP, as pol and ligase III, interacts with the scaffold protein XRCC1 and may in this way accelerate the recruitment of these enzymes to the site of repair [4, 6].
Figure 1.6 | Overview of base excision repair (BER) mechanism, with both short‐ (left) and long‐patch (right)
repair pathways. SSB repair system is also shown. Adapted from [4].
Although individual enzymes mediate each step in BER, the pairwise interactions between them indicated that this is a highly coordinated process, which ensures smooth repair of both abasic sites and strand‐break intermediates, that are by themselves highly toxic and mutagenic [2, 9].
1.2.4.1 DNA glycosylases
As aforementioned, the key initiators of the BER system are DNA glycosylases, highly efficient enzymes that recognize and excise damaged bases. Although all DNA glycosylases cleave glycosidic bonds, they differ in their reaction mechanisms [15]. Indeed, these enzymes fall into two mechanistic classes: pure monofunctional glycosylases and bifunctional N‐glycosylases (base excision)/AP lyases (strand nicking). As seen in Figure 1.7, the former use a water molecule as a nucleophile to cleave the N‐glycosidic bond, leaving an AP site, which will be processed by an enzyme with AP lyase activity, such as APE1. The latter use an amino group (lysine residue) of the enzyme as a nucleophile for cleavage. This generates a covalent intermediate (Schiff base), which can undergo a ‐elimination (associated AP lyase activity), leading to cleavage of the C3’‐O bond and strand scission [2, 7, 13]. In this case, pol lyase activity is not required [2].
Figure 1.7 | Reaction mechanism of DNA glycosylases. First, DNA glycosylases recognize a base damage and
bind to it (1). Monofunctional DNA glycosylases use a water molecule as a nucleophile, which attacks the C1' of
the target nucleotide, leaving an AP site (4). In the case of bifunctional glycosylases, the nucleophilic attack
involves an amino group (lysine residue) of the enzyme (Nuc) and the reaction yields a covalent intermediate (Schiff base) formed by the enzyme and C1' of the target nucleotide (2), thus expelling the damaged base. Additional reactions catalyzed by this enzyme leads to Schiff base ‐elimination, resulting in C3'‐O bond
cleavage (3). Schiff base intermediate (2) can be reduced by sodium borohydride (NaBH4), resulting in a stable, covalently “trapped” protein–DNA adduct (5), which has been used in various structural studies ([16] and references therein). Adapted from [13].
Most DNA glycosylases remove structurally different bases, while a few have very narrow substrate specificity. This information was obtained by cloning and characterization of several DNA glycosylases, including eleven distinct human DNA glycosylases (Table 1.1).