ScienceDirect
Available online at www.sciencedirect.com
Procedia Engineering 209 (2017) 195–201
1877-7058 © 2017 The Authors. Published by Elsevier Ltd.
Peer-review under responsibility of the scientific committee of the Urban Subsurface Planning and Management Week. 10.1016/j.proeng.2017.11.147
10.1016/j.proeng.2017.11.147
© 2017 The Authors. Published by Elsevier Ltd
Peer-review under responsibility of the scientific committee of the Urban Subsurface Planning and Management Week.
1877-7058
ScienceDirect
Procedia Engineering 00 (2017) 000–000
www.elsevier.com/locate/procedia
1877-7058 © 2017 The Authors. Published by Elsevier Ltd.
Peer-review under responsibility of the scientific committee of the Urban Subsurface Planning and Management Week.
Urban Subsurface Planning and Management Week, SUB-URBAN 2017, 13-16 March 2017,
Bucharest, Romania
Subsurface dynamic evaluation to identify old quarries in urban
areas: Lisbon city case study.
J. Cunhaª, L. M.S. Gonçalves
a,ᵇ
,c*, F. Aguilera
c, P. A. Roldan
c, C. Pinto
d,eaNova IMS – Information Management School, Lisbon, 1070-312, Portugal bInstitute for Systems and Computers Engeneering ata Coimbra, Coimbra, 3000 – 033, Portugal cSchool of Technology and Management, Polytechnic Institute of Leiria, Leiria, 2411-911, Portugal
dMunicipality Council of Lisbon, Lisbon, 1749-099, Portugal eFaculty of Sciences, University of Lisbon, Lisbon, 1749-016, Portugal
Abstract
The urban expansion over the last century in Lisbon has created a lot of pressure in the suburbs leading to construction taking place in less favourable terrains. These areas were also occupied by an extensive mining industry, for the extraction of massive limestones for building and ornamental stone that had an important role for the reconstruction of Lisbon after the earthquake of 1755. Due to its heavily urbanized landscape in the last century, the terrain morphology is often changed by non-natural processes such as excavations and landfill deposits and nowadays the exact location where these exploitations took place is unknown leading to potential risk situations for buildings, infrastructures and the local population. The aim of this study was to perform a detailed subsurface dynamic analysis to locate the quarries and their landfill material thickness. For that, cartographic and topographic information dating from 1911, 1950, 1970, 2012 were used to create digital terrain models which allowed the terrain morphology changes to be identified and the volume of landfill materials to be obtained. This study enables the Town Hall to create constraints in land use in their Master Plan and other planning instruments to reduce cost increases and the risk of hazards.
© 2017 The Authors. Published by Elsevier Ltd.
Peer-review under responsibility of the scientific committee of the Urban Subsurface Planning and Management Week. Keywords: Lisbon; Sustainable urban planning; Hazards; Ancient quarries; Landfill materials;
* Corresponding author. Tel.: +351 919 683 111; E-mail address: [email protected]
ScienceDirect
Procedia Engineering 00 (2017) 000–000www.elsevier.com/locate/procedia
1877-7058 © 2017 The Authors. Published by Elsevier Ltd.
Peer-review under responsibility of the scientific committee of the Urban Subsurface Planning and Management Week.
Urban Subsurface Planning and Management Week, SUB-URBAN 2017, 13-16 March 2017,
Bucharest, Romania
Subsurface dynamic evaluation to identify old quarries in urban
areas: Lisbon city case study.
J. Cunhaª, L. M.S. Gonçalves
a,ᵇ
,c*, F. Aguilera
c, P. A. Roldan
c, C. Pinto
d,eaNova IMS – Information Management School, Lisbon, 1070-312, Portugal bInstitute for Systems and Computers Engeneering ata Coimbra, Coimbra, 3000 – 033, Portugal cSchool of Technology and Management, Polytechnic Institute of Leiria, Leiria, 2411-911, Portugal
dMunicipality Council of Lisbon, Lisbon, 1749-099, Portugal eFaculty of Sciences, University of Lisbon, Lisbon, 1749-016, Portugal
Abstract
The urban expansion over the last century in Lisbon has created a lot of pressure in the suburbs leading to construction taking place in less favourable terrains. These areas were also occupied by an extensive mining industry, for the extraction of massive limestones for building and ornamental stone that had an important role for the reconstruction of Lisbon after the earthquake of 1755. Due to its heavily urbanized landscape in the last century, the terrain morphology is often changed by non-natural processes such as excavations and landfill deposits and nowadays the exact location where these exploitations took place is unknown leading to potential risk situations for buildings, infrastructures and the local population. The aim of this study was to perform a detailed subsurface dynamic analysis to locate the quarries and their landfill material thickness. For that, cartographic and topographic information dating from 1911, 1950, 1970, 2012 were used to create digital terrain models which allowed the terrain morphology changes to be identified and the volume of landfill materials to be obtained. This study enables the Town Hall to create constraints in land use in their Master Plan and other planning instruments to reduce cost increases and the risk of hazards.
© 2017 The Authors. Published by Elsevier Ltd.
Peer-review under responsibility of the scientific committee of the Urban Subsurface Planning and Management Week. Keywords: Lisbon; Sustainable urban planning; Hazards; Ancient quarries; Landfill materials;
* Corresponding author. Tel.: +351 919 683 111; E-mail address: [email protected]
1. Introduction
In Lisbon, as in many places in the world, the establishment of the urban nucleus and its temporal development were conditioned by geological and geomorphological factors. There is also a close link between extractive activities and the economic and social development of the city, as well as the evolution of urban spaces. A significant use of regional stones in Lisbon occurred in Roman times (e.g. the Roman theatre, 1st century AD), but the greatest extractive activity occurred with the reconstruction of Lisbon after the earthquake of 1755. Urban expansion has led to limestone, basalts and mudstones exploitation, in ancient quarries located in Lisbon. Several building facades and monuments in the city are made with Cretaceous and Miocene limestones. It was also used in Lisbon sidewalks. Basalts were applied in gravel and street pavements and the mudstones and sandstones were used in clay and cement industries, respectively.
During the 20th century, the lack of space in the city of Lisbon, led not only to an extensive construction in the consolidated city area, both in terms of height and depth, to provide better conditions for the inhabitants (basements, underground parking and subway tunnels), but also an expansion to the suburbs over areas underlain by unstable ground such as quarries that were filled with anthropogenic heterogeneous materials with variable thicknesses which create geotechnical problems [1]. These occurrences, which are usually not considered in geological maps significantly, alter the nature and the geotechnical properties of the upper layers of soil, and thus, their response to the external factors, such as intense or prolonged rainfall events, earthquakes, upstream overcharges, foothill discharges, concentrated infiltrations and vibrations of anthropic origin [2]. Over the last decades, several investigations were performed dealing with ground instability problems in urban areas related to, natural caves or man-made cavities and landfill areas (e.g. [3], [4]). To mitigate these problems, it is important to have a sustainable urban planning which involves detailed knowledge of subsurface characteristics.
The present study consists of the subsurface dynamic analysis of the west part of the Lisbon municipality, where a significant number of quarries had existed during the last century. The goals consisted of the identification of the quarries areas, as nowadays there is a lack of documentation about their location, and the calculation of their landfill materials’ volume. The main objectives of this project consist of providing the city’s master plan with some information that allows this document to provide a sustainable urban planning, and a detailed knowledge of the surface and subsurface characteristics.
To perform the study, altimetric data obtained from topographic and photogrammetric maps of the city of Lisbon, produced in 1911, 1950, 1970 and 2012, provided by the Town Hall, were used to produce digital terrain models (DTM’s), using Geographic Information System tools. The use of DTM’s allows the evaluation of the terrain relief changes, the identification of a significant number of quarries and the quantification of the volume of landfill materials. 1.1. Data and Study area
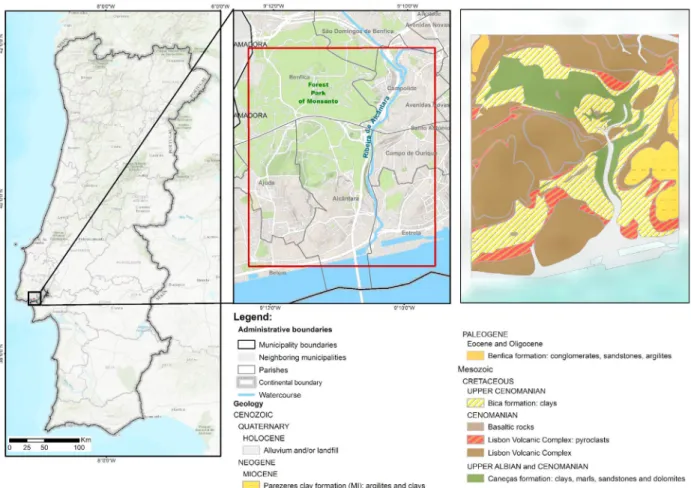
The study area belongs to Belém, Ajuda, Alcântara, Estrela, Campolide, Benfica e São Domingos de Benfica parishes, in an area of 17 km2 (fig. 1), a significant part of this area is occupied by the Forest Park of Monsanto, and another significant one is already occupied by the urban constructions, a fact that proves the relevance of this project.
In the geological context, it was possible to identify several different layers that were exploited in the ancient quarries located in the study area. These layers were composed of limestones, basalts, mudstones and sandstones. The geological setting of this area includes geological formations dating from the Upper Cretaceous and some sedimentary materials from the Miocene. The Upper Cretaceous Carbonate Complex represents a part of a sedimentary basin and it is mainly composed of limestone layers intercalated with marls [5]. This sector also presents a volcanic complex that resulted from one of the four volcanic stages caused by the opening rift of the Atlantic Ocean. This volcanic complex is composed of basaltic layers (lava flows), that were exploited in quarries, pyroclasts and ashes that are responsible for the highest reliefs in this region [6].
The geomorphological context of the area corresponds to a coastal relief [6], this being one of the most common in sedimentary basins in Portugal. These formations, are dissymmetric reliefs where an alternation between hard rock and soft rock exists.
The cartographic data used to perform the study was provided by the municipality council and it has different formats (analogic and digital), obtained from different methods (topographic and photogrammetric) and using different coordinate systems.
Fig. 1 - Geographic and geological setting of the study area 2. Methodology
To perform the study several steps were necessary since the cartography available has different formats (analog and digital), obtained using different methods (topographic and photogrammetric) and using different coordinate systems. The first step consisted of making a raster of the analog format maps (1911, 1950, 1970), georeferencing the obtained product and converting all the maps (1911, 1950, 1970, 2012) to the same coordinate system.
Due to bad storage conditions of 1911 topographic maps, which makes it difficult to extract the values of the altimetry contours lines, this information was only used to perform a visual analysis interpretation of the relief and to identify other quarries that could have existed before 1950.
The second step of the process consisted of building the DTM’s. In order to do that, it was necessary to extract from the raster file maps the altimetric data in a vector format by the vectorization of the contours and altimetry points. The comparison of the surfaces was made using an ArcGIS surface difference tool.
The boundaries and the contours of the quarries are the elements required by the GIS tools (TIN) to perform the DTM’s to understand the relief of the ancient quarries. The DTM’s performed by this tool, express a topological model of vectorial data. In this model the tridimensional coordinates, x,y (geographical location) and z (elevation), are linked forming a triangular irregular network (TIN).
1. Introduction
In Lisbon, as in many places in the world, the establishment of the urban nucleus and its temporal development were conditioned by geological and geomorphological factors. There is also a close link between extractive activities and the economic and social development of the city, as well as the evolution of urban spaces. A significant use of regional stones in Lisbon occurred in Roman times (e.g. the Roman theatre, 1st century AD), but the greatest extractive activity occurred with the reconstruction of Lisbon after the earthquake of 1755. Urban expansion has led to limestone, basalts and mudstones exploitation, in ancient quarries located in Lisbon. Several building facades and monuments in the city are made with Cretaceous and Miocene limestones. It was also used in Lisbon sidewalks. Basalts were applied in gravel and street pavements and the mudstones and sandstones were used in clay and cement industries, respectively.
During the 20th century, the lack of space in the city of Lisbon, led not only to an extensive construction in the consolidated city area, both in terms of height and depth, to provide better conditions for the inhabitants (basements, underground parking and subway tunnels), but also an expansion to the suburbs over areas underlain by unstable ground such as quarries that were filled with anthropogenic heterogeneous materials with variable thicknesses which create geotechnical problems [1]. These occurrences, which are usually not considered in geological maps significantly, alter the nature and the geotechnical properties of the upper layers of soil, and thus, their response to the external factors, such as intense or prolonged rainfall events, earthquakes, upstream overcharges, foothill discharges, concentrated infiltrations and vibrations of anthropic origin [2]. Over the last decades, several investigations were performed dealing with ground instability problems in urban areas related to, natural caves or man-made cavities and landfill areas (e.g. [3], [4]). To mitigate these problems, it is important to have a sustainable urban planning which involves detailed knowledge of subsurface characteristics.
The present study consists of the subsurface dynamic analysis of the west part of the Lisbon municipality, where a significant number of quarries had existed during the last century. The goals consisted of the identification of the quarries areas, as nowadays there is a lack of documentation about their location, and the calculation of their landfill materials’ volume. The main objectives of this project consist of providing the city’s master plan with some information that allows this document to provide a sustainable urban planning, and a detailed knowledge of the surface and subsurface characteristics.
To perform the study, altimetric data obtained from topographic and photogrammetric maps of the city of Lisbon, produced in 1911, 1950, 1970 and 2012, provided by the Town Hall, were used to produce digital terrain models (DTM’s), using Geographic Information System tools. The use of DTM’s allows the evaluation of the terrain relief changes, the identification of a significant number of quarries and the quantification of the volume of landfill materials. 1.1. Data and Study area
The study area belongs to Belém, Ajuda, Alcântara, Estrela, Campolide, Benfica e São Domingos de Benfica parishes, in an area of 17 km2 (fig. 1), a significant part of this area is occupied by the Forest Park of Monsanto, and another significant one is already occupied by the urban constructions, a fact that proves the relevance of this project.
In the geological context, it was possible to identify several different layers that were exploited in the ancient quarries located in the study area. These layers were composed of limestones, basalts, mudstones and sandstones. The geological setting of this area includes geological formations dating from the Upper Cretaceous and some sedimentary materials from the Miocene. The Upper Cretaceous Carbonate Complex represents a part of a sedimentary basin and it is mainly composed of limestone layers intercalated with marls [5]. This sector also presents a volcanic complex that resulted from one of the four volcanic stages caused by the opening rift of the Atlantic Ocean. This volcanic complex is composed of basaltic layers (lava flows), that were exploited in quarries, pyroclasts and ashes that are responsible for the highest reliefs in this region [6].
The geomorphological context of the area corresponds to a coastal relief [6], this being one of the most common in sedimentary basins in Portugal. These formations, are dissymmetric reliefs where an alternation between hard rock and soft rock exists.
The cartographic data used to perform the study was provided by the municipality council and it has different formats (analogic and digital), obtained from different methods (topographic and photogrammetric) and using different coordinate systems.
Fig. 1 - Geographic and geological setting of the study area 2. Methodology
To perform the study several steps were necessary since the cartography available has different formats (analog and digital), obtained using different methods (topographic and photogrammetric) and using different coordinate systems. The first step consisted of making a raster of the analog format maps (1911, 1950, 1970), georeferencing the obtained product and converting all the maps (1911, 1950, 1970, 2012) to the same coordinate system.
Due to bad storage conditions of 1911 topographic maps, which makes it difficult to extract the values of the altimetry contours lines, this information was only used to perform a visual analysis interpretation of the relief and to identify other quarries that could have existed before 1950.
The second step of the process consisted of building the DTM’s. In order to do that, it was necessary to extract from the raster file maps the altimetric data in a vector format by the vectorization of the contours and altimetry points. The comparison of the surfaces was made using an ArcGIS surface difference tool.
The boundaries and the contours of the quarries are the elements required by the GIS tools (TIN) to perform the DTM’s to understand the relief of the ancient quarries. The DTM’s performed by this tool, express a topological model of vectorial data. In this model the tridimensional coordinates, x,y (geographical location) and z (elevation), are linked forming a triangular irregular network (TIN).
The last step of this project is to find out the volume of the landfill materials that filled the quarries. In order to achieve that, a simple and practical way to perform this comparison was used. The volume was calculated by the prisms representation of the relief, performing a spacing quotas matrix H (m,n) [7], which means that the volume between the surface of the relief and the reference surface (0 quota), can be represented by the sum of the prisms in the matrix (1). ) ,1 ( = V 2 1 m 1 1 E H k n k (1) where, V – Volume m – Surface relief n – Reference surface
In conclusion, the volume is the portion of landfill that is found above the reference quota and it is given by the sum of the prisms that are between the reference quota and the surface. But there is also an important factor that should be considered when the volume is analyzed, which is the compaction of the landfill materials. The greater the compaction of the materials, the higher the volume should be (2).
VGC -V VGC =
(2)
where,
VGC – Volume grounded and compacted V – Excavated volume
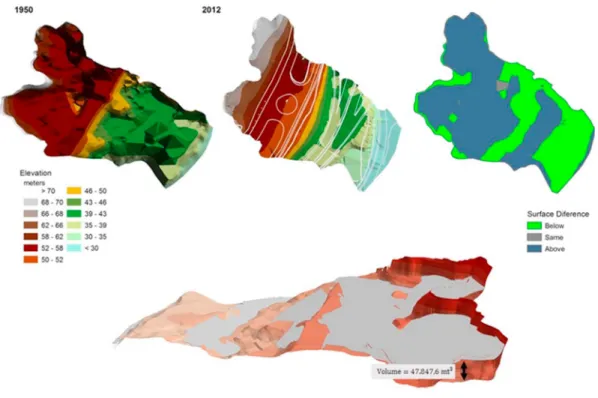
The VGC represents the volume of landfill materials deposited and the V means the excavated volume without any landfill material. In this project it is was impossible to determine the VGC, due to the fact that it is known that the landfill materials had heterogeneous forms and that makes it impossible to determine how compact the materials are. The comparison of the surfaces was made using ArcGIS surface difference tool. This tool provides the theoretical model that was described before (1), the tool generates the prisms model based on a surface reference that was set as input. The results of the output tool were divided into 3 parts (fig. 3 c): the surface that is above the surface reference, the surface that keeps the same shape and the surface that is below the surface reference. This means that the surface above the reference surface is in fact the one that includes the landfill materials, the surface that keeps the same shape is where no change has been detected in the comparison, and the surface that is below the reference surface means that the areas were excavated even more after the exploitation. According to this fact, only the areas where the surface is above the reference surface should be considered, and the results will be obtained by the sum of these prisms. 3. Results
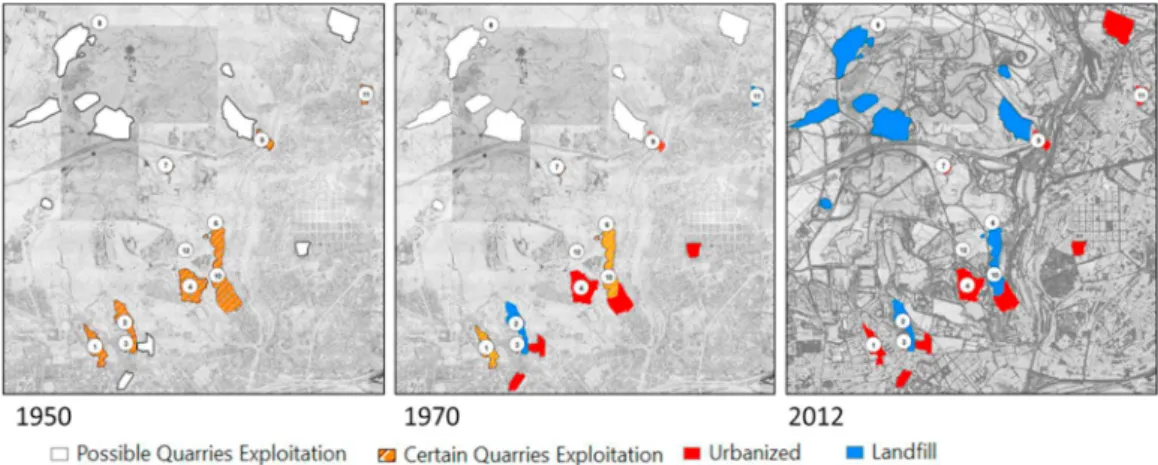
As a final result of the application of this methodology, it was possible to identify twenty five areas, with 90 hectares, and representing 5% of the study area, which presents significant changes such as excavation and landfill deposits, between 1950 and 2012. Twelve of these areas (35 ha) can definitely be considered as quarries. In 1970, 27% of the area occupied by the quarries displays landfill deposits and 22% was urbanized. In 2012, all the quarries display landfill deposits and 40% of the area is urbanized. Figure 2 shows the delimited areas of these quarries in 1950, 1970 and 2012 and the changes occurred due to urbanization.
Fig. 2 – Identification of the quarries location and the changes occurred due to the urbanization.
For example, the quarries designated as 2, 3, 4 and 9, could only be found in the cartographic survey of 1950 since the exploitation of those quarries only occurs in the 50’s or before, and in 1970 they were already covered with the landfill materials. However, 17% of the quarries exploitation continued after the 50’s and remained active until the 70’s. In the cartographic data of 1950 and 1970, there are a significant number of areas where the terrain morphology displays changes by non-natural processes such as excavation and landfill deposits but it is impossible to identify it as a definite exploitation. For that reason, it justifies a possible investment by the municipal council to be sure that those areas are safe and appropriate for new constructions.
The comparison of the DTMs of the 12 quarries considered as certain, between 1950, 1970 and 2012, using GIS tools, allowed 339.308,6 mt2 of area to be identified that were classified as active quarries and 1.456.023,4 mt3 of landfill materials (table1).
Table 1. Quarries Landfill Volume.
Total Area Landfill volume
Mt2 V= Mt3 Quarry 1 46.081,5 187.424,3 Quarry 2 53.488,8 214.557,2 Quarry 3 10.043,3 36.885 Quarry 4 69.688,2 157.196,5 Quarry 5 1.661,3 8.976 Quarry 6 6.489,2 63.238,2 Quarry 7 18.982,4 71.770,3 Quarry 8 7.275,5 49.981 Quarry 9 24.742,2 47.847,6 Quarry 10 56.736,4 420.956,7 Quarry 11 42.064,1 157.894,7 Quarry 12 5.055,8 39.295,9 Total 339.308,6 1.456.023,4
Some quarries were identified in both cartographic surveys (1950 and 1970). In these cases, both digital terrain models were created, but only the one where the excavations made in the quarry were deeper was considered, because it is the one that represents the reference surface with the most landfill volume. Fig. 3 shows, as an example, quarry
The last step of this project is to find out the volume of the landfill materials that filled the quarries. In order to achieve that, a simple and practical way to perform this comparison was used. The volume was calculated by the prisms representation of the relief, performing a spacing quotas matrix H (m,n) [7], which means that the volume between the surface of the relief and the reference surface (0 quota), can be represented by the sum of the prisms in the matrix (1). ) ,1 ( = V 2 1 m 1 1 E H k n k (1) where, V – Volume m – Surface relief n – Reference surface
In conclusion, the volume is the portion of landfill that is found above the reference quota and it is given by the sum of the prisms that are between the reference quota and the surface. But there is also an important factor that should be considered when the volume is analyzed, which is the compaction of the landfill materials. The greater the compaction of the materials, the higher the volume should be (2).
VGC -V VGC =
(2)
where,
VGC – Volume grounded and compacted V – Excavated volume
The VGC represents the volume of landfill materials deposited and the V means the excavated volume without any landfill material. In this project it is was impossible to determine the VGC, due to the fact that it is known that the landfill materials had heterogeneous forms and that makes it impossible to determine how compact the materials are. The comparison of the surfaces was made using ArcGIS surface difference tool. This tool provides the theoretical model that was described before (1), the tool generates the prisms model based on a surface reference that was set as input. The results of the output tool were divided into 3 parts (fig. 3 c): the surface that is above the surface reference, the surface that keeps the same shape and the surface that is below the surface reference. This means that the surface above the reference surface is in fact the one that includes the landfill materials, the surface that keeps the same shape is where no change has been detected in the comparison, and the surface that is below the reference surface means that the areas were excavated even more after the exploitation. According to this fact, only the areas where the surface is above the reference surface should be considered, and the results will be obtained by the sum of these prisms. 3. Results
As a final result of the application of this methodology, it was possible to identify twenty five areas, with 90 hectares, and representing 5% of the study area, which presents significant changes such as excavation and landfill deposits, between 1950 and 2012. Twelve of these areas (35 ha) can definitely be considered as quarries. In 1970, 27% of the area occupied by the quarries displays landfill deposits and 22% was urbanized. In 2012, all the quarries display landfill deposits and 40% of the area is urbanized. Figure 2 shows the delimited areas of these quarries in 1950, 1970 and 2012 and the changes occurred due to urbanization.
Fig. 2 – Identification of the quarries location and the changes occurred due to the urbanization.
For example, the quarries designated as 2, 3, 4 and 9, could only be found in the cartographic survey of 1950 since the exploitation of those quarries only occurs in the 50’s or before, and in 1970 they were already covered with the landfill materials. However, 17% of the quarries exploitation continued after the 50’s and remained active until the 70’s. In the cartographic data of 1950 and 1970, there are a significant number of areas where the terrain morphology displays changes by non-natural processes such as excavation and landfill deposits but it is impossible to identify it as a definite exploitation. For that reason, it justifies a possible investment by the municipal council to be sure that those areas are safe and appropriate for new constructions.
The comparison of the DTMs of the 12 quarries considered as certain, between 1950, 1970 and 2012, using GIS tools, allowed 339.308,6 mt2 of area to be identified that were classified as active quarries and 1.456.023,4 mt3 of landfill materials (table1).
Table 1. Quarries Landfill Volume.
Total Area Landfill volume
Mt2 V= Mt3 Quarry 1 46.081,5 187.424,3 Quarry 2 53.488,8 214.557,2 Quarry 3 10.043,3 36.885 Quarry 4 69.688,2 157.196,5 Quarry 5 1.661,3 8.976 Quarry 6 6.489,2 63.238,2 Quarry 7 18.982,4 71.770,3 Quarry 8 7.275,5 49.981 Quarry 9 24.742,2 47.847,6 Quarry 10 56.736,4 420.956,7 Quarry 11 42.064,1 157.894,7 Quarry 12 5.055,8 39.295,9 Total 339.308,6 1.456.023,4
Some quarries were identified in both cartographic surveys (1950 and 1970). In these cases, both digital terrain models were created, but only the one where the excavations made in the quarry were deeper was considered, because it is the one that represents the reference surface with the most landfill volume. Fig. 3 shows, as an example, quarry
9, where it is possible to see the surface area of 2012 that is above the surface reference (1950), the surface area that keeps the same altimetric value and the surface area in 2012 that is below the surface reference.
Fig. 3 – a) 3D model of one of the quarries in 1950; b) 3D model of the urbanized area in 2012 overlapped with planimetric data; c) Surface difference
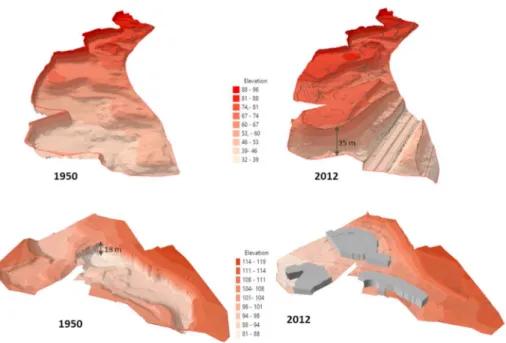
But, there are some other analyses that were possible to be obtained with the cartographic data and the 3D model created such as the identification of constructions, buildings and roads, that were built on some unstable areas (fig 3, fig. 4, fig 5), increasing the risks of hazards.
Fig. 4 – 3D Model of the quarry 1
Fig. 5 – 3D Model of the quarry 10 and 11 4. Conclusions
The knowledge of the location of the old quarries and the volume of landfill materials, allows the Town Hall to create some constraints in land use in their Master Plan to reduce cost increases and the risk of hazards. As it was possible to identify during the project, there are already some constructions inside the quarries and even in the surroundings that should be marked by the civil protection because there is already a risk of collapse. However, the main goal of this project consists of giving the authorities some tools for their Master Plan that could prevent the massive urban expansion for those specific areas.
Through urban plans, some of these areas can be converted as recreational and leisure spaces aiming to achieve sustainable management and planning policies with a mitigation perspective.
Acknowledgements
Support for this project was provided by the by the Fundação para a Ciência e a Tecnologia (FCT) under the project grant UID/MULTI/00308/2013.
References
[1] M. J. Pinto, Levantamento cartográfico de locais de pedreiras no concelho de Lisboa. 5º volume da Coleção de Estudos Urbanos – Lisboa XXI. Câmara Municipal de Lisboa, (2005) p.159.
[2] P. Dias, M. Vasconcelos, P. Redweik, F. Marques, Using remote sensing techniques for mapping landfills and excavations in urban areas: a study in Lisbon. 14º Congresso Nacional de Geotecnia, Covilha, 2014.
[3] B.G. Fasani,. F., Bozzano, M. Cercato,. The underground cavity network of southeastern Rome (Italy): an evolutionary geological model oriented to hazard assessment. Bull. Eng. Geol. Environ. 70 (2011) 533–542.
[4] R. Pellicani, G. Spilotro, F. Gutiérrez, Susceptibility mapping of instability related to shallow mining cavities in a built-up environment. Engineering Geology 217 (2017) 81–88.
[5] I. Almeida, Características Geotécnicas dos Solos de Lisboa. Ph.D. Dissertation presented to the Lisbon University. (1991) p. 485.
[6] A. B. Ferreira, Formas do Relevo e Dinâmica Geomorfológica, in C.A. Medeiros, Geografia de Portugal: o Ambiente Físico (vol. 1). Círculo de Leitores. (2005) p. 495
9, where it is possible to see the surface area of 2012 that is above the surface reference (1950), the surface area that keeps the same altimetric value and the surface area in 2012 that is below the surface reference.
Fig. 3 – a) 3D model of one of the quarries in 1950; b) 3D model of the urbanized area in 2012 overlapped with planimetric data; c) Surface difference
But, there are some other analyses that were possible to be obtained with the cartographic data and the 3D model created such as the identification of constructions, buildings and roads, that were built on some unstable areas (fig 3, fig. 4, fig 5), increasing the risks of hazards.
Fig. 4 – 3D Model of the quarry 1
Fig. 5 – 3D Model of the quarry 10 and 11 4. Conclusions
The knowledge of the location of the old quarries and the volume of landfill materials, allows the Town Hall to create some constraints in land use in their Master Plan to reduce cost increases and the risk of hazards. As it was possible to identify during the project, there are already some constructions inside the quarries and even in the surroundings that should be marked by the civil protection because there is already a risk of collapse. However, the main goal of this project consists of giving the authorities some tools for their Master Plan that could prevent the massive urban expansion for those specific areas.
Through urban plans, some of these areas can be converted as recreational and leisure spaces aiming to achieve sustainable management and planning policies with a mitigation perspective.
Acknowledgements
Support for this project was provided by the by the Fundação para a Ciência e a Tecnologia (FCT) under the project grant UID/MULTI/00308/2013.
References
[1] M. J. Pinto, Levantamento cartográfico de locais de pedreiras no concelho de Lisboa. 5º volume da Coleção de Estudos Urbanos – Lisboa XXI. Câmara Municipal de Lisboa, (2005) p.159.
[2] P. Dias, M. Vasconcelos, P. Redweik, F. Marques, Using remote sensing techniques for mapping landfills and excavations in urban areas: a study in Lisbon. 14º Congresso Nacional de Geotecnia, Covilha, 2014.
[3] B.G. Fasani,. F., Bozzano, M. Cercato,. The underground cavity network of southeastern Rome (Italy): an evolutionary geological model oriented to hazard assessment. Bull. Eng. Geol. Environ. 70 (2011) 533–542.
[4] R. Pellicani, G. Spilotro, F. Gutiérrez, Susceptibility mapping of instability related to shallow mining cavities in a built-up environment. Engineering Geology 217 (2017) 81–88.
[5] I. Almeida, Características Geotécnicas dos Solos de Lisboa. Ph.D. Dissertation presented to the Lisbon University. (1991) p. 485.
[6] A. B. Ferreira, Formas do Relevo e Dinâmica Geomorfológica, in C.A. Medeiros, Geografia de Portugal: o Ambiente Físico (vol. 1). Círculo de Leitores. (2005) p. 495