Surveys &
Assessments: Landscape
4.A HOW URBANIZATION AND INDUSTRIES INFLUENCE WATER QUALITY
Quantification of pollution is necessary for evalu-ation of environment quality and elaborevalu-ation of a successful strategy for water quality improvement. Reduction of threats resulting from pollution is always the first step to implement ecological me-asures in IWM.
The objective of this chapter is to:
introduce possible treats resulting from the impacts of urbanization, industrialization and agriculture;
give a review of the assessment procedures for point and non-point pollution and iden-tification of „hotspots” in a catchment.
IMPACT OF URBANIZATION, INDUSTRIALIZATION AND AGRICULTURE ON WATER RESOURCES
pal and industrial uses of water, and contribute to the decline of water resources quality. This may result in the limitation of water resource use by people living downstream, as well as very often degradation of the whole basin-river-reservoir sys-tem occurs. Box 4.1 presents an overview of the key sources of pollution impacting fresh waters. In the next decades, water shortages resulting from
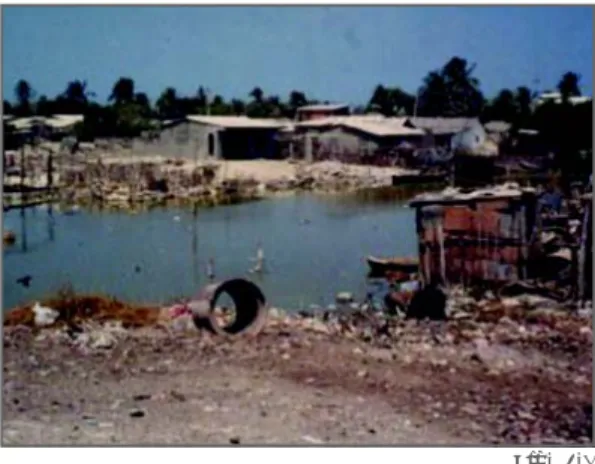
both a lowering of water quantity and quality will be the most urgent problem for 80% of the world’s population. Development of agriculture, industry and urbanization will result in increasing water use, generate more pollutants from both
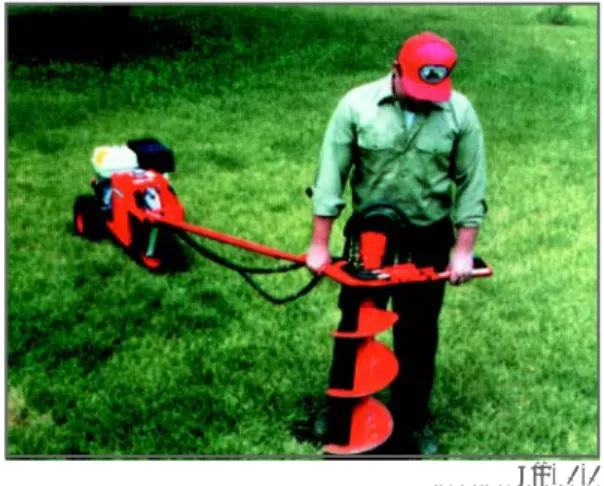
munici-Fig. 4.1 Urban sprawl often creates poverty belts that heavily impinge on water quality (photo: V. Santiago-Fandino)
Surveys &
IDENTIFICATION OF POTENTIAL IMPACTS ON FRESHWATER QUALITY
The first step in the assessment of human impacts on freshwater resources requires identification and quantification of the impacts of major past, ongo-ing and planned projects (activities) in a catch-ment. This allows for the recognition of potential pollutants in the basin.
Table 4.1 helps to check the potential risks in a catchment. The following three steps are propo-sed to
optimize the evaluation procedure for pollution risk assessment at a catchment scale:
screening – identification of hot spots (map-study & questionnaires);
direct assessment of impacts (field study); and quantification of problems (laboratory as-sessment and timing of monitoring).
SCREENING
The screening for identification of „hot spots” can be done based on map information, statistical analysis and the use of a questionnaire.
What are the main objectives of screening? analysis of the distribution of activities that affect water quantity and quality at the catchment scale;
identification of potential pressures; identification of „hot spots” and elaboration of guidelines for further assessment; and integration of the information at the catch-ment level.
What issues should be identified?
water demand by agriculture, municipal and industrial users:
daily uptake (m3 day-1) can be
estima-ted using information from the water sup-ply system or surface/groundwater usage; if there is no water supply system -water demand should be calculated by mul-tiplying the number of people and animals by average consumption values;
Potential impacts on water quality: information about sewage outflow and sewage treatment in a catchment should be collected;
if there is no quantitative data, it can be assumed that sewage outflow equals water use in a catchment,
collect information about local industries, including planned and implemented pro-jects and estimate their impact (Table 4.1); collect information about large farms and aquaculture farms;
Surveys &
calculate the number of cows, sheep and pigs per 100 ha of agriculture land and identify regions with high impermeable areas, especially in urbanized regions. Make aggregations of your information and mark „hotspots” on maps of 1:50 000 or 1:100 000 resolution for catchments smaller then 100 km2, and 1:500 000 for
catchments greater than 100 km2.
DIRECT ASSESSMENT OF IMPACT
After identification of „hotspots” the assessment should be continued in the field according to the following steps:
establishing monitoring stations:
for point source pollution set at least three stations, located at:
- outflow of sewage;
- 100-1000 m upstream of the inflow; and - 100-1000 m downstream depending on
river width. for diffuse pollution:
- at least two stations should be chosen based on a land-use map and for river sections of between 10 to 50 km. as a first step, conduct simple field measurements at the identified stations at times of low and high discharge and taking into account the timing of sewage discharge:
physical measurements such as: temperature, O2 concentration, pH, conductivity, salinity;
preliminary chemical measurements should be considered;
use of bioassessment methods that will give an indication of the possible toxic effect of the sewage inflow (for more information - see chapter 7.D);
use biomonitoring methods (e.g., macroin-vertebrates, macrophytes, fish) to check the effect of sewage inflow on a river eco system (for more information - see chapter 6.A);
compare the data for upstream and downstream stations. If differences are greater than 20% in the measured values,
contacting a professional laboratory to focus on the problem should be considered.
The timing of monitoring is important, especially if you have information about illegal sewage in-flows and stormwater pollutants (dilution effects alter very high concentrations of pollutants). QUANTIFICATION OF THE PROBLEM
The preliminary issues identified during the direct assessment of impacts should be further specified by chemical analysis made in a professional laboratory. Water samples for laboratory study (1-5 litres) should be collected at each study station.
the water should be taken from the main course of a river. If the river is more then 10 m wide, an integrated sample should be collected by mixing equal volumes of water from every 10-20 m of the cross section; transport the samples to the laboratory or use field equipment to make analyses standardize the system; and
the basic parameters that should be determined include: BOD5, Total Suspended Solids (TSS), Organic Suspended Mater (OSM), Coliform index, NH4-N, NO2-N, NO3-N, N tot, PO4-P, P tot, TOC;
To quantify the impact of pollution on water qu-ality, compare the obtained data with data from non-impacted (reference) sites. The data can be compared to regional standards for water quality.
To have a complete picture for formulating a management strategy and identification of „hot spots” in the catchment, aggregation of all the above information can be made by using one of the following systems:
GIS (see chapter 4.B);
hydrochemical profiles of a river; and use of water quality indexes.
Surveys &
A landscape is the framework for all biogeochemi-cal and ecologibiogeochemi-cal processes. Its structure defines the rate of water and chemical exchanges betwe-en land and water ecosystems in catchmbetwe-ents and species biodiversity. All these factors determine the self-regulating potential of ecosystems and their resilience to human impacts. This chapter presents basic methods of landscape assessment using aerial photography and remote-ly sensed imagery in conjunction with GIS techno-logy for estimating the rate, direction, and possi-ble impact of landscape changes on natural reso-urces, such as water and biodiversity.
HOW ARE LANDSCAPES ASSESSED?
From the point of view of protection and manage-ment of natural resources it is important to iden-tify and quaniden-tify the following landscape structures (Table 4.4):
4.B. HOW TO ASSESS LANDSCAPE IMPACTS ON WATER QUALITY
One of the most efficient methods for identifica-tion of these areas, and therefore estimaidentifica-tion of their role in water and nutrient circulation, is te-ledetection, a method based on recording, visu-alization and analysis of electromagnetic radia-tion. Teledetection incorporates classic aerial pho-tography, based on visible light, and recording and visualization of other parts of the electromagne-tic spectrum. The type of electromagneelectromagne-tic radia-tion used for analysis of landscape structures in-fluences the type of information gained and, there-fore, one’s ability to interpret data - photointerpre-tation (Table 4.5).
HOW ARE LANDSCAPE STRUCTURES IDENTIFIED ON AERIAL PHOTOGRAPHS?
Aerial photography provides large amounts of in-formation about the area of interest including: physical profile, freshwater distribution and its quantity and quality, distribution and biomass of vegetation and characteristics of human impacts. There are, however, two points, that must be emphasized:
to find and properly interpret the informa-tion, direct observations in the landscape have to be carried out; and
knowledge about an area has to be obta-ined and a clear goal of the survey has to be set prior to the analysis of photographs.
Surveys &
Assessments: Landscape
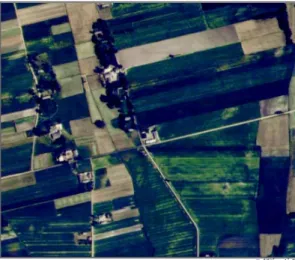
Fig. 4.2 The Lubrzanka River Catchment in the Swietokrzyskie Mountains of Poland (photo: Department of Applied Ecology)
Topographic profile
The best source of information about the physical profile of the land is a stereoscopic picture. Ana-lysis of such pictures is possible only with a ste-reoscope. With some experience you may also try to identify some landscape structures on common photographs. Some of the forms will be easily ana-lyzed and quantified on large-scale pictures [1:50 000], while some require use of smaller scales, like 1:10 000. In some cases, guides for identifing landscape forms maybe useful.
Forests, woodlands, bushes
Identification of woodlands is possible as they dif-fer from the background by their colour and gra-iny structure. Species identification may be con-ducted on the basis of the separation of single trees and their shadows.
In temperate climates, forests are composed of coniferous and deciduous species. On a photograph the difference between the groups is sometimes visible as differences in colour bri-ghtness - coniferous forests are darker and the size of the grains, reflecting the heads of trees, for conifers are smaller (Box 4.2).
Surveys &
Also helpful in woodland identification is species phenology. In early spring deciduous trees are le-afless. That allows not only for easy differentia-tion of forests, but makes analysis of the land struc-ture easier. Identification of deciduous and coni-ferous trees is also easy with photos taken in au-tumn. For the purposes of forest identifica-tion, the most useful are pictures at a medium scale of up to 1:20 000.
Meadows
They are recognizable as dark-gray or dark-green areas sometimes having a cloudy texture. After grass harvesting a picture may be different with very strong visible strips, the effect of using ha-rvesting equipment (Box 4.3).
Arable land
On aerial photos arable land is clear and brighter in colour, especially during summer months, and is characterized by a specific texture reflecting equipment use. Unfortunately, crop analysis is one of the biggest challenges in photointerpretation. It requires very detailed study of the brightness indicator of different crops on photos taken at particular times of the year.
Urban areas
Aerial photography is one of the most valuable sources of information about human settlement. In the case of villages, the most important
pro-perties are: shape, number of farms, building den-sity or, for long-term documentation, also the rate of development as a result of interactions betwe-en a settlembetwe-ent and surrounding betwe-environmbetwe-ent. In the case of towns these interactions are expres-sed by the arrangement of streets. History and functions of the city may be deduced from the distribution of buildings of different sizes and uses. IMPORTANT PARAMETERS - QUANTIFICATION OF INFORMATION
How is the area of objects measured?
The area of objects may be measured directly on the picture if the topographic profile of the land is not very diversified. This is possible using a pla-nimeter, but first the scale of the picture has to be calculated (Box 4.4). Because there are pictu-re deformations, incpictu-reasing from the centpictu-re to the edge, the most accurate estimations may be con-ducted only for objects situated in the centre. How do you measure lengths?
On pictures of areas showing small elevation dif-ferences (up to 100 m) lengths may be measured directly with a ruler. If the lines are curved, the easiest way is to divide them into straight sec-tions and to measure each separately. An alterna-tive method is to use a curvometer. Very small objects require application of a Brinell magnify-ing glass or Brinell microscope.
Surveys &
How is patchiness estimated?
Patchiness is related to the average patch size (APS) in a chosen fragment of landscape:
where Sf = area of the landscape fragment and n = number of patches.
To calculate the temporal changes of patchiness we need only to modify the equation:
In this case n is the number of patches located on area, Sf, or patches with particular characteristics like woods, meadows, etc (Chmielewski, 2001). How is ecotone density estimated?
Ecotone density is simply calculated as:
where: D = ecotone density, L = ecotone length and S = analyzed area.
Then the long-term change in density of transitio-nal zones is calculated as:
where ∆D = indicator of density change in transi-tional zones [%], L1 = initial length of the transi-tional zones, L2 = final length of transitional
zo-nes, and S = area of analyzed land (Chmielewski, 2001).
Surveys &
Assessments: Landscape
What are the sources of data error?
Measurements based on photographs are not al-ways accurate. There are the number of factors that are prone to error, which, if necessary, sho-uld be corrected mathematically.
The most important sources of inaccuracy are related to:
photo slope (can be ignored if less than 3o);
large elevation differences;
lack of precision in identification of object borders;
area deformation caused by cameras; and scale of the picture.
IDENTIFICATION OF ENVIRONMENTAL THREATS At the landscape level there are several signs of loss of ecosystem resilience, which should be con-sidered during analysis of photographs (Box 4.5). All of them are related to the potential for water and matter storage by landscape structures. Regulation of rivers
Changes in riverbed shape, appearance of embank-ments and, what is even more spectacular, decli-ne or disappearance of land-water plant buffe-ring zones, indicate loss of connectedness betwe-en a river and its valley. It leads to high hydrologi-cal variability, decline of water levels and dischar-ges, water shortages in agricultural areas, incre-ases of chemicals leaking into surface and ground waters, and, finally, a decline of biodiversity. APS=Sfn ∆∆∆∆∆APS=Sf Sfn 1 n2 D=SL 100( ) ∆∆∆∆∆D= L1 L2 S S L2 S
Erosion
Areas undergoing erosion are identified as lighter patches situated along a river corridor. The indi-cator of bottom erosion is a deepening of the ri-ver valley and a tendency of the riri-ver to occupy its whole width.
Erosion may be natural, resulting from the geolo-gical and morphologeolo-gical structure of the catch-ment (e.g., loess areas) or human-induced. In the latter case, it usually reflects degradation of the vegetation cover and inappropriate distribution of different use areas. The cause of erosion may be located far from the place where it is observed. Urbanization
The increase of the percentage of urban areas compared to natural and semi-natural areas is an indicator of possible water and environmental quality deterioration.
Analysis of the rate and direction of expansion of urban areas may provide additional information about potential threats to the environment and the necessary management counteractions. Fragmentation
It is well known that medium land patchiness is the optimal one for sustainable landscape mana-gement.
Landscapes characterized by large, homogenous areas are a source of non-source pollution, ero-sion and, hence, water siltation. From a biologi-cal point of view, they also encourage the spread of diseases and biodiversity loss.
High patchiness of the landscape, especially when resulting from increased density of anthropogenic ecotones, disturbs chemical and water circulations in a catchment. It also does not provide stable conditions and space required by organisms for completing their life cycles.
APPLICATION OF GIS TECHNIQUES
Geographical Information System (GIS) is a pro-gram which has the capability of storing and ana-lyzing digital maps and remote sensing images using different software components (Box 4.6).
GIS may operate easily at the single ecotone scale up to the largest catchment scale. It is used for:
visualization and communication (distribution, properties, spatial relations between objects); to measure and inventory (e.g., how much of a resource is present); and
analysis, prediction, modelling and decision making.
How does a GIS system operate?
Every natural phenomenon has a spatial and tem-poral dimension, which means it occurs at a given location and at a particular time. Natural objects (entities) are represented in GIS by:
loation (typically expressed as: x-y, or eastings-northings, or latitude-longitude coordinates); and
attributes (type of observation, counts, measured value, time, etc).
The location of an object is defined within a coor-dinate system, e.g., the Cartesian one (coordina-tes x, y - for a flat surface on map) and the latitu-de-longitude system (coordinates x,y - for the
glo-Surveys &
be and in GPS (satellite positioning systems). Data described in orthogonal cartographic coordinates make it possible to perform cartometric calcula-tions of object length, area or volume. Attribute data can be a name, number, class value or quali-tative description (verbal, pictorial or numerical). Geometric representation of an object in a given coordinate system is a point, line, or surface.
Point does not have a topological dimension, but in GIS programs it can be displayed as a symbol (for example, sampling point, source of pollution).
Line is a sequence of points (segment), in which we may distinguish start and end po ints and nodes at an intersection of lines. Lines can be additionally described by code. For instance, elevation of a contour line. Li-nes may be used to represent linear featu-res like streams, roads, and boundaries. Surface represents two-dimensional objects (lake, forest). Three-dimensional objects are re-presented as a surface, which have an elevation attribute (for instance, a digital terrain model). Data visualization - analysis
In computer graphics there are two data models to represent the geometry of objects - vector and raster.
Lines written in vector format may be used to represent networks (for example, river system), connected lines may enclose poly-gons or areas that are homogenous, e.g., land unit;
A raster is a regular matrix of elementary cells or pixels. The location of each pixel is determined by the size of the grid and the pixel size or resolution. Each pixel stores the attribute data for that particular location. Many GIS programs use both types of data formats. Both raster and vector layers should be registered in the same coordinate system. During registration a relaregistrationship between raster coordinates (i row, j column) and cartographic coordinates (x
-Surveys &
Assessments: Landscape
eastings, y - northings) are calculated. In hybrid graphics it is possible to perform conversions be-tween data types called vectorization or rasteri-zation.
The most common method of representing the complex nature of the real environment in com-puters is to use thematic layers.
Mathematical operations used for data processing can be performed on one or many thematic lay-ers, including a third dimension written in a DTM. Spatial data analysis can include processing of object attributes and/or object geometry. Arith-metic operators (+, -, *, /, ^, sqr) are used in car-tometric calculations (distance, area, volume, di-rection) and in processing object attributes. Rela-tional operators (=, <, >, =<, >=, <>) are used for processing attributes and are useful for selecting certain objects according to given criteria. Logi-cal operators (OR, AND, NOT, NOR) are used for finding objects belonging to many thematic layers according to specified conditions. Statistical ope-rators are concerned mainly with attribute valu-es. They are used to calculate, histograms, va-riance, distribution and attribute value correla-tions. More advanced methods are cluster analy-sis, semivariogram, and econometric functions. In addition to simple operators we may perform more complicated analyses like map overlays (cros-sing) and proximity analysis (buffer zones, network functions). GIS is also a good environment for data preparation for external mathematical models and visualization of the modelling results.
DATA INTERPRETATION FOR ESTIMATION OF LANDSCAPE SENSITIVITY
The capacity of the landscape to absorb anthro-pogenic pressures may differ due to geomorpho-logy, precipitation pattern, structure of plant co-ver, land use and its intensity, number of inhabi-tants, etc.
Although there is no precise recipe for optimal land use, one can easily identify symptoms of dec-lining landscape resistance:
land fragmentation;
rapid development of urban areas; increased erosion;
water siltation;
decrease of forested areas, shrubs, tree lines; and
degradation of land/water plant buffering zones and wetlands.
MAKE SURE TO CHECK THESE RESOURCES:
Surveys &
Assessments: Landscape
Identification of these processes and their quanti-fication, together with more detailed studies inc-luding analyses of water chemistry and biota, may allow for the elaboration of effective landscape management strategies based on phytotechnolo-gical and ecohydrolophytotechnolo-gical approaches.
Guidelines: chapters 3.A-3.G, 4.A-4.E, 4.G
http://www.eman-rese.ca/eman/ecotools/protocols/terrestrial/vegetation/glossary.html http://www.thewaterpage.com/aq_eco_july_01.htm
http://rst.gsfc.nasa.gov/Front/tofc.html
Polluted soils are a widespread issue and are pro-blematic in terms of remediation. This is particu-larly true in the case of persistent pollutants (e.g., heavy metals and radionuclides), which are not amenable to natural attenuation. Soil remedia-tion is expensive and often results in an alternati-ve set of environmental considerations. As with all remediation efforts, a comprehensive under-standing of the soil and the contamination are cri-tical.
This chapter outlines major considerations in the design and implementation of a characterization program for contaminated land.
WHY SHOULD WE ANALYZE SOIL CONTAMINATION?
Soil pollution has to be analyzed in a broad con-text due to the potential for interactions among soil, ground water, surface water and air. Conta-minated soil can affect all of these media, and through them, humans as well as other living or-ganisms. The effects of soil pollution can be obse-rved far away from the source, even hundreds of years after the polluting activities have ceased (Alloway, 1995).
LAND SENSITIVITY
Approaches to the assessment of land contamination differ, depending on the present or anticipated future land use. Fundamental questions include how the site will be used, who will use it and, „how clean is clean”. The key issue is known as „land sensitivity”, which is used to determine the maximum tolerable contami-nation levels when the land is used for a particular purpose. While overly simplified, the following land segregation categories may be used to illustrate this concept: (Box 4.7)
STANDARDS
Permissible legal values for acceptable soil conta-mination vary from country to country. In many cases, countries allow site-specific flexibility in the development of clean-up standards. In Po-land, where standards are based on the Dutch and German approaches, three categories of land use are recognized with associated sets of standards: (Box 4.8)
4.C. HOW TO ASSESS SOIL CONTAMINATION
Surveys &
Assessments: Landscape
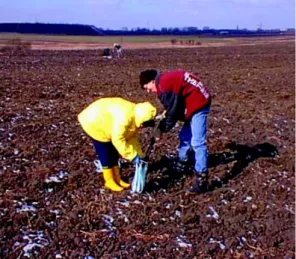
Fig. 4.3 Collecting of soil samples (photo: R. Kucharski)
Examples of permissible concentrations in Poland are shown in Table 4.6. Benchmark values are de-veloped from basic toxicological literature. From these permissible concentration values are calculated using risk assessment methods. The same approach is used when planning soil clean-up activities. Remedial activities are preceded by a baseline risk assessment that is compared to stan-dards applicable to the anticipated site use. Tar-get clean-up values then are developed that wo-uld be safe for a theoretical population using the remediated area under the assumed conditions. This procedure is carried out routinely to evalu-ate the need for, and extent of, remediation (US EPA, 1989).
THREATS TO THE ENVIRONMENT
In many cases, the most vulnerable segment of the population is young children, whose direct and in-direct exposure to contaminated soil is magnified by their physically active lifestyle and various expo-sure-increasing habits (e.g., licking dirty hands and toys (Roper, 1991). Exposure scenarios that consider childhood exposure are often the major factors in de-termining site remediation needs.
Agricultural land pollution plays a crucial role in the exposure of local populations to heavy me-tals. The consumption of contaminated agricul-tural products can be a significant source of con-taminant exposure. Humans take up most metals through the digestive tract after ingesting contamina-ted foodstuffs, especially vegetables. The major sour-ce of heavy metal contamination to plants comes from soil pollution (Kucharski et al., 1994).
Surveys &
Another important exposure scenario involves site excavation, either for routine activities or for re-medial purposes. Such a scenario envisions wor-kers in direct contact with subsurface soils. BIOAVAILABILITY OF POLLUTANTS CONTAINED IN SOILS
Contaminants can exist in soils in a variety of che-mical forms. These forms have varying uptake ra-tes by living organisms (bioavailability). Bioava-ilability describes the ability of a specific chemi-cal form to cross biologichemi-cal membranes (i.e., ac-tually enter an organism). For example, very lit-tle of the metallic form of mercury is taken up following ingestion, while organic forms of mer-cury readily cross gastrointestinal membranes. Bioavailability of soil contaminants influences the risk posed to living beings and, thus, the need for, and extent of, remediation required to insure the safety of exposed populations. In soils, bioavaila-bility is influenced by physical, chemical and bio-logical factors (including root, bacterial and fun-gal activities), as well as mechanisms of absorp-tion into plants or animals (Brümmer et. al., 1986). Sequential chemical soil analysis is used to descri-be the speciation or bioavailability of metals. Ho-wever, most legal regulations address only total concentrations of contaminants and do not take into consideration chemical speciation. However, this information can be used to evaluate the po-tential for adverse impacts from soil contamina-tion on the food chain (Tessier et. al., 1979). HOW IS SOIL CONTAMINATION ASSESSED? What is the goal of site characterization? The goal of site characterization is the develop-ment of a conceptual site model that will be used to determine the need for, develop and guide, site remediation. The data generated from the che-mical analysis of soil samples is further processed using statistical and visualization (e.g., GIS) pro-cesses.
Careful planning and implementation of site cha-racterization is vital to the effective clean-up of a contaminated site. The initial involvement of all members of the remedial team (e.g., field per-sonnel, soil scientists, chemists, statisticians and
toxicologists) when planning site characterization activities will streamline the process, reduce the need for additional characterization efforts and result in more effective remediation.
How to collect representative samples
A sampling grid typically is used to determine the spatial variation of contaminants at a site. The sampling scheme needs to determine the extent (in both area and depth) and spatial variability of contaminants at the site, initially and during re-medial activities. The number and location of sam-ples will be site specific. Soil sampling patterns depend on a number of factors including site hi-story, expected data needs and planned remedial strategy. There are a number of possible patterns for site characterization, e.g., circular grid, ran-dom, stratified, zigzag, transverse sampling and systematic (Box 4.9, ISO/CD/10381-5). For initial characterization of soil contamination (i.e., scre-ening), samples are obtained using a sampling grid. An example of a field data sheet is shown in Ap-pendix 1. which facilitates the systematic sam-pling and handling of samples (US EPA, 1989a) How deep should we sample?
The depth of samples is important to consider and should be based, in part, on the history of the site. It is important to remember the old adage that „one will not find that which is not sought”. Initial soil sampling often screens samples from several depth ranges (e.g., 0-15, 15-30, 30-45 cm). The top 30 centimeters of soil generally is consi-dered when evaluating the threat posed to living organisms by contaminated soil (see chapter 9A). In some cases, e.g., construction purposes, where deeper layers of the ground will be exposed, a different and more extensive set of considerations will need to be applied.
Once the depth of contamination is known, fur-ther sampling can be concentrated in that depth range. Soil samples should be collected using equ-ipment that is compatible with the physical and chemical needs of the sampling plan (e.g., distur-bed vs. undisturdistur-bed, spot vs. composite samples). Plastic samplers or tubes generally are used for samples intended for metal analysis, while metal
Surveys &
samplers generally are used for samples intended for organic analysis. The most commonly used equipment for collection of spot samples is a split tube soil sampler (ISO/CD 10381). Contaminant presence is quantified using routine laboratory methods (ISO/DIS 11464).
What parameters should be determined in a soil sample?
Soil is a complex media and a number of variables exist which may influence the fate of anthropoge-nic substances introduced as contaminants.
Some basic factors can be isolated which are cru-cial to soil susceptibility. Basic soil parameters can be grouped into four groups (Korcz et al., 2002):
mass transport characteristic (soil texture, unsaturated hydraulic conductivity, disper-sivity, moisture content/tension, bulk den-sity, permeability, infiltration rate, soil lay-ering);
soil reaction characteristics that describe soil-contaminant reactions (soil-water parti-tion coefficient, caparti-tion exchange capacity, acidity, redox, soil biota, soil nutrients, con-taminant abiotic/biotic degradation rates, soil mineralogy);
contaminant properties - solubility in water, dielectric constant, diffusion coefficient, or ganic carbon partition coefficient, soil/wa-ter partition coefficient, Henry’s constant, molecular weight, vapour pressure, density, chemistry of water extracts; and
soil engineering characteristics and proper-ties (erodibility, depth to ground water, thickness of unsaturated and saturated zo-nes, depth and volume of contaminated soil, bearing capacity).
Surveys &
Assessments: Landscape
Fig. 4.4 Mechanical auger Forestry Suppliers, Inc. Catalog 51, 2000-2001
To obtain basic information on soil properties, the following analyses are routinely made:
soil type, texture; conductivity; pH;
content of organic matter;
concentration of pollutants in question; fertility (vegetative capability); depth to ground water;
surface runoff; and permeability.
Surveys &
Assessments: Landscape
Photo 4.5 Various types of soil sampling equipment Forestry Suppliers, Inc. Catalog 51, 2000-2001
MAKE SURE TO CHECK THESE RESOURCES: Guidelines: chapter 5.B
Groundwater, especially in catchments with inten-sive agriculture and grazing, may transport a con-siderable amount of dissolved pollution to fresh waters. During the growing period, pollution can be effectively diminished by application of phyto-technological methods. However, their application requires preliminary studies. The objective of this chapter is to introduce methods for analyzing gro-undwater movement and chemical composition in order to define the risk related to the transporta-tion of contaminants from a catchment to lakes, rivers and reservoirs.
WHAT IS GROUND WATER?
The term ground water describes water present in the saturation zone that is separated from the earth’s surface by a permeable zone of aeration. Ground water is delimited from belowby an im-permeable basement (impervious layer), from above by a free water table and aeration zone (Box 5.1).
5.A. CAN GROUND WATER INFLUENCE SURFACE WATER QUALITY?
groundwater supplied by streams, or influ-ent streams (Box 5.2).
Identification of the stream character can be done using hydroisochip diagrams:
ground water drained by a riverwhen the groundwater table falls towards a stream and infiltrating stream, when the underground water table reaches the highest level near a stream bank and falls towards a valley. The characteristics of interaction between a stre-am and underground water can change both spa-tially and temporarily: the stream can be an ef-fluent and change into an inef-fluent or vice versa.
Surveys &
Assessments: Land-W
ater Interactions
A groundwater table usually has a slope called the hydraulic gradient.
Ground water is susceptible to changes of tempe-rature (up to 20 m below the ground surface), water table level fluctuations and chemical com-position. Precipitation influences the groundwa-ter level, but the deeper below ground level the water table is, the more delayed are its changes. Ground waters are interconnected with surface waters in two ways:
streams supplied by ground water, or efflu-ent streams; and
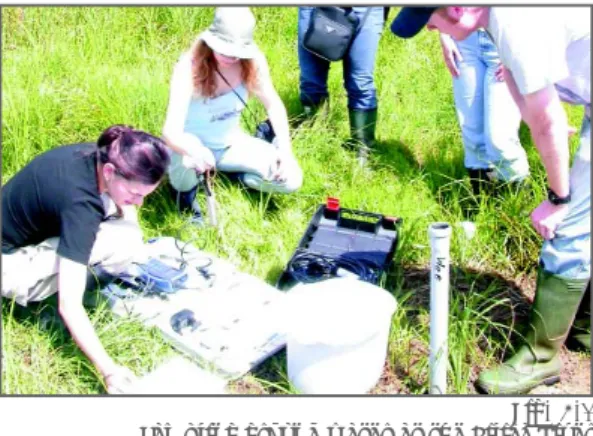
Fig. 5.1 Sampling ground water at the Pilica River - an ecohydrology and phytotechnology Demonstration Site in Poland (photo: I. Wagner-Lotkowska)
GROUNDWATER SUPPLY SOURCES
Supply of underground water is provided by so called effective infiltration. Precipitation infiltra-tes to deeper strata (Box 5.3), but part of this water is kept in the aeration zone and used by plants.
culture, farming and settlements. Pollution can manifest itself as follows:
increased concentrations of ionscommonly appearing in groundwater, e.g., NO3-, NO2-,
PO43-, K+, Na+, Ca2+, Mg2+, Fe2+, SO 42-, Cl-;
appearance of man-made organic substan-ces (pesticides and products of their degra-dation);
increased mineral matter, conductivity, so-lid residue, and water hardness; and increased oxidation rate, BOD and bacterial contamination (see Guideline chapter 5). All pollutants while being dispersed in the ground undergo alterations. The following factors influ-ence the potential threat of pollutants:
presence and thickness of impermeable lay-ers above aquiflay-ers;
thickness and type of soil cover; depth of aquifers; and
self-purification processes of infiltrating water.
The other part of the water penetrates deeper into the saturation zone. Water supplying ground water causes its level to rise and is called effecti-ve infiltration. The volume of infiltration depends on the quantity and intensity of precipitation, soil type and its initial humidity, plant cover etc. Shor-tages of precipitation and ground with low humi-dity may result in the storage of the all rainfall in the unsaturated zone.
GROUNDWATER CHEMISTRY
Chemical composition of ground water is influen-ced by:
precipitation;
chemical composition of the soil; period of water cycling;
relief and vegetation;
land use and anthropogenic activity GROUNDWATER CONTAMINATION
Underground water is subjected to pollution con-nected with human activity, origining from
agri-Surveys &
Assessments: Land-W
tensive agriculture and farming, forestry, touristic and recreational pressures, chan-ges in water budget, etc.
Field studies and sample collection
The first step in field studies should be identifica-tion of „hot spots” in the catchment, which can potentially influence groundwater quality:
localized point sources of pollution (village, dumps, pesticides store houses, fertilizers, chemicals, cesspools, filling stations, etc.; and identification of non-point source pollution (fertilizers used in agriculture).
Data on water quality and transfer of contami-nants with groundwater movement to surface water can be obtained from piezometers. There are installed in transects located along the gra-dient of groundwater flow from a pollution source toward a stream (Box 5.4).
All piezometers in a transect should be denivela-ted in a floodplain according to the national geo-net using a tachymeter in order to obtain precise data from each piezometer (Box 5.5).
COLLECTION AND ANALYSIS OF LANDSCAPE INFORMATION
The first step, which should be done to assess pol-lutant infiltration processes from the surface into ground water supplying a stream, is collection of basic information such as:
maps: topographic, soil, hydrographic, and geological from geological and hydrological archives for:
average annual and monthly precipitation, preferably for the last 25 years;
average annual snow precipitation and duration period as well dates of the appe-arance and disappeappe-arance of the snowco-ver;
average multi-annual duration and start dates of the growing season; and
average annual and monthly run-off (in mm). statistical data (use of fertilizers, pesticides, doses and usage periods, land use structu-re):
history of land use, preferably for last 100 years;
recent land-use patterns (forests, arable lands, grasslands, urban areas, waters); and characteristics of anthropogenic activity in the catchment and its nearest vicinity: industrial plants, rail routes and roads, in
Surveys &
Assessments: Land-W
Surveys &
Assessments: Land-W
ater Interactions
Simultaneously with drilling holes for inserting pie-zometers, samples should be taken for determi-nation of soil granular composition. This informa-tion is used to determine the filtrainforma-tion coefficient (k) using, e.g., the USB method. On the basis of these results, the hydrogeological section pattern for a given transect can be created. (Box 5.6). Groundwater Measurements
Grounwater level can be measured with various methods. The most frequently used and simplest tool to determine groundwater levels is a measu-ring tape that is inserted into a piezometer. Sampling
To obtain water samples from a piezometer, pumps and samplers are used. The following steps should be followed:
Determine groundwater level;
pump out a minimum of three volumes of the water column flowing into a piezometer; sample water for chemical analysis.
Field measurement procedures:
record water temperature - preferably by digital or liquid therometre exact to 0.1oC;
record pH with a pH-metre; and
record conductivity with a conducivity me tre;
water sampling for chemical analyses in the laboratory: store water samples in propyle-ne contaipropyle-ners.
anion samples - capacity of 250 cm3; the
container should be filled to the top wi-thout leaving a headspace;
cation samples - capacity of 60-125 cm3,
preserved with hydrochloric acid. Add 5 cm3 HCl (1:1) for each 100 cm3 of water
sample. Samples should be filtred through a membrane or glass-fibre filter.
Estimation of groundwater flow rate using the empirical method
True flow velocity can be calculated from the expression:
where:
µ - effective porosity (read from a table)
U= V
µµµµµ
[ms
-1]
MAKE SURE TO CHECK THESE RESOURCES: v - apparent velocity calculated using the expres-sion:
where:
k - filtration coefficient [m d-1],
i - hydraulic gradient [m], calculated using the expression:
where:
∆h - difference between grounwater table levels of two piezometers [m],
l - distance between the piezometers. (Box 5.7)
Sampling frequency
Water samples should be taken twice a week or monthly.
Surveys &
Assessments: Land-W
ater Interactions
V=ki
INTERPRETATION AND VERIFICATION OF RESULTS Data analysis starts by gathering information from the different measurements, tabulating it and then preparing graphs and diagrams using appropriate software (e.g., Excel, Statistica, Grafer, Corel). Results of landscape studies are presented in the form of maps using GIS: Arc Info, Arc View, Map Info or other types of software (Box 5.8). Prediction scenarios of groundwater quality chan-ges and analysis and timing of pollutant flows from ground water to surface water can be estimated on the basis of mathematical modelling using mo-dels of pollutant transport, e.g., FLOTRANS, MOT-FLOW, MT3D, etc.
Guidelines: chapters 1.E, 3.A-3.G, 9.A-9.C www.scisoftware.com
www.goldensoftware.com
i=
∆
∆
∆
∆
∆
l
h
5.B. HOW TO ASSESS THE EFFICIENCY OF ECOTONES IN NUTRIENT
REMOVAL
Ecotone zone is the transition between two
dif-ferent ecosystems. From the point of view of wa-ter protection and restoration of freshwawa-ter eco-systems, a special role is attributed to land /wa-ter ecotones (riparian zones). They regulate the exchange and spreading rates of chemical compo-unds between terrestrial and water systems ther-fore they are buffers or filters in landscapes.The objective of this chapter is to introduce some ba-sic information related to estimation of the role of ecotones in regulation of nutrient retention in a land-water transitional zone.
NUTRIENT MOVEMENT
Depending on the dominant type of land use, nu-trients move from terrestrial ecosystems into gro-und and surface waters at different levels. The most important nutrient sources are cereal monocultures, although arable lands in general should be considered as a cause of water eutro-phication (Table 5.1).
The role of intense land use and increasing fertili-zer application in worsening water quality is exag-gerated by the loss of buffering zones, especially riparian ecotones that have been transformed into pastures or arable lands.
WHAT IS THE ROLE OF ECOTONES?
There are many different types of riparian ecoto-nes: swamp forests, bank vegetation, meadows, littoral zones, marshes, floating mats, oxbow la-kes, etc. Their common feature is occasional flo-oding. The water regime modifies the rates of
aerobic and anaerobic biochemical processes and hence seasonal releases and removal of phospho-rus and nitrogen.
Although the role of riparian vegetation is prono-unced in regulating biochemical cycling, it may be much broader, including:
preventing banks from being eroded; regulating water temperature and light pe-netration to a river bed;
therefore also regulating primary production in streams and reservoirs; and
creation of habitats for fauna.
CONNECTIVITY BETWEEN STREAMS AND ADJA-CENT SYSTEMS
The influence of ecotone vegetation on water qu-ality is possible only when the connection betwe-en terrestrial and water ecosystems is maintained. The basis for this connection is water circulation, therefore, the role of ecotones is significant only along unregulated river courses and natural sho-res of sho-reservoirs.
Under natural conditions, the influence of plant buffering zones on biochemical processes in fresh waters may vary from place to place according to the local geomorphology, soil type, moisture, in-teractions between plants and other organisms, etc (Box 5.9).
In the case of rivers it is also necessary to consi-der role changes of ecotones along a river course caused by changes in the water volume/length relationship (Box 5.10).
Surveys &
Assessments: Land-W
ater Interactions
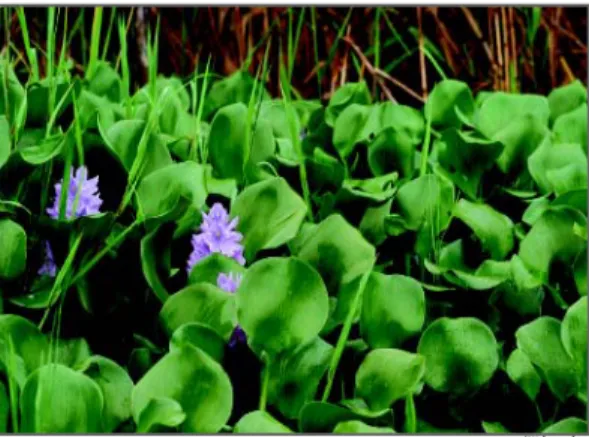
Fig. 5.2 Water hyacinth is a weed that rapidly recycles nutrients in aquatic ecosystems (photo: V. Santiago-Fandino)
As the presence of aerobic and anaerobic condi-tions is dependent on water level, it is of great importance to preserve the hydrological dynamics (rate and timing of events) in a landscape typical for dominating ecotone communities.
Role of vegetation
The role of riparian vegetation in maintaining the resilience of freshwater ecosystems is based on:
increase of infiltration of surface flow; decrease of surface flow velocity due to gre-ater coarseness of groundcover vegetation; enhanced sedimentation; and
nutrient retention in soil and plant tissues. Naturally occurring riparian communities in tem-perate climates: alder forests (Alnetea
glutino-sae), mixed ash and alder forests (Querco - Fage-tea), wet meadows (Molinio - Arrhenatheretea)
and rushes (Phragmitetea).
They may appear separately or form successive zones significantly reducing nutrient concentra-tions in ground waters and diminishing surface flow from agricultural areas (Klosowski, 1993). Zonation and species composition, together with hydrological and soil conditions, determine the physical structure of riparian habitats. This is worth underlining because plants themselves accumula-te only 10-50% of nutrients passing through the buffering zone (mostly during the growing season). The remaining pollutants are retained by other eco-tone components (Box 5.11).
Ecotone efficiency
According to Petersen et al. (1992), the efficiency of wide ecotone zones (19-50 m) may reach even 78-98% removal for N in surface waters and 68-100% in ground waters. Other authors estimate reduction efficiency at a level of 50-90% for nitro-gen and 25-98% for phosphorus (in ground water) depending on the initial concentrations, width of buffering zone, soil type and according to Iner-mediate Complexity Concept (see chapter 11.C) the complexity of the ecotone structure (Peterjohn & Corella, 1984; Verhoeven et al., 1990).
It has also been found that the most intense re-duction occurs within the first 10 m of an ecotone zone (Box 5.12).
NATURAL PROCESSES INVOLVED IN NUTRIENT REMOVAL
Biochemical processes
There are two groups of processes responsible for nutrient retention and transformation:
those occurring in aerobic layers - precipita-tion and sorpprecipita-tion of P on clays (due to pre-sence of Al, Ca, Fe ions), nitrification of N; and in anaerobic layers - release of P, fixation and denitrification of N (at oxygen concen trations below 4 mg L-1).
Surveys &
Assessments: Land-W
HOW TO ASSESS THE EFFICIENCY OF ECOTONES IN NUTRIENT REMOVAL
Assessment of nutrient removal by ecotone zones requires:
detailed geomorphology and aquifer analysis prior to the setting of sampling points; assessment of plant composition and zona-tion and preparazona-tion of maps;
determination of the dominant type of land use in the neighbouring area; and
installation of piezometer nets in transects across an ecotone zone - the distribution should reflect the plant zone distribution, including the area being considered as a pollution source and the recipient fresh wa-ter (Box 5.13);
Piezometer installation should be carried out in the season when the water level is the lowest (June-July in temperate climates). The phospho-rus and nitrogen loads transported into a reservo-ir via ground water are calculated on the basis of underground inflow (L s-1 km2 ) and concentration
of nutrients (mg L-1).
The physical-chemical analysis of water samples should include: pH, temperature, conductivity, oxygen concentration, dissolved forms of phospho-rus and nitrogen - PO4-P, NO2-N, NO3-N, and NH4 -N, and total phosphorus and nitrogen con-centrations.
piezometers should be installed in drilled holes reaching the first attainable water layer. samples of ground water for physical-chemi-cal analysis are collected after measurement
Surveys &
Assessments: Land-W
of the water level inside the piezometers (e.g., by using a depth indicator bound to a tape measure) and movement of the water (see chapter 5.A).
during the drilling and installation of piezo-meters, soil samples should be taken in or-der to assess the characteristics of a soil profile and to estimate the filtration coeffi-cient of subsequent layers.
DYNAMICS OF NUTRIENT UPTAKE AND REMOVAL - CONCLUDING REMARKS
The dynamics of nutrient uptake by natural eco-tone zones is determined by:
Land geomorphology - in upland and moun-tain areas riparian ecotones are poorly de-veloped and the incline of the catchment promotes rapid surface flow. Therefore, em-phasis should be put on proper land mana-gement and development of biogeochemical barriers over a whole catchment area.
Surveys &
Assessments: Land-W
Nutrient load - it was found that P removal rate exceeds 50% only when loading rates were lower than 50kg ha-1 year-1.
Season - it was estimated that in temperate zones vegetation works as a trap for nu-trients for 9 months on average; effective-ness for N-trapping is higher and prolonged due to high microbial involvement in trans-formation processes.
MAKE SURE TO CHECK THESE RESOURCES:
Surveys &
Assessments: Land-W
ater Interactions
Plant composition - herbaceous vegetation is more active in nutrient uptake and accu mulation due to dynamic growth, while tre-es and shrubs block nutrients for longer pe-riods and require less conservation.
Finally, it has to be stressed that natural ecotones and riparian wetlands in many cases play not only the role of nutrient barriers, but also transfor-mers - they import inorganic forms of nutrients and export organic ones and also buffer and smo-oth nutrient pulses.
Guidelines: chapters 5.D-5.E
http://www.thewaterpage.com/aq_eco_groundw.htm
http://srmwww.gov.bc.ca/risc/pubs/aquatic/design/index.htm http://www.thewaterpage.com/aq_eco_july_01.htm
5.C. HOW TO ESTIMATE EFFECTS OF RIPARIAN AREAS ANS FLODPLAINS
ON WATER QUALITY AND QUANTITY?
Riparian areas are natural elements of each stre-am and river. They can be defined as an ecotone, or an extended system of ecotones and riparian areas located along a water body. However, usu-ally their structure and role is more complex. Re-storation and management of flooded areas is of crucial importance for proper functioning of river systems as well as the water bodies located do-wnstream. The objective of this chapter is to pre-sent methods for identification of flooded areas and to assess their potential role in controlling the quantity and improving quality of water and the environment.
WHAT ARE THE ELEMENTS OF A RIPARIAN AREA? Riparian areas are complex systems that provide optimum habitat and food for stream communi-ties. They are characterized by floral and faunal communities distinct from surrounding upland are-as.
Generally, the following elements can be distin-guished in riparian area:
swamp areas, directly adjacent to the stre-am or river;
transitional swamp areas; ecological corridors;
areas covered with organic soils;
areas of seasonally high groundwater level (0,6 m below the ground level);
hill slopes, with slopes greater than 15 %, directly enclosing a stream or river;
areas flooded with a 100-year flood, i.e., a flood with a 1% probability of recurring; and buffering zones.
Riparian may contain also such features as back-swamps, delta plains, and oxbow lakes.
WHAT IS A FLOODPLAINS?
A floodplain is a flat area located alongside a stre-am or river channel that is inundated during high river discharges. Floodplains are formed by the deposition of sediments during periodic floods. Floodplains are designated by flood frequency that is large enough to cover them. For example, a 10-year floodplain will be covered by a 10-10-year re-turn-flood and the year floodplain by a
100-year return-flood. This means floods that will occur with probabilities equal to 10% and 1%, re-spectively.
WHY SHOULD WE DESIGN AND PROTECT FLOODED AREAS?
Flooded areas play a variety of roles in regulating the quality and quantity of rivers, as well as that of reservoirs and lakes located downstream. To a great extent they may regulate the self-sustaining potential of a river ecosystem and increase it’s absorbing capacity against such threats as land-scape degradation and consequential increases of diffuse pollution and flood risk. Properly managed floodplains are responsible for:
stabilization of river discharge, mitigation of the effects of floods and droughts; providing a framework for biogeochemical processes taking part at land-water interfa-ce zones and enhancing matter retention and self-purification of a river; and providing a number of transitional land-wa-ter habitats and supporting development of biodiversity in an area.
Floodplains are crucial for flood protection and discharge stabilization in lowland rivers; Floodplains enhance self-purification of a river and are sinks for dissolved pollutants and nutrients as well as suspended solids transported by rivers during floods.
Surveys &
Assessments: Land-W
ater Interactions
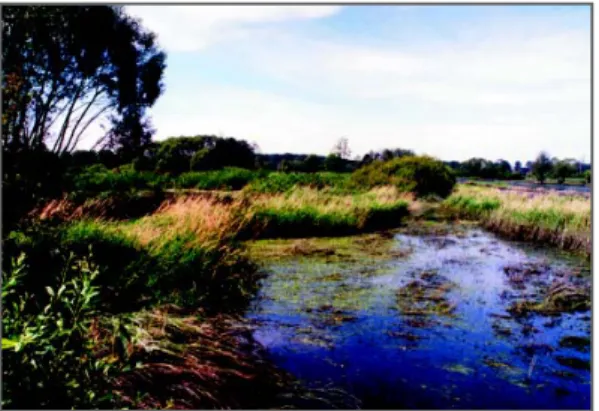
Fig. 5.3 Floodplain of the Pilica River in central Poland, a lowland river (photo: I. Wagner-Lotkowska)
HOW TO IDENTIFY A FLOODED ZONE Recognition
Depending on the scale of a river, the first step for identifying flooded areas and estimating their potential for water and pollutant retention, sho-uld be an analysis of maps and aerial photographs of a river corridor and adjacent areas located along it’s channel (see chapter 4.B). If possible, it sho-uld be supported with direct observations in the field. Data needed
The following information can be of importance for the preliminary work:
topographic and geological characteristics of an area with special emphasis on the land located along a river;
hydrological characteristics of a river and adjacent areas, including discharges of a ri-ver, distribution and density of other fresh water bodies and groundwater levels, if po ssible; and
existing information about land use and de-velopment of an area.
The following materials, if available, can be use-ful for estimating the extent of a flooded area and their potential role for flood mitigation and water quality improvement:
maps of the area
topographic maps - 1:10 000 scale (river-bed and adjacent floodplain areas); topographic maps - 1:25 000 scale (flo-odplain and adjacent catchment); topographic maps - 1:100 000 scale (catchment area for general overview of landscape use and structure); and soil maps - 1: 5 000 scale.
hydrological and meteorological data yearly distribution of precipitation, snow cover, air temperature, potential evapotran-spiration, in order to calculated mesoscale water circulation in the catchment; and discharges with given probability of
exce-eding calculated values on the basis of a long term series of maximum discharges from gauged basins or determined by em-pirical methods in case of ungauged ba-sins.
hydraulics data - roughness coefficient de-termined on the basis of inventory, land use maps, aerial photofraphs, and literature geodesy data
river cross-sections; and
cross-sections of existing hydrotechni-cal infrastructure.
others
photographs of a river, river corridor and floodplains;
aerial photographs of potentially flooded zones; and
video documentation of historical floods, if available.
FIELD STUDIES AND MEASUREMENTS
To identify and assess the ecological potential of flooded zones for retention of water and matter, it is also necessary to carry out additional field measurements.
The basic information to be collected should co-ver the following:
characteristics of a riverbed with detailed information about hydrotechnical construc-tion and infrastructure; and
detailed information about the ecological va-lue of an area.
Characteristics of a riverbed
Special attention should be given to the natural structure of a riverbed. The following parameters should be listed for river sections of interest for potential management of flooded areas:
distribution, length and characteristics of na-tural river sections;
distribution, length and characteristics of re-gulated and canalized river sections; width, depth and cross sections of a river in all characteristic areas, with special empha-sis on the section where flooded zones are to be restored and adjacent upstream and downstream floodplain sections;
cover and stability of a riverbed grain- size distribution; and
existing and planned hydrotechnical con-structions along a river.
Surveys &
Assessments: Land-W
Appropriate consideration should be given to brid-ges, roads, human settlements and other infra-structures. The following aspects should be taken into account:
potential risk of floods for human popula-tions and infrastructure;
potential impact of infrastructure on water flow (especially bridges, dams); and potential impact of infrastructure on water quality (especially location of sewage treat ment plants, tanks, industry etc. in areas po tentially flooded).
ECOLOGICAL VALUE OF AN AREA
In order to establish flooded areas to be restored, ecological studies should encompass the three fol-lowing biotopes:
water biotopes;
land-water interface (flooded) biotopes; and land biotopes.
This assessment allows for the evaluation of the ecological value of particular biotopes. It also pre-sents estimates of ability of flooded areas to ma-intain ecohydrological processes of importance for water and nutrient retention.
Assessments of biotopes can be conducted using either qualitative or experimental assessment methods. There are many methods for preparing ecological inventories. The choice depends on the target of investigation and type of development of an area and also on regional preferences and type of a river (mountain or lowland). In- spite of many determination techniques for this, they are subject to bias by a researcher’s point of view and that is why experience is required. LÕLFA/ LWA (1985) is an example of the criteria that can be taken into account for assessment of all biotopes. Ecological and landscape values of rivers are de-termined on the basis of an analysis that takes into account the following criteria:
river morphology;
hydrological characteristics;
physical and chemical characteristics of water;
river bed afforestations, water vegetation and water course scarp vegetation;
biodiversity of biotopes, vegetation cover and distribution of native plant communities of a floodplain;
river valley land use; and
particular natural value of a valley.
Such analysis leads to determination of the natu-ral water course category.
ASSESSMENT OF VEGETATION COVER
It is necessary to estimate vegetation cover of flo-odplain areas in order to estimate floflo-odplain po-tential for assimilation of nutrients by vegetation biomass. The vegetation cover can be indicated on maps by using a GPS system (see chapter 4.B). It is recommended to identify the native plant communities and their ability for nutrient reten-tion and biomass producreten-tion under various hydro-logical conditions (groundwater level, timing of flooding).
ELABORATION OF A DIGITAL FLOODPLAIN MODEL In order to identify an floodplain area for restora-tion, a digital terrain model (DTM) should be con-structed. The model can be made on the basis of information from collected maps. In some cases, additional denivelation of a floodplain may be necessary.
Denivelation of a floodplain can be based on a network of altitude points created from irregular networks (TIN) by tachymeter measurements. On the basis of the collected data, the following in-formation can be generated:
geodetic description;
visualization of the topography of an area; and
a location-altitude map of a floodplain. ELABORATION OF AN INUNDATION MODEL Inundation models of floodplains can be develo-ped on the basis of location-altitude maps of an area by using hydraulic models. Boxes 5.14 and 5.15 give examples of floodplain areas for an upland and lowland river.
MAKE SURE TO CHECK THESE RESOURCES:
Surveys &
Assessments: Land-W
Surveys &
Assessments: Land-W
ater Interactions
Guidelines: chapters 5.E-5.H, 7 www.biol.uni.lodz.pl/demosite/pilica
Biological monitoring programs are used worldwi-de to assess river condition. The use of biota to assess river condition has numerous advantages for complex river ecosystem quality assessments. As biotic communities are affected by a multitude of chemical and physical influences, the condi-tion of the biota reflects the overall condicondi-tion of a whole river ecosystem. This chapter reviews se-veral international biological assessment methods and the potential to use physical assessment me-thods to complete bioassays.
WHY FOCUS ON RIVER ECOSYSTEM ECOLOGICAL INTEGRITY (EI)?
Over the last decades the main focus of stream and river assessments has been on their chemi-cal/physical water quality. The ability to measu-re this has been considerably improved in many industrial countries. However, riverine hydrology, morphology and connectivity still continue to de-teriorate due to human activities in river basins. Today water directives (e.g., European Union Wa-ter Framework Directive, 2000/60/EC) challenges ecologists to provide practical methods for asses-sing the ecological integrity (EI) of running waters (e.g., FAME project).
Ecological Integrity (EI) of water ecosystem
(ÕNORM 6232)
Maintenance of all internal and external proces-ses and attributes interacting with the environ-ment insuch a way that the bioticcommunity cor-responds to the natural state of type-specific aqu-atic habitats.
WHY BIOASSAYS?
Despite the availability of many geomorphologi-cal/physical assessment methods, there remains an urgent need to develop biologically sound as-sessments and to link both kinds of methods in a biological perspective.
River bioassays can be based on: phytoplankton;
phytobenthos; macrophytes;
benthic invertebrates; and fishes.
6.A. BIOASSAYS - A TOOL TO MEASURE ECOSYSTEM QUALITY
BIOASSESSMENT (bioassay)
Uses biota as the endpoint to represent environ-mental conditions and assess environenviron-mental qu-ality.
It has been stressed that as integrators at the hi-ghest trophic level in riverine ecosystems, fishes are indicators in river assessments that broaden management objectives towards an ecosystem perspective, e.g., by the Ecohydrology Concept (Zalewski, 2000).
WHAT ORGANISMS CAN BE USED IN BIOASSAYS? Selection of an indicator group of organisms sho-uld consider differences in potential error and accuracy of estimating river status. From this per-spective, fish-based assessments are charactezed by the highest power to detect change in ri-verine ecosystems and with the lowest error in this estimation (Box 6.1).
As shown in Box 6.1 indicator variability (δ) de-creases along the x-axis in the manner: phyto-plankton > zoophyto-plankton > macroinvertebrates > macrophytes > fish. Thus, e.g., phytoplankton will have higher α and β error frequencies and, there-fore, lower statistical power to detect change than other indicator groups such as fish.
WHY USE VARIOUS INDICATOR GROUPS IN BIOASSESSMENT?
Selection of complementary early- and late-war-ning indicator groups reduces the probability of not detecting an impact if it occurs.
For instance, phytoplankton has high seasonal
va-Surveys &
Assessments: Streams & Rivers
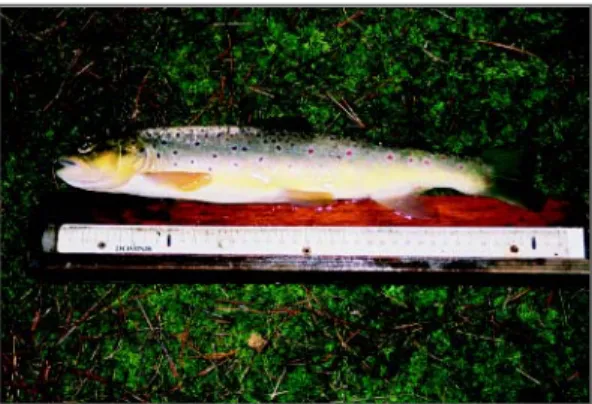
Fig. 6.1 Fish-based assessments have the highest power to detect change in riverine ecosystems (photo: Z. Kaczkowski)
riability, limiting their use in environmental as-sessments (high α error) (Box 6.1). Macrophytes have low seasonal variability, but due to slow chan-ges in community structure, can not be used as an early warning indicator. But, when change is de-tected in macrophyte species composition, then an impact has probably occurred (low β error) -Box 6.1-(Johnson, 2001).
A combination of early-warning indicator groups (phytoplankton, periphyton) together with a late-warning, but statistically more accurate indicator group (macrophytes, fish), results in an optimal assessment of river conditions:
if the ecosystem-stressor is nutrient enrich ment:
consider phytoplankton or periphyton as first choice indicators, as they show a more
ra-pid response to eutrophication than macro invertebrate, macrophyte or fish communities. if the ecosystem-stressor is temperature: consider fish or macroinvertebrates as first choice indicators, as they show a more ra-pid response to changes in water tempera-ture than phytoplankton or periphyton com-munities.
WHAT METHODOLOGICAL APPROACHES CAN BE USED FOR RIVERINE QUALITY BIOASSESSMENT? The following methodological approaches to bio-assessment are currently applied (Johnson, 2001; Faush et al, 1990):
single metric approach: estimates richness, density of individuals, and similarity, diversi-ty of communities (see chapter 6.B.); multimetric approach: aggregates several metrics as in, e.g., Index of Biotic Integrity (IBI index) for macroinvertebrates or for fish (see chapter 6.B.); and
multivariate approach: measures the mathe-matical relationships among samples (e.g., si-milarity in structure of two communities) for 2 or more variables (e.g., qualitative pre-sence-absence of species, or quantitative abundance or biomass of species) are selec-ted. For example, Jaccard similarity coeffi-cient, cluster analysis, discriminant analysis, ordination techniques (PCA, CA, CCA). Choosing the method, or a combination of me-thods, should consider method advantages and, especially, disadvantages (Faush et al., 1990):
multimetric
conceptually simple;
easy to compare to reference values; More ecologically sound;
Dependent on sample size and ecoregion; Easy to understand and interpret and ap-ply by water managers.
Multivariate
Conceptually complex ;
Higher precision than multimetric appro-ach; and
Difficult to understand and interpret and to apply by water managers;
Surveys &
Surveys &
Surveys &
Assessments: Streams & Rivers
METHODS FOCUSED ON BIOLOGICAL ASSESSMENT The current methods used in bioassessment are described in Table 6.1.
HOW TO LINK ASSESSMENT METHODS IN A BIO-LOGICAL PERSPECTIVE?
To improve the quality of river assessment physi-cal and geomorphologiphysi-cal, methods in addition to biological methods should be considered (Table 6.2). The common link between assessing river condi-tion from biological and
geomorphological/physi-cal perspectives is the use of physigeomorphological/physi-cal habitat as a template for biological processes and river eco-system dynamics (Southwood, 1977; Townsend & Hildrew, 1994). Many currently apply bioasses-sment methods using physical assesbioasses-sment proto-cols to describe habitat conditions of indicator biota. Recently developed river assessment sys-tems like, e.g., SERCON (Table 6.1), use both bio-logical and physical assessment methods (RHS) to evaluate rivers for conservation.