FACTORS INFLUENCING THE ADOPTION OF
M-COMMERCE IN INDONESIA
A Study of TAM and TPB Integration Model
Aditya Putra
Dissertation submitted as partial requirement for the conferral of Master in International Management
Supervisor:
Professor António da Silva Robalo
Department of Marketing, Operations and General Management – ISCTE Business School
ii FAC T OR S INFLUENCI NG THE A DOPTI ON OF M -CO MME RCE I N INDON ESIA: A Stud y of TA M an d T PB I nte gra tion M od el A dit ya P u tra
iii
RESUMO
A rápida transformação na tecnologia de telefones móveis/banda larga móvel e o aumento na cobertura de internet em redes sem fios, conduziu ao crescimento do comércio electrónico à escala mundial. Este fenómeno tem induzido um crescente interesse em plataformas de comércio móveis por parte de diversos sectores empresariais desejosos de entrar neste modelo de negócio. Assim, é importante saber como os consumidores se vão adaptar e adoptar estas tecnologias para expandir este mercado emergente, especialmente em mercados de elevado potencial e com elevado número de consumidores, como a Indonésia.
Este estudo fornece diversas hipóteses de identificação dos factores que contribuem para influenciar as intenções de consumo e de comportamento dos consumidores utilizando sistemas de comércio electrónico, adaptando a integração do Modelo de Aceitação de Tecnologia e a Teoria do Comportamento Planeado à análise dos dados recolhidos. Os factores analisados neste estudo foram a atitude, a utilidade percepcionada, a percepção de facilidade de uso, normas subjectivas, o controle percebido do comportamento e a confiança dos consumidores.
De acordo com os dados recolhidos a partir de 384 questionários on-line validados, os resultados demonstram que as intenções de comportamento dos consumidores são predominantemente afectadas pelas atitudes dos consumidores, seguidas de normas subjectivas e pelo controle percebido do comportamento. Não foi demonstrado qualquer efeito directo da utilidade percepcionada na intenção comportamental dos consumidores. Contudo, há um efeito indirecto via atitude do consumidor. A atitude to consumidor em si mesma é directamente influenciada pela percepção de utilidade e de confiança, e também por um efeito indirecto a partir da facilidade de utilização através da utilidade percepcionada. Desejavelmente esta tese poderá proporcionar ajuda aos negócios interessados em plataformas móveis de comércio, e estimular mais investigação para entender o comportamento dos consumidores indonésios neste tipo de negócios.
Palavras Chave : Adopcão de sistemas, Comércio electrónico, Modelo de Aceitação de
Tecnologia, Teoria do Comportamento Planeado, Confiança, Comportamento dos Consumidores indonésios.
iv
ABSTRACT
The rapid shift in technology regarding mobile phone and wireless internet coverage has led to the growth of mobile commerce transaction worldwide. This phenomenon is raising awareness among business players who want to jump into the mobile commerce platform. Therefore, the insight on how the consumer will adapt and move to the mobile platform is essential to expand the market, especially on colossal consumer base like Indonesia.
This study provides several hypotheses to identify the factors that contribute to influence the consumer behavior intention to use mobile commerce system by adapting the integration of Technology Acceptance Model and Theory of Planned Behavior. The researched factors consist of attitude, perceived usefulness, perceived ease of use, subjective norm, perceived behavioral control, and trust.
According to the collected data from 384 qualified respondents through an online questionnaire, the result shows that the consumer behavioral intention is dominantly affected by users’ attitude and then followed by subjective norm and perceived behavioral control. There is no evidence for the direct effect from PU to BI. However, PU has an indirect effect on BI through the attitude. The attitude itself is getting direct influence from trust and perceived usefulness, also an indirect effect from the perceived ease of use through PU. Hopefully, this thesis could provide help for the mobile commerce business and stimulate further research to understand the Indonesian consumer behavior in mobile commerce market better.
Keywords : System adoption, mobile commerce, technology acceptance model, theory
of planned behavior, trust, Indonesian consumer behavior
v
ACKNOWLEDGEMENTS
I would like to grant my gratitude to my supervisor, Professor António da Silva Robalo, for his advice and support since the very beginning until I finally finished this study.
I also want to send my thanks to my big wonderful family, who have given me the opportunity to gain many experiences and finish my study, especially my late-father for always be there for me, showing me how to love unconditionally.
Lastly, I am so grateful to meet everyone that somehow cross-path with me during this study. They helped me grow, be able to solve problems and learn to appreciate life more.
vi
INDEX
RESUMO ... iii ABSTRACT ... iv ACKNOWLEDGEMENTS ... v INDEX ... viLIST OF FIGURES ... viii
LIST OF TABLES ... ix
GLOSSARY ... x
1. INTRODUCTION ... 1
2. LITERATURE REVIEW ... 5
2.1. The Evolution of Mobile Commerce ... 5
2.2. Characteristics of Mobile Commerce ... 7
2.3. Technology Acceptance Model (TAM) ... 8
2.3.1. The history of TAM ... 9
2.3.2. The evolution of TAM ... 10
2.3.3. The critics towards TAM ... 14
2.3.4. Conclusion of TAM ... 15
2.4. Theory of Planned Behavior (TPB) ... 15
2.4.1. The history and development of TPB ... 15
2.4.2. The critics towards TPB ... 18
2.4.3. Conclusion of TPB ... 18
3. PROBLEM STATEMENT AND HYPOTHESES ... 20
3.1. Problem Statement ... 20
3.2. Hypotheses Development ... 21
3.2.1. Perceived usefulness (PU) ... 21
3.2.2. Perceived ease of use (PEOU) ... 21
3.2.3. Attitude (ATT) ... 22
3.2.4. Subjective norms (SN) ... 22
3.2.5. Perceived behavioral control (PBC)... 22
3.2.6. Perceived trust (TRU) ... 23
3.3. Proposed Model ... 25
4. RESEARCH METHODOLOGY AND DATA ANALYSIS ... 26
4.1. Research Methodology ... 26
vii
4.1.2. Operational definition ... 26
4.1.3. Data collection and sample characteristics ... 28
4.2. Data Analysis and results ... 29
4.2.1. Measurement model ... 29
4.2.2. Structural model ... 33
5. FINDINGS AND DISCUSSION ... 36
5.1. Theoretical implications ... 36
5.2. Managerial implications ... 40
6. CONCLUSION AND LIMITATIONS ... 44
6.1. Conclusion ... 44
6.2. Limitations ... 44
7. BIBLIOGRAPHY ... 46
8. ANNEXES ... 53
8.1. Questionnaire Development ... 53
8.1.1. Perceived Usefulness (PU) ... 53
8.1.2. Perceived Ease of Use (PEOU) ... 54
8.1.3. Trust ... 55
8.1.4. Attitude ... 56
8.1.5. Subjective Norm (SN) ... 57
8.1.6. Perceived Behavioral Control (PBC) ... 58
8.1.7. Behavioral Intention (BI) ... 59
viii
LIST OF FIGURES
Figure 1 Desktop vs. Mobile Market Share in Indonesia from Q1 2009 – Q4 2017 ... 4
Figure 2 Theory of Reasoned Action (TRA) ... 10
Figure 3 Original TAM model according to Fred Davis (1986) ... 10
Figure 4 Early development of TAM by Davis, Bagozzi and Warshaw (1989) ... 11
Figure 5 Final version of TAM by Venkatesh and Davis (1996)... 11
Figure 6 Model in TAM 2 by Venkatesh and Davis (2000) ... 12
Figure 7 Model TAM 3, including determinants for perceived ease of use by Venkatesh (2000) ... 13
Figure 8 Initial Theory of Planned Behavior by Ajzen (1985) ... 17
Figure 9 Model adaptation of Theory of Planned Behavior by Mathieson (1991) ... 17
Figure 10 The proposed model ... 25
ix
LIST OF TABLES
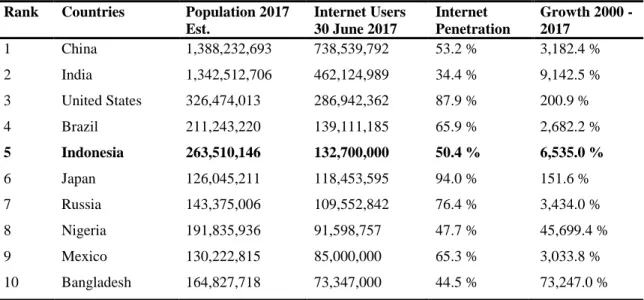
Table 1 Top 20 Countries with The Highest Number of Internet Users ... 4
Table 2 World Internet Users and 2017 Population Stats ... 6
Table 3 The definitions of the research hypotheses ... 25
Table 4 The operational definitions of the research variables ... 27
Table 5 Demographic characteristics ... 28
Table 6 The three categories of model fit and the recommended level of acceptance ... 30
Table 7 The model fit indices ... 30
Table 8 Model validity and reliability measures ... 31
Table 9 Standardized factor loadings and R-squared per item ... 32
x
GLOSSARY
BI – Behavioral Intention
E-commerce – Electronic commerce M-commerce – Mobile commerce PBC – Perceived Behavioral Control PEOU – Perceived Ease of Use PU – Perceived Usefulness SN – Subjective Norm
SNS – Social Networking Site
TAM – Technology Acceptance Model TPB – Theory of Planned Behavior TRA – Theory of Reasoned Action
1
1. INTRODUCTION
The massive spread of the mobile phone worldwide has become a great phenomenon to change the interaction among humans. It transformed the way people communicate and connect without borders (The Economist, 2015). Distance is no longer a problem to pass on any message or information due to the rapid improvement of the technology. The use of mobile phone is predicted to keep advancing in the years ahead. Chaffey gathered data from Morgan Stanley Research through ComScore report and showed that the number of global mobile users had surpassed the desktop users around early 2014 (Chaffey, 2017). This data marks a trend of rapid growth in mobile phone end users compared to the desktop computer.
There are around seven billion people (95% of the global population) living in an area which has a mobile-cellular network (ITU, 2016). In its finding, ITU (2014, 2015, 2016) mentioned how fast the internet and mobile adoption had changed worldwide. The changes also apply in the developing countries as well, even though these are still behind the other wealthy countries (Poushter, 2016). Such a massive growth of mobile user determines the potential of the commercial use of the mobile aspect, which will lead to mobile commerce (m-commerce).
Initially, during the development of mobile phone, m-commerce had been used for a simple transaction like buying customized ringtones or display picture in the late 90’s. The performed transaction was still understandable as a result of the constraint in that current technology. Although the conducted activities were not that extensive, they already planted the idea for more prominent use of mobile commerce in the future. In the late 2000’s, the birth of smartphone changed the mobile industry by extending the features of a mobile phone. It was gradually enhancing its function towards a computer.
Since 2010, Ingram had predicted that mobile internet would outpace the number of fixed internet use (Ingram, 2010). In line with the forecast, the internet usage in mobile apps alone finally beats the personal computer in February 2014 (O’Toole, 2014). It is understandable since the number of mobile users also raised significantly and passed the
2 total of desktop users as previously mentioned (Chaffey, 2017). Accordingly, the extension of the mobile phone ability with internet support has opened a whole new function. The easiness in developing mobile applications (mobile apps) within specific mobile operating systems (OS), such as iOS and Android, gives support to boost this trend. Currently, there are millions of apps that provide services and products to the mobile phone users.
The rapid advancement in the smartphone has led the innovation in the mobile commerce sector as well. People can no longer have to be bound to the computer to deal a transaction since the mobile phone can simplify things, especially using the optimized-apps designed for mobile users. Nowadays, customers are allowed to shop via the internet through multiple devices, like a tablet or mobile phone. Therefore, many m-commerce players are creating mobile apps and optimizing its website for multiple devices (a responsive design) to provide better mobile experience (Jahanshahi et al., 2012).
United Nation Conference on Trade and Development defined the mobile commerce as buying and selling of goods and services using wireless handheld devices (UNCTAD, 2004). M-commerce acts as another channel through which has the potential of a broader value added compared to e-commerce processes. Many speculated that mobile commerce is going to be the next phase in technology involvement following the electronic commerce era. However, the adoption rate of the mobile transaction in Indonesia was lower compared to China, South Korea, and India as indicated in the State of Global E-commerce Report 2013 by GlobalWebIndex (eMarketer, 2013).
Indonesia is one of the highest population in Southeast Asia with around 250 million people and made Indonesia as the 4th most populous country in the world (Badan Pusat Statistik, 2016; The World Bank, 2015). Data from the Internet World Stats on Table 1 stated that there are roughly around 132.7 million internet users from Indonesia. With that vast numbers, Indonesia has the potential to be a big market to gain customers.
The connection of internet through mobile in Indonesia was reaching 64.1 million by fourth quarterly report 2015 GlobalWebIndex, and it showed a good number compared to the other developing countries (We Are Social, 2016). In 2020, the middle class will be rising to an astonishing number of 141 million as predicted by Boston Consulting Group (BCG)
3 under Syukra’s article on Jakarta Globe (Syukra, 2013). The consumption level in Indonesia is also high (Rastogi et al. 2016). Therefore, this condition highlights Indonesia as an attractive market in the future.
According to the eMarketer (2014), the total of the transaction from e-commerce is growing worldwide around 20 percent in 2014, while the m-commerce alone succeeds in capturing significant portion as mentioned by Brohan (2015) and Criteo (2015a). In Indonesia, the findings from Criteo for Southeast Asia market showed a positive number (Criteo, 2015b; Ryza, 2015). The m-commerce trend in Indonesia started to rise significantly for the last couple of years since the progressive implementation of 3G network nationally. The total of the mobile commerce transaction is predicted to dominate the whole electronic commerce transaction soon (Harsono, 2016).
One of the unique characteristics of Indonesian consumer that has been spotted by Harsono (2016) is about the advantage of being mobile-first adopters. That unique character represents Indonesian market which embraces the use of smartphone rather than a desktop. Smartphone has contributed to more than 70 percent of internet traffic today according to the data from StatCounter (2017). The number of mobile users already passed the desktop counterpart since late 2014 as showed in Figure 1. The popular name of start-ups spreading widely, such as Gojek and Traveloka, who become a success story of venturing this benefit. Furthermore, the attention to m-commerce market in Indonesia has attracted the attention of more prominent e-commerce player like Alibaba, Amazon, and other companies (Koyanagi, 2017).
As previously explained, the recent technology development of mobile phone finally leads to the adoption of m-commerce to the users. M-commerce simplifies online purchasing by offering the new experience in a transaction to obtain services or products in the comfortable touch of fingertips. The user interface is designed to use the small screen of the smartphone better and to obtain many features like searching for information, evaluating different options, making a purchase, and multiple payment systems.
4
Figure 1 Desktop vs. Mobile Market Share in Indonesia from Q1 2009 – Q4 2017
This new trend sooner or later will affect how the marketers reach their customers. Due to the massive competition among the online retailers, mobile commerce seems to be the next big thing that will become the icon of the online market. By better understanding the behavior of m-commerce users, the retailers can improve the consumer experience and attract more customers. According to that, the factors that influence the adoption of commerce in Indonesia need to be determined to help the retailers deliver the best m-commerce experience.
Table 1 Top 20 Countries with The Highest Number of Internet Users
Rank Countries Population 2017
Est. Internet Users 30 June 2017 Internet Penetration Growth 2000 - 2017 1 China 1,388,232,693 738,539,792 53.2 % 3,182.4 % 2 India 1,342,512,706 462,124,989 34.4 % 9,142.5 % 3 United States 326,474,013 286,942,362 87.9 % 200.9 % 4 Brazil 211,243,220 139,111,185 65.9 % 2,682.2 % 5 Indonesia 263,510,146 132,700,000 50.4 % 6,535.0 % 6 Japan 126,045,211 118,453,595 94.0 % 151.6 % 7 Russia 143,375,006 109,552,842 76.4 % 3,434.0 % 8 Nigeria 191,835,936 91,598,757 47.7 % 45,699.4 % 9 Mexico 130,222,815 85,000,000 65.3 % 3,033.8 % 10 Bangladesh 164,827,718 73,347,000 44.5 % 73,247.0 %
(Source: Internet World Stats, 2017) 0 20 40 60 80 100 2009 2010 2011 2012 2013 2014 2015 2016 2017 YEARS
DESKTOP VS. MOBILE
MARKET SHARE INDONESIA
Desktop Mobile
5
2. LITERATURE REVIEW
Until now, there is only a few research that discussed mobile commerce adoption in Indonesia. However, many researchers have focused on e-commerce adaptation in various business fields. Therefore, diverse literature sources are available to understand about similar fields thoroughly. It is essential to review related previous studies and develop a theoretical background for the current research. Later on, this part of the essay will explain the evolution of mobile commerce, the studies about Technology of Acceptance Model (TAM), and Theory of Planned Behavior (TPB) for a better insight into this research.
2.1. The Evolution of Mobile Commerce
Since its development in the very beginning, the internet has shown the potential to grow hugely as a communication channel today. It was started in the early of 1960s and initially built for the military purposes (Leiner et al., 1997). Since the internet became public, the innovation keeps rolling in and finally contributes to its success. It attracts more users during the late 90s due to the extensive improvement on the service which opens a whole new way of interaction and functionality (Howe, 2016).
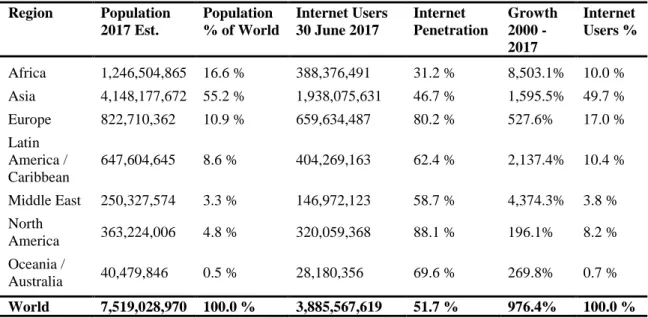
The idea of the internet is how to connect one computer to another to transfer information and establish communication. Now, the internet is a system which connects billion of computers network worldwide with total users reaching around 3.8 billion according to the available data in Table 2 (Internet World Stats, 2017). The trend for the smartphone for the last decade also pushing the adoption of the internet for mobile. Later, this mobile era is driving the movement of making everything connected and online through a mobile phone.
Some identified e-commerce as an economic activity in the form of exchange of information, goods, service, and payment, which occur through the digital platform of the internet (Pavlou, 2003; Sadi and Noordin, 2011; Suh and Han, 2003). The scope of e-commerce is utterly broad since it covers various transaction regarding advertisement, marketing, delivery, and all the way to the payment – it includes business-to-business (B2B), business-to-consumer (B2C), and consumer-to-consumer (C2C). The main
6 principle is about the utilization of internet and related digital technology to enhance the economic value added and commercial activities (Turban et al., 2015).
In many studies, researchers have recognized that mobile commerce is a further development of electronic commerce. Since m-commerce also uses the internet over mobile or tablet, the researchers categorized m-commerce as an extension of e-commerce. Both terms are pretty similar to each other and also shared fundamental business principles (Fong and Wong, 2015). In another opinion, mobile commerce is like a new element of the electronic commerce where all the transactions are connected via mobile devices and using a network in a wireless mode (Li and Dong, 2011). In a sense, mobile commerce is part of e-commerce which is specified through a mobile phone.
Table 2 World Internet Users and 2017 Population Stats
Region Population 2017 Est. Population % of World Internet Users 30 June 2017 Internet Penetration Growth 2000 - 2017 Internet Users % Africa 1,246,504,865 16.6 % 388,376,491 31.2 % 8,503.1% 10.0 % Asia 4,148,177,672 55.2 % 1,938,075,631 46.7 % 1,595.5% 49.7 % Europe 822,710,362 10.9 % 659,634,487 80.2 % 527.6% 17.0 % Latin America / Caribbean 647,604,645 8.6 % 404,269,163 62.4 % 2,137.4% 10.4 % Middle East 250,327,574 3.3 % 146,972,123 58.7 % 4,374.3% 3.8 % North America 363,224,006 4.8 % 320,059,368 88.1 % 196.1% 8.2 % Oceania / Australia 40,479,846 0.5 % 28,180,356 69.6 % 269.8% 0.7 % World 7,519,028,970 100.0 % 3,885,567,619 51.7 % 976.4% 100.0 %
(Source: Internet World Stats, 2017)
Although it is new, m-commerce has the potential to exceed e-commerce regarding interaction styles, usage patterns, and value chain. Further, it grants the flexibility to look for a product via handheld devices at any time and anywhere – unrestricted to a particular geographical location within a network coverage area. The data transactions are transmitted wirelessly, which allow the client to find information and purchase the product or service in a full mobility environment through mobile network (Sadi and Noordin, 2011; Nassuora,
7 2013). Therefore, as long as the transaction or the flow of the money is going through the online framework via mobile devices, it could be categorized as mobile commerce.
2.2. Characteristics of Mobile Commerce
On the previous description, it is noted that mobile commerce is an extension of the central system of electronic commerce. However, m-commerce posed some advantages over the general e-commerce due to its unique characteristics. There are five traits in mobile commerce to highlight in accordance with Turban et al. (2015); ubiquity, convenience, personalization, localization, and accessibility.
Okazaki et al. (2012) defined the character of ubiquity as being invisible, seamless. In a real application, it means that mobile commerce has a presence in everywhere, but at the same time, it is plain in sight. People can use mobile commerce in anywhere they go and make a purchase, look for information, ask for service, and so on. The wireless data service opens a whole new experience without the need to plug in for the internet connection. So now, mobile commerce could facilitate market transaction literally in any place that is covered by the network.
Clarke (2008) highlighted the feature of mobile commerce as providing convenience to the user. This context of convenience is related to the agility and accessibility that sticks to the wireless handheld devices. This trait of convenience provides several benefits to the user, utilizing from the technology of mobile data network that creates a seamless transaction to offer more services in any place, for instances, instant messaging to the seller, placing orders, checking the product review, and so on.
Besides the convenience, Clarke (2008) also stated about the localization aspect of mobile commerce. As of today, a smartphone has some extensive features; one of them is Global Positioning System (GPS). Localization in this context relates to the ability of mobile commerce to identify the location of the user in real-time. It becomes the distinctive attribute of m-commerce apart from the general e-commerce and elevates the service it might offer. Through GPS, the m-commerce merchant could develop geolocation-specific services to target niche markets, such as sending direct ads and locate a nearby buyer. On
8 the other hand, the customers could also track back the shipping items and the merchant’s store location.
Wattal (2007) mentioned about the other aspect of m-commerce, personalization, in the sense of mobile commerce ability to develop a customizable and personalize experience according to user’s preferences. Nowadays, the mobile phone has become a personal device. Personalization in the business approach associates to conduct profiling customer during the interaction and to analyze the data individually to match with the preferences on tailored products, customer service, and any further follow-up interaction with each specific user. In a broader sense, now it also covers for creating a familiar atmosphere by remembering the user’s name, personal data, a record of the interaction history, and it allows the user to customize the product and make a custom order, to the targeted-audience advertisement.
The last identifiable character in m-commerce is accessibility and interactivity, which it relates to the easiness of access and seamless interaction between the buyer and the seller (Turban et al., 2015). This accessibility feature relates to the mobility of wireless internet network as a basis of mobile commerce to work. Mobile users may enter to m-commerce platform and connect to a merchant in a real-time. Therefore, the users have the ability to correspond directly, and it allows the seller to create an active interaction channel likewise for promotional purposes. The accessibility and interactivity in mobile commerce context also closely related to the convenience and localization perspective.
2.3. Technology Acceptance Model (TAM)
Technology Acceptance Model does not come from only one discipline, but it derived from several fields of knowledge namely psychology, information technology, management, and so on. During its development until now, Technology Acceptance Model is widely used to predict the behavioral intention model for IT acceptance research (Pavlou, 2003; Venkatesh et al., 2003; Wu and Ke, 2015). However, the potential of using Technology Acceptance Model as a predictor on measuring the consumer behavior is also on the rise. Many studies look up for the business implication and how well this contribute to the
9 intention of the consumer to change and adapt to the new technology that has economic value.
2.3.1. The history of TAM
Technology acceptance model (TAM) was initially built from the older Theory of Reasoned Action (TRA), which drawn from social psychology (Fishbein and Ajzen, 1975; Ajzen & Fishbein, 1980). According to that finding, TRA is one of the fundamental and influential theories of human behavior. The causal relationship in TRA model, as shown in Figure 2, is comprised of six constructs: Beliefs, Attitude, Normative Beliefs, Subjective Norms, Behavioral Intention and Actual Behavior. For further study, they were adapted and modified in the development of TAM.
TRA theory believed that individual intention turned out to be a manifestation from two determinants: the attitude towards specific behavior and a personal perception over social pressure to perform the behavior (Hagger et al., 2002). Behavioral intention could manage to predict the action or performance if the intention measure meets the behavioral criteria; it is expected that people put an action in correlation to their intention. TRA theory’s capacity to predict the outcome of the voluntary act had gained a spotlight in the research field of business and consumer behavior.
In a comparison, TAM is an information systems theory developed to make predictions about technology acceptance (Venkatesh et al., 2003). This particular model commends that when system users are presented with new technology, there must be some factors influence their decision about whether to adopt the new system or not. TAM model measured the two core predictors, perceived usefulness and perceived ease of use, with its relation to the dependent variable, behavioral intention. In 1985, Fred Davis proposed in his dissertation stating that the purpose of the Technology Acceptance Model (TAM) is to explain the determinants of computer acceptance that could justify the behavior of users toward a wide range of computing technology. He proposed the system adoption as a response that can be explained or predicted by user motivation, which in turn, is directly influenced by an external stimulus consisting of the features and capabilities of the actual system.
10 (Source: Fishbein and Ajzen, 1975)
Figure 2 Theory of Reasoned Action (TRA)
2.3.2. The evolution of TAM
The core beliefs in TAM model are focused on the Perceived Usefulness (PU) and the Perceived Ease of Use (PEOU), in which become the measurement to determine the behavioral intention of the user towards IT (Davis, 1989). Perceived Usefulness (PU) and Perceived Ease of Use (PEOU) act as a mediator of the external variable’s effect on the intention. Extensive research has contributed to support TAM in predicting consumer behavior. They used TAM as the central paradigm, and some developed a new construct along the way to overcome the limitation and adjust the model to their object.Within the last two decades, there have been numerous studies supporting TAM model (Davis et al., 1989; Venkatesh and Davis,1996; Venkatesh, 2000; Venkatesh et al., 2003; Zarmpou et
al., 2012). Most of the research that has applied TAM as a reference paradigm emphasized
the model by adding the new predictive constructs into the classic model or extended TAM.
(Source: Davis, 1986)
Figure 3 Original TAM model according to Fred Davis (1986)
Beliefs & Evaluations Attitude Toward Behavior (A) Subjective Norm (SN) Normative Beliefs & Motivation to Comply Behavioral
Intention (BI) Actual Behavior
X1 X2 X3 Perceived Usefulness Perceived Ease of Use Attitude Toward Using Actual System Use User Motivation
11 (Source: Davis et al., 1989)
Figure 4 Early development of TAM by Davis, Bagozzi and Warshaw (1989)
(Source: Venkatesh and Davis, 1996)
Figure 5 Final version of TAM by Venkatesh and Davis (1996)
In the original TAM proposed by Davis (1986), he suggested that three factors are contributing mainly to the users’ behavior; perceived usefulness, perceived ease of use, and the attitude toward usage. The actual system use, which signified the outcome of users’ behavior action, has an attitude as its major factor to determine whether the users will accept or refuse the system. Consecutively, users’ attitude is hypothesized to be influenced by the two core constructs of TAM, perceived usefulness and perceived ease of use. Perceived ease of use also has an indirect effect on attitude through perceived usefulness. In the end, Davis (1986) arranged the other variables of system’s characteristic into the model, as symbolized by X1, X2, and X3 in Figure 3.
In the further development of the Technology Acceptance Model by Davis, Bagozzi, and Warshaw (1989), it was the very first time they introduced behavioral intention to the model. They believed that this new construct would mediate the relationship between the attitude and the actual behavior, and also have a direct effect from the perceived usefulness.
External Variables Perceived Usefulness (U) Perceived Ease of Use (E) Attitude Toward Using (A) Behavioral Intention to Use (BI) Actual System Use External Variables Perceived Usefulness Perceived Ease of Use Behavioral Intention Actual System Use
12 This model chain emphasized the limitation to the previous model as shown in Figure 4. The result of their research showed a small effect of the perceived ease of use to the behavioral intention, which later changed the course in the model development to the next version.
The next evolution of the model has removed the attitude construct from the picture and began to discover the direct implication of perceived usefulness and perceived ease of use to behavioral intention. Venkatesh and Davis (1996) come up with the new model as shown in Figure 5. It marked the final modification of TAM and the start of development of the second generation of TAM. Venkatesh and Davis (2000) published their result of research and proposed an extended version of TAM as TAM 2 in Figure 6. They discovered strong support for their proposed model according to the data retrieved from four organizations in developed countries. The critical milestone in this model is how they managed to incorporate new determinants of perceived usefulness. The factors that they discovered were the subjective norm, image, job relevance, output quality, result demonstrability and perceived ease of use.
(Source: Venkatesh and Davis, 2000)
Figure 6 Model in TAM 2 by Venkatesh and Davis (2000)
Result Demonstrability Output Quality Job Relevance Image Subjective Norm Usage Behavior Intention to Use Perceived Usefulness Perceived Ease of Use
Technology Acceptance Model Voluntariness
13 v
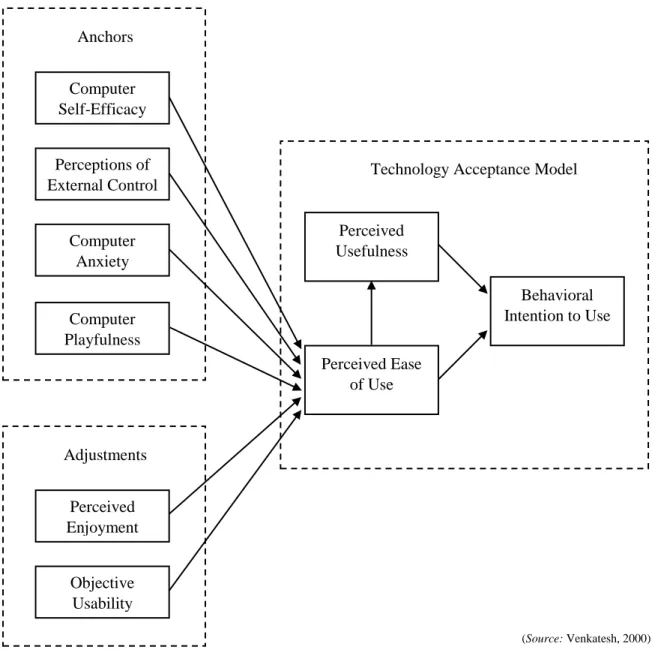
(Source: Venkatesh, 2000)
Figure 7 Model TAM 3, including determinants for perceived ease of use by Venkatesh (2000)
After successfully identified the factors that contributed to perceived usefulness, Venkatesh (2000) tried to explore deeper insight by breaking down the determinants of perceived ease of use. There are six factors included in the model; Computer Self-Efficacy, Perception of External Control, Computer Anxiety, Computer Playfulness, Perceived Enjoyment, and Objective Usability (Venkatesh, 2000). These factors expanded the scope of the prediction capability of the original TAM and TAM 2, which later is called TAM 3. This model offered a better insight and showed the relationship between the determinants of IT acceptance as a whole (Venkatesh and Bala, 2008).
Perceptions of External Control Computer Self-Efficacy Computer Anxiety Computer Playfulness Anchors Objective Usability Perceived Enjoyment Adjustments Behavioral Intention to Use Perceived Usefulness Perceived Ease of Use
14 Venkatesh (2000) classified the related antecedents of perceived ease of use into two major groups: expectancy and adjustments. As shown in Figure 8, these antecedents mostly are derivational from a couple of research before, which are Davis et al. (1992) and Venkatesh & Davis (1996). Venkatesh and Davis (2000) tried to clarify the perceived usefulness and usage intentions as an extension of the original TAM model.
2.3.3. The critics towards TAM
After so many research that reproduced the TAM model, the researchers came with several issues regarding the TAM limitation in varied topics. The main concerned about TAM in a long history of research has sparked a critic about the lack of real data involvement in capturing the actual use of the system. Until now, this model relies on the self-reported data using a questionnaire to measure the actual behavior of the user toward the system. Lee et al. (2003) found that 36 published studies that applied Technology Acceptance Model between 1986 and 2003 used this approach and assumed that it was adequate to reflect the actual behavior.
The other critic mentioned about the differences between mandatory versus voluntary environment. Less research used TAM in a compulsory system adoption in comparison to the voluntary system. Initially, TAM model mainly used in predicting the behavior under a voluntary situation. However, in the further development, more researchers tried to applied TAM into different stages, which spread to a different outcome in a mandatory system. Venkatesh and Davis (2000) said that the effect of subjective norm tends to be less significant toward behavioral intention in a mandatory context. Even though the outcome of behavioral intention could vary, Holden and Karsh (2010) found that in healthcare IT adaptation, the subjective norm is not always insignificant under the mandatory situation. Therefore, they believed that more factors contribute to the result.
The attitude as a construct also produced a critic to TAM model. Attitude is already widely used in many studies, and usually only generalized into one aspect. Meanwhile, Yang and Yoo (2003) tried to separate the attitude and split it into two perspectives: cognitive and affective. Their research outcome stated that the cognitive perspective is more significant
15 than the affective aspect (Yang and Yoo, 2003). Undoubtedly, this finding spurred a new query to the previous studies on Technology Acceptance Model.
Many researchers developed some constructs and focused on the weak theoretical relationship among them. On the one hand, these approaches would add more insight to the model as a whole. However, on the other hand, it derailed the research direction from the significant one, resulted in slow progress of better prediction model (Lee et al., 2003).
2.3.4. Conclusion of TAM
TAM has been introduced since a long time, and researchers have applied this model to several research streams. Some of them focused on identifying the determinants of critical predictors, namely, perceived ease of use and perceived usefulness (Davis, 1989; Taylor and Todd, 1995; Chang et al., 2012). Some papers extended the TAM by other theories to increase the predictive power (Venkatesh et al., 2003; Gefen, 2003; Cheung and Vogel, 2013). Despite the criticism on TAM, many studies still support on how TAM is widely accepted to predict the behavioral intention on different fields of technology acceptance.
2.4. Theory of Planned Behavior (TPB)
The application of Theory of Planned Behavior (TPB) is taken by adding a construct, perceived behavioral control (PBC), to the existing TRA model in Figure 2 (Ajzen, 1985, 1991). TPB holds a firm belief of how perceived behavioral control is acting as a determinant of intention and behavior. Some journals presented a revolution of TPB to better predict intention and behavior in a wide variety of settings (Pavlou, 2002; Pavlou and Fygenson, 2006; Nasri and Charfeddine, 2012). TPB is also well-known for its application to understanding the individual acceptance and usage of many technologies (Taylor and Todd, 1995). TPB has been one of the prominent theories yet in explaining and predicting the user behavior.
2.4.1. The history and development of TPB
Another model that comes from TRA theory is the Theory of Planned Behavior (TPB). TPB was born due to the limitation that rises from the TRA model by integrating the
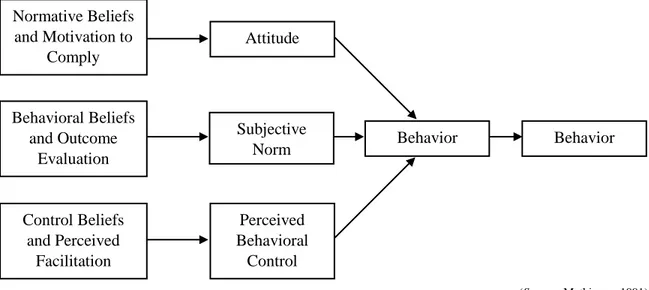
16 perceived behavioral control and behavioral intention altogether. The three primary constructs that contribute to TPB are attitude, subjective norm, and perceived behavioral control. Figure 8 presented the relationship among the related variables in TPB model. Attitude toward the behavior represents the awareness and evaluation of user against its behavior. Subjective norm (SN) represents the belief on how the social environment gives influence toward the behavior through the important people around a particular person. Perceived behavior control (PBC) represents the user’s awareness of its capacity and capability to conduct the behavior – and it also reflects if there is any previous experience or foreseeable issue and problem ahead (Ajzen, 1991).
Since Theory of Planned Behavior was based on the development of Theory of Reasoned Action, they share the same assumption that user’s behavior is a consequence stem from the decision of an attentive mind. Nevertheless, the significant distinctive improvement on TPB is related to the addition of control beliefs through perceived behavioral control. It means on this model, Ajzen (1991) also thought about variables from the external perspective, as the availability of resources, opportunity, and support to conduct a particular behavior. Mathieson (1991) in his research also adapt the model as proposed by Ajzen (1985) and develop the scheme as in Figure 9.
Theory of Planned Behavior is used in many social studies regarding consumer behavior prediction model. It gained popularity in health-related behavior, such as Conner et al. (1999), Conner et al. (2002), Godin and Kok (1996). However, recently Theory of Planned Behavior also has been used in the technology context (Holmes, 2008; Hsu et al., 2006). The comparison between behavior predicting models also exist in some studies in purpose to determine how the different model would give a more in-depth explanation on user’s action toward a system (Blue, 1995; Hagger et al., 2002).
The Theory of Planned Behavior disregards the use of external variables, unlike Technology Acceptance Model. Ajzen and Fishbein (1980) mentioned about this in their study that having the external variables requires it to be adapted for different field and behavioral system. Therefore, the Theory of Planned Behavior has adequate supports because external variables were not included in consideration since the original proposed model by Ajzen (1991).
17 (Source: Ajzen, 1985)
Figure 8 Initial Theory of Planned Behavior by Ajzen (1985)
(Source: Mathieson, 1991)
Figure 9 Model adaptation of Theory of Planned Behavior by Mathieson (1991)
Normative Beliefs and Motivation to Comply Behavioral Beliefs and Outcome Evaluation Control Beliefs and Perceived Facilitation Behavior Behavior Subjective Norm Attitude Perceived Behavioral Control Attitude toward the behavior Subjective Norm Perceived Behavioral Control Intention Behavior
18 The simplicity in Theory of Planned Behavior attracts researchers to adopt this model in a various system. TPB is considered to be easy to understand and it produced high consistency among those published journals. Broad application of this theory has indicated its immense understandability and utility, making it acknowledged by the scientific community.
2.4.2. The critics towards TPB
Since its extensive adaptation on many studies, Theory of Planned Behavior has been criticized for some reasons. The foremost critic mainly discussed the method in gathering the data by the researchers. The decision on the research method is entirely in the hands of each individual. However, most of the studies being published relied on self-report through questionnaires, which is hard to observe the actual behavior. A user with high positive attitude potentially creates unreliable and biased data due to the tendency to escalate positive respond all through questionnaire items.
The other limitation that scientists criticize also lies about the lack of emotional factors into the model equation (Conner & Armitage, 1998; Gibbons et al. 1998). The researchers had brought up this issue when they talked about the affective processing models. Compared to the other models, Theory of Planned Behavior disregard the emotional variable because this theory assumes behavior has a rational foundation. Meanwhile, as a human our decision does not always come in accordance with the rational thinking. Therefore, scientists recommended also to consider this aspect to be included in the model. Ajzen (2002b) addressed this limitation by stating emotional variables are assumed to be an invisible influential force that affects human intentions and behavior through attitudes and personal beliefs.
2.4.3. Conclusion of TPB
In some studies, the TAM and TPB integration seemed to be natural for better understanding what factors play such vital roles to behavioral intention (Fong and Wong, 2015; Shih and Fan, 2013). The application of TAM in IT context is superior in comparison to the TPB broader variables. However, in some research, they were mentioned that extra
19 dimension would help in analyzing a whole new depth of reasoning (Taylor and Todd, 1995).
These past studies reflected successful applications of the theory and reinforced its utility for research involving technology adoption and distance education. Hopefully, this current study would expand upon the literature, regarding to the consumer behavior, with a new focus on how to develop the positive intention to adopt mobile commerce in Indonesia.
20
3. PROBLEM STATEMENT AND HYPOTHESES
3.1. Problem Statement
Mobile phone advancement regarding the capabilities of the smartphone, services, applications, standards, and network achievement indicates that the perfect environment for m-commerce business is already there. With the adoption of 4G technology, the rapidly growing number of mobile users, millions of mobile applications used every day, and also the easiness of mobile payment system, there is considerable growth in m-commerce transaction all over the world. This situation marked the next phase of rapid development. The trend of mobile commerce is quite recent in Indonesia, but the report of the tracked transaction is quite stunning nowadays. Hence, it is essential to learn how the customers accept the mobile commerce system. It may lead to a better understanding of the unique Indonesian characteristic and also the critical factors to support the adoption process. There are not so many previous studies related to this mobile commerce topic in Indonesia, while the adoption of the smartphone keeps increasing significantly.
Research Question
According to the problem statement above, the central question to be answered in this thesis is:
What are the influential factors that contribute to the adoption of m-commerce in Indonesia based on the integration adoption model of TAM and TPB?
Objective
The objectives of this research are to determine the influential factors that may contribute to the adoption of m-commerce in Indonesia based on the integration adoption model of TAM and TPB.
21
3.2. Hypotheses Development
This research will also discuss several factors, which are mentioned in the previous literature study, in relation to the technology adoption in the business area. They are derived from the technology acceptance model, the theory of planned behavior and the idea of trust towards the adoption of mobile commerce in Indonesia. Within this session, all of the factors will be explained with the supporting reason to be included in this research proposed model.
3.2.1. Perceived usefulness (PU)
PU is the extent to which one believes that using a system will enhance her performance (Davis 1989). In its adaptation to m-commerce consumer behavior, the researchers defined perceived usefulness as the extent to which a consumer believes that m-commerce would enhance their effectiveness in purchasing products. Perceived usefulness has been acknowledged to affect behavioral intention through attitude (Davis 1989; Taylor and Todd 1995b). Therefore, the proposed hypotheses are as follow:
H1a: Perceived usefulness positively influences the attitude toward adoption of m-commerce.
H1b: Perceived usefulness positively influences the behavioral intention toward adoption of m-commerce.
3.2.2. Perceived ease of use (PEOU)
PEOU is the extent to which a person believes that using the system will be effortless (Davis 1989). In application to the m-commerce context, the perceived ease of use has a role as the extent to which a user believes that purchasing products through m-commerce channel would be free of effort. Similarly to PU, the role of PEOU on intentions is mediated by attitude (Davis 1989; Taylor and Todd 1995b). Hence, the designed hypotheses are as the following:
H2a: Perceived ease of use positively influences the attitude toward the adoption of m-commerce.
22 H2b: Perceived ease of use positively influences the perceived usefulness of m-commerce.
3.2.3. Attitude (ATT)
Attitude has been shown to influence behavioral intentions by many research (Ajzen and Fishbein, 1980). This relationship has received substantial empirical support. Regarding the focal behaviors, attitude toward m-commerce adoption is defined as the consumer’s evaluation of the desirability of using m-commerce channel to get information and purchase products from an m-commerce merchant respectively. By using deductive logic, favorable attitude is likely to encourage consumers to purchase products or services from a merchant.
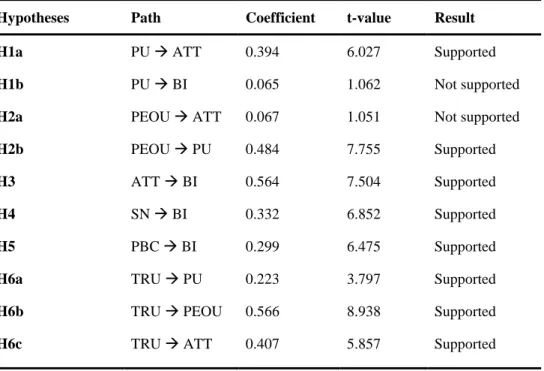
H3: Attitude positively influences the behavioral intention toward the adoption of m-commerce.
3.2.4. Subjective norms (SN)
Subjective norm suggests that behavior is instigated by one’s desire to act as the result of the referent people or group’s way of thinking about how he should act. In this particular model, subjective norm reflects the potential effect of the social circle of the customers in shaping the perception and inducing a positive m-commerce acceptance in their behavior. Some literature proposed a positive relationship between SN and the behavioral intention. Karahanna et al. (1999) also mentioned that empirical work has presented that subjective norm influences behavioral intention toward system use. Accordingly, SN is expected to have a positive influence toward intentions to adopt m-commerce.
H4: Subjective norms positively influences the behavioral intention toward the adoption of m-commerce.
3.2.5. Perceived behavioral control (PBC)
Perceived Behavioral Control is defined as oneself perception about the level of easiness in performing a particular behavior. In another word, Ajzen (1991) stated as to what extent something holds a person in carrying out a behavior. The concept is different to the attitude,
23 Ajzen theorized that PBC “should be read as perceived control over the performance of a
behavior” (2002b, p. 668). Ajzen’s statement indicated that PBC holds a subjective degree of control over the performance of behavior, and differentiated PBC from the similar perception regarding the actual behavior that will produce the desired outcome. Therefore, PBC is the consumer’s perceived ease or difficulty of getting a product or service from m-commerce channel in the context of this model. The support for the role of PBC on intention and behavior is provided by Mathieson (1991) and Taylor and Todd (1995b). Thus, this study suggests:
H5: Perceived behavioral control positively influences the behavioral intention toward the adoption of m-commerce.
3.2.6. Perceived trust (TRU)
Trust has long been a main prominent feature of economic and social interaction where uncertainty, a delegation of authority, and fears of opportunism are perceived (Luhmann 1979). The idea of trust came from the belief that the trustee will act accordingly to fulfill the trustor's expectations without exploiting its vulnerabilities. Several sources of research discussed the role of trust in e-commerce, such as Gefen et al. (2003), McKnight and Chervany (2002), and Pavlou (2003). Since e-commerce and m-commerce are related, the role of trust is also started to be applied in m-commerce as studied by Zarmpou et al. (2012).
Before putting it incorporated into the model, this study must define trust concerning a behavior through a well-specified target, action, context, and time frame (Ajzen 2002a). The target of trust is the m-commerce merchant, the action is the purchasing transaction of products or services, and the context is the online environment. Regarding the time frame, the implication of trust is only observable for a limited window, when the customers are deciding on purchase something. The statement is consistent with the trust literature where trust is concerning a specific trustor (Mayer et al. 1995), context (Lewicki and Bunker 1995), and time window (Tan and Thoen 2001).
24
Trusting beliefs and attitude
Initially, the concept of trust was given as an attitudinal belief for both getting information and purchasing in a commercial setting. Then, trust and the attitude draws the notion of perceived consequences (Hosmer, 1995). Trust empowers the positive expectations that no harmful or unfavorable outcomes will occur if a trustor undertakes a behavior (Barber 1983). In summary, trust creates favorable perceptions about the outcomes of the m-commerce transaction, thus creating favorable attitudes. Regarding transaction, trust creates positive expectations that the m-commerce merchant will fulfill its promise. Accordingly, these studies by Jarvenpaa et al. (2000), McKnight and Chervany (2002), and Pavlou (2003) show that trust has an impact on intentions by creating positive attitudes.
H6a: Trust indirectly influences the attitude toward the adoption of m-commerce through perceived usefulness.
H6b: Trust indirectly influences the attitude toward the adoption of m-commerce through perceived ease of use.
H6c: Trust directly influences the attitude toward the adoption of m-commerce.
In summary, Table 3 lists all hypotheses mentioned above in a concise form for all variables.
25
Table 3 The definitions of the research hypotheses
Hypotheses Description Path
H1a Perceived usefulness positively influences the attitude toward adoption of m-commerce.
PU ATT
H1b Perceived usefulness positively influences the behavioral intention toward adoption of m-commerce.
PU BI
H2a Perceived ease of use positively influences the attitude toward the adoption of m-commerce.
PEOU ATT
H2b Perceived ease of use positively influences the perceived usefulness
PEOU PU
H3 Attitude positively influences the behavioral intention toward the adoption of m-commerce
ATT BI
H4 Subjective norms positively influences the behavioral intention toward the adoption of m-commerce
SN BI
H5 Perceived behavioral control positively influences the behavioral intention toward the adoption of m-commerce
PBC BI
H6a Trust indirectly influences the attitude toward the adoption of m-commerce through perceived usefulness.
TRU PU
H6b Trust indirectly influences the attitude toward the adoption of m-commerce through perceived ease of use
TRU PEOU
H6c Trust positively influences the attitude toward the adoption of m-commerce
TRU ATT
3.3. Proposed Model
As previously explained in hypotheses development and literature review, this study adapted the constructs taken from Technology Acceptance Model and Theory of Plan Behavior model as displayed in Figure 10 below.
Figure 10 The proposed model
TPB TRU PEOU PU ATT SN BI PBC TAM
26
4. RESEARCH METHODOLOGY AND DATA
ANALYSIS
4.1. Research Methodology
4.1.1. Research design
This study used quantitative design and categorized within the type of correlational study, in which not only explain about particular phenomena but also based on theory as the fundamental aspect to analyze the correlation between variables. This study is one of formal study in which the researcher already set up a research question and is expected to be answered by the result of the study. The researcher does not do any intervention during the research. Therefore, this study is categorized as ex-post facto design. The timeline that is used in the study applies cross-sectional.
The study used primary data where the researcher questioned and collected the respond of the subject through a questionnaire consisting of several parts. Each part would represent for each construct and be measured through multiple item questions derived from previous studies. Since the questionnaire items were based on the derivative of the previous works, the pilot study was unnecessary to conduct.
4.1.2. Operational definition
Table 4 lists the operational definitions for the study instruments. There are five options Likert-like scale, ranging from 1 (Completely Disagree) to 5 (Completely Agree), to measure each item for every variable used in this research. Behavioral intention and perceived behavioral control both consisted of five items to be measured; Trust, attitude and subjective norms have three items; Perceived of usefulness and perceived ease of use both have six items.
27
Table 4 The operational definitions of the research variables
Research
variables Operational definition
Perceived Usefulness (PU)
PU1 : Using m-commerce would allow me to purchase goods and/or services more quickly
PU2 : Using m-commerce would increase my productivity
PU3 : Using m-commerce would enhance my effectiveness in purchasing goods and/or services
PU4 : Using m-commerce would improve my efficiency in purchasing goods and/or services
PU5 : Using m-commerce would make it easier to purchase goods and/or services PU6 : I would find m-commerce useful in purchasing goods and/or services
Perceived Ease of Use (PEOU)
PEOU1 : Learning how to use m-commerce would be easy for me
PEOU2 : I would find it easy to navigate m-commerce doing what I want it to do (e.g., looking product info)
PEOU3 : My interaction with m-commerce would be clear and understandable PEOU4 : I would find m-commerce to be flexible to interact with
PEOU5 : It would be easy for me to become skillful at using m-commerce PEOU6 : I would find m-commerce easy to use
Attitude (ATT)
ATT1 : Using m-commerce to purchase goods and/or services is a good idea
ATT2 : Using m-commerce to purchase goods and/or services is a wise idea (deleted) ATT3 : I like to use m-commerce to purchase goods and/or services
ATT4 : Using m-commerce to purchase goods and/or services would be a pleasant experience
ATT5 : I think these days; using m-commerce to purchase goods and/or services is a necessity (deleted)
ATT6 : Using m-commerce to purchase goods and/or services is convenient (deleted) ATT7 : Using m-commerce to purchase goods and/or services is interesting (deleted)
Subjective Norms (SN)
SN1 : People who are important to me think that I should use the m-commerce to purchase goods and/or services
SN2 : People whose opinion I value prefer me to use the m-commerce to purchase goods and/or services
SN3 : People who are important to me would think that I should use the m-commerce to purchase goods and/or services
Perceived Behavioral Control (PBC)
PBC1 : I am capable of using m-commerce
PBC2 : Nothing withholds me from using m-commerce PBC3 : Using m-commerce is entirely within my control
PBC4 : I have the resources to purchase products and/or services using m-commerce PBC5 : I have the knowledge to use m-commerce for shopping
Behavioral Intention (BI)
BI1 : I intend to use m-commerce in the near future
BI2 : I believe my interest towards m-commerce will increase in the future BI3 : I intend to use m-commerce as much as possible
BI4 : I will recommend others to use m-commerce
BI5 : If given a chance, I will use m-commerce to purchase goods and/or services
Trust (TRU) TRU1 : Using mobile payment for monetary transaction in m-commerce is safe TRU2 : My personal data are in confidence while using m-commerce
TRU3 : The terms of use are strictly followed while I am using m-commerce (deleted) TRU4 : Using m-commerce to purchase goods and/or services is trustworthy
28 4.1.3. Data collection and sample characteristics
Data were gathered through electronic questionnaire spread through online such as links in social media, messaging apps and email. The online approach was chosen because it is considered to suit the m-commerce characteristic well. The participants are considered as well-being who aware of the use of internet and smartphone. The collection period of the data was in March 2017 and successfully got 391 participants. However, seven of the participants were rejected due to the consideration of being outlier data according to the data analysis, leaving 384 final respondents.
Table 5 Demographic characteristics
Characteristic Frequency Percent (%)
Gender Male Female 144 240 37.5 62.5 Age 18 – 24 25 – 30 31 – 35 >35 125 178 42 39 32.6 46.4 10.9 10.2 M-commerce experience
I have used m-commerce once I never used m-commerce, but I used e-commerce
I never purchased online
324 52 8 84.4 13.5 2.1
Internet experience Less than 1 year 1 to less than 5 years 5 to less than 10 years 10 years or more 7 41 175 161 1.8 10.7 45.6 41.9 Having experience with mobile phone
Less than 1 year 1 to less than 5 years 5 to less than 10 years 10 years or more 4 19 134 227 1.0 4.9 34.9 59.1
Table 5 portrayed the profile of participants in this study. Among the respondents, 240 feedbacks came from female (62.5%), and the rest of them (144; 37.5%) came from male counterparts. Regarding age, the majority is the age group 25-30 years old by 46.4%, followed by 18-24 years old (32.6%), 31-35 years old (10.9%), and for the last is the age
29 group >35 years old (10.2%). Almost all participants (84.4%) already had experience of using m-commerce before, then 13.5% claimed to be familiar with e-commerce but never tries m-commerce, and only 2.1% said never use any form of e-commerce. The majority of respondents are already familiar with mobile phone and internet.
4.2. Data Analysis and results
4.2.1. Measurement model
The measurement model used a pooled Confirmatory Factor Analysis (CFA) to determine the variables logically and systematically able to represent the construct involved in the hypothesized model. There are 31 items to determine seven latent constructs: Trust (TRU), Perceived Usefulness (PU), Perceived Ease of Use (PEOU), Attitude (ATT), Subjective Norms (SN), Perceived Behavioral Control (PBC) and Behavioral Intention (BI).
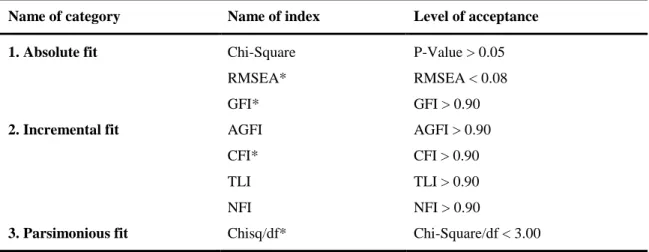
In SEM, there is the need to evaluate the fitness indexes of a measurement model. The purpose is to determine how the model matched to the acquired data. Nonetheless, there are no exact rules to follow because the researchers have several opinions. The suggestion said that at least fulfilling one index from each model fit category would be considered enough (Hair et al.,1995; Holmes-Smith, 2006). Table 6 showed a list of the recommended model fit index according to Awang (2012). The available model fit categories are Parsimonious Fit, Incremental Fit, and Absolute Fit.
Table 7 showed the goodness-of-fit calculation of the model from the pooled CFA measurement. According to the result, the model managed to reach or close to the recommended score, so it is acceptable. Next, the model must follow the evaluation process in terms of reliability and validity.
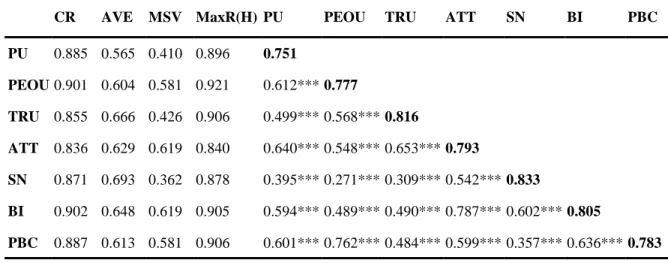
The validity of measurement models requires three aspects: convergent validity, construct validity, and discriminant validity (Awang, 2012). According to Table 8, the AVE scores of each construct exceed 0.50, and the numbers passed the convergent validity. The construct validity is achieved when the goodness-of-fit indexes show an acceptable number. The discriminant validity could be seen in Table 8 by the square root of AVE for
30 each construct, which must be higher than the correlation between the corresponding constructs.
Similarly, the reliability test consists of two crucial notes: average variance extracted and composite reliability (Awang, 2012). As mentioned previously, the AVE scores passed 0.50 recommended value. The numbers indicated that the measurement model is reliable in determining the construct. The composite reliability could be seen in CR values in Table 8. The higher than 0.60 value means that it meets the requirement of composite reliability.
Table 6 The three categories of model fit and the recommended level of acceptance
Name of category Name of index Level of acceptance
1. Absolute fit Chi-Square P-Value > 0.05
RMSEA* RMSEA < 0.08 GFI* GFI > 0.90
2. Incremental fit AGFI AGFI > 0.90
CFI* CFI > 0.90 TLI TLI > 0.90 NFI NFI > 0.90
3. Parsimonious fit Chisq/df* Chi-Square/df < 3.00
*The recommended index frequently reported in literature (Source: Awang, 2012)
Table 7 The model fit indices
Fit indices Recommended value Measurement model Structural model
CMIN/DF ≤ 3.00 2.090 2.998 NFI ≥ 0.90 0.898 0.849 CFI ≥ 0.90 0.944 0.894 GFI ≥ 0.90 0.877 0.835 AGFI ≥ 0.80 0.850 0.805 RMSEA ≤ 0.08 0.053 0.072
31
Table 8 Model validity and reliability measures
CR AVE MSV MaxR(H) PU PEOU TRU ATT SN BI PBC
PU 0.885 0.565 0.410 0.896 0.751 PEOU 0.901 0.604 0.581 0.921 0.612*** 0.777 TRU 0.855 0.666 0.426 0.906 0.499*** 0.568*** 0.816 ATT 0.836 0.629 0.619 0.840 0.640*** 0.548*** 0.653*** 0.793 SN 0.871 0.693 0.362 0.878 0.395*** 0.271*** 0.309*** 0.542*** 0.833 BI 0.902 0.648 0.619 0.905 0.594*** 0.489*** 0.490*** 0.787*** 0.602*** 0.805 PBC 0.887 0.613 0.581 0.906 0.601*** 0.762*** 0.484*** 0.599*** 0.357*** 0.636*** 0.783 Significance of Correlations: † p < 0.100 * p < 0.050 ** p < 0.010 *** p < 0.001
Table 9 displayed the scores for the standardized factor loadings. Five items were deleted during the unidimensionality to achieve the acceptable goodness-of-fit indexes based on the modification indices: ATT2, ATT5, ATT6, ATT7, and TRU3. The recommendation stated that the R-squared per item should be more than 0.50. However, due to the constraint in a limited number of item per construct and the goodness-of-fit indexes were already met, then the five deleted items were considered enough. The rest of the items have passed the minimum allowance 0.50, and even they showed an excellent characteristic which is close to or more significant than 0.7.
32
Table 9 Standardized factor loadings and R-squared per item
Item Factor Loading R2 (>0.5)
PU1 0.686 0.470 PU2 0.652 0.425 PU3 0.831 0.691 PU4 0.832 0.692 PU5 0.724 0.524 PU6 0.765 0.585 PEOU1 0.738 0.545 PEOU2 0.708 0.501 PEOU3 0.713 0.509 PEOU4 0.705 0.498 PEOU5 0.877 0.770 PEOU6 0.896 0.803 ATT1 0.753 0.567 ATT2 (deleted) - - ATT3 0.795 0.632 ATT4 0.814 0.689 ATT5 (deleted) - - ATT6 (deleted) - - ATT7 (deleted) - - SN1 0.792 0.627 SN2 0.880 0.775 SN3 0.824 0.679 PBC1 0.771 0.594 PBC2 0.674 0.455 PBC3 0.720 0.519 PBC4 0.840 0.705 PBC5 0.891 0.794 BI1 0.801 0.642 BI2 0.823 0.678 BI3 0.816 0.666 BI4 0.845 0.714 BI5 0.735 0.540 TRU1 0.934 0.872 TRU2 0.681 0.464 TRU3 (deleted) - - TRU4 0.814 0.663