______________________________________________________________________________________________________
Article
________________________________________________________________________________________________
Ciências Ambientais Environmental Sciences
Koppen-Geiger and Thornthwaite climatic classification
for the metropolitan region of the Cariri, Ceará
Mirelle T. V. Lima1, Ana C. M. Meireles2 Carlos W. de Oliveira3 & Maria T. B. do Nascimento4
* Corresponding Author: [email protected] Received: Juner 2, 2017 Todos autores contribuíram de forma igualitária Accepted: June 21, 2017
Published: July, 2017
ABSTRACT
The aim of the present work was to compare the Koppen-Geiger and Thornthwaite methods for Climatic Classification of the Metropolitan Region of Cariri, state of Ceará, Brazil. The study area comprises the nine municipalities in the metropolitan region of the Cariri, being Juazeiro de Norte, Crato, Barbalha, Caririaçu, Farias Brito, Missão Velha, Nova Olinda, Jardim and Santana do Cariri. The temperature and rainfall data for the metropolitan region of the Cariri were submitted to Koppen-Geiger and Thornthwait classification, in order to compare the results. All weather data on precipitation and monthly temperature comes from the Data-Climate website, which provides world-class weather data for cities. There is a paucity of information about the climatic temperature and humidity normal in all cities, since not all have rain stations and data published by official institutions. This makes it difficult for public planning for the application of resources, the need for technical assistance and the implementation of technologies for water abstraction, as well as for research. The Köppen-Geiser climate classification is simpler to employ, however, the Thornthwaite classification has a more detailed result on the site. According to the Koppen-Geiser classification, the nine municipalities present in the metropolitan region of the Cariri are classified as Aw savanna climate. For Thornthwait, they can be classified generally as B1, B3 and C2, around humid to moist subhumid.
Keywords: Climatology, Semiarid, Geoprocessing.
Introduction
The knowledge of climate classification systems is of great importance in the analysis and definition of the climates of different regions, as, considering different climatic elements at the same time, it allows to optimize the exchange of information and analyzes for different purposes, from the natural and human sciences and to health, crossing climate information and endemics, for example.
The criteria used in the main classification’s systems vary between precipitation, temperature, vegetation and air masses, either as independent variables or as different combinations. In 1900, Köppen began to recognize major vegetation groups and then he studied the climatic conditions in which each group developed, so that this information could be used to define the climatic boundaries between the main vegetation groups equivalent to the main ones Climate types. The proposed method was later updated by Rudolf
Geiger in 1961 (KOTTEK et al., 2006). The climatic classification of Köppen-Geiger is thus based on the assumption that the natural vegetation of each large region of the Earth is essentially an expression of the prevailing climate. In the determination of the climatic types, the seasonal and the annual and monthly average values of the air temperature and the precipitation were considered.
Following the classification of Köppen-Geiger, it comes to the classification of Thornthwaite, between 1931 and 1933, which employed evapotranspiration and precipitation factors (BARRY, 2009). In this classification the plant is not seen as an instrument of integration of the climatic elements, but rather as simply a physical medium through which it is possible to transport water from the soil to the atmosphere. Thus, a climate type is defined as dry or wet related to the water needs of the plants, that is, dependent on a water balance, being considered a more refined method than that of Köppen for agricultural applications (TREWARTHA, 1954 apud NOBREGA, 2010 ).
On the other hand, the potential evapotranspiration (ETP) used in this classification is generally estimated only by the temperature due to the lack of availability of other meteorological elements. Thornthwaite compared potential evapotranspiration to precipitation in various regions of the planet to obtain moisture indices, since excess or water deficiency occurs in several locations and at different seasons. From there, a new global climate classification based on concepts of potential evapotranspiration through water balance (THORNTHWAITE, 1944, 1946, 1948) was proposed.
In addition to the meteorological elements, some factors are responsible for promoting the great climatic variability existing in the world, such as latitude, altitude, geographical exposure and continentality. For instance, Latitude, whereas the distance to the equator (north or south) increases, there are warm, temperate and cold climates, respectively. However, at local and regional scale, other factors may impose sharp variations in precipitation and temperature (Sampaio, 2011).
Brazil is generalized as a tropical climate country, mainly because it is located in the region with the highest luminosity of the sky (tropical zone), together with the high temperature and rainfall indexes (MENDONÇA & DANNI-OLIVEIRA, 2017). Its great climatic diversity attributed among several factors its geographical physiognomy, the territorial
extension, the relief and the dynamics of the air masses. In the Brazilian Northeast, the rainfall regime is characterized by its great variability in time and space, while the temperature suffers few variations throughout the year. The Cariri region, located in the extreme south of the state of Ceará, despite being geographically inserted in the drought polygon at the Brazilian Northeast and presenting rainfall variations over time and space, constitutes an escape from this arid climate and predominant water scarcity, often called "oasis of the sertão". Therefore, the objective of this work was to compare the Koppen-Geiger and Thornthwaite methods for climatic classification of the metropolitan region of the Cariri, Ceará.
Material and Methods
Study Area
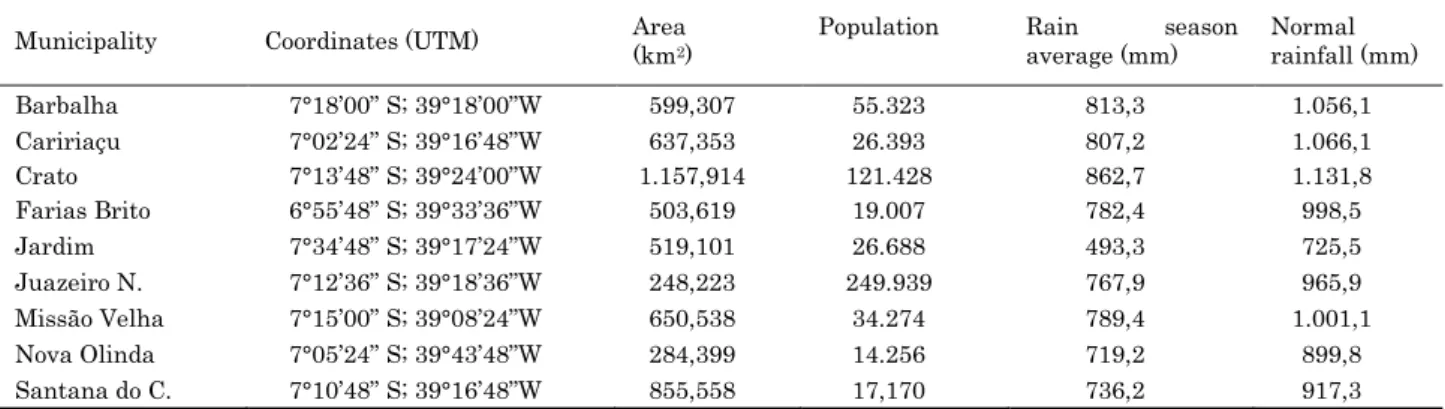
The study area comprises the nine municipalities of the metropolitan region of the Cariri, Ceará, being Juazeiro de Norte, Crato, Barbalha, Caririaçu, Farias Brito, Missão Velha, Nova Olinda, Jardim and Santana do Cariri (Figure 2, Table 1).
Table 1 - Characteristics of the area, location in coordinates, area and population of the municipality, rainfall season average and normal rainfall (from 1961 to 1990) of municipalities in the metropolitan region of Cariri Ceará (MRC).
Municipality Coordinates (UTM) Area (km2) Population Rain average (mm) season Normal rainfall (mm)
Barbalha 7°18’00” S; 39°18’00”W 599,307 55.323 813,3 1.056,1 Caririaçu 7°02’24” S; 39°16’48”W 637,353 26.393 807,2 1.066,1 Crato 7°13’48” S; 39°24’00”W 1.157,914 121.428 862,7 1.131,8 Farias Brito 6°55’48” S; 39°33’36”W 503,619 19.007 782,4 998,5 Jardim 7°34’48” S; 39°17’24”W 519,101 26.688 493,3 725,5 Juazeiro N. 7°12’36” S; 39°18’36”W 248,223 249.939 767,9 965,9 Missão Velha 7°15’00” S; 39°08’24”W 650,538 34.274 789,4 1.001,1 Nova Olinda 7°05’24” S; 39°43’48”W 284,399 14.256 719,2 899,8 Santana do C. 7°10’48” S; 39°16’48”W 855,558 17,170 736,2 917,3
Source: Carvalho, 2013; IBGE, 2013.
The metropolitan region is in the extreme south of Ceará and presents a marked urban development, taking a prominent position in the State. It covers an approximate area of 5,456 km2, a population of about 547,325 inhabitants. Rainy season concentrated in the first months of the year, drier period in the last months of the year and with mean values of precipitation higher than those published by CPTEC / INPE (2017) for the northeastern Brazilian region, which corresponds to an accumulated rainfall of less than 500 mm / year.
The region of the Cariri is inserted in the semiarid region of the Brazilian northeast, however, they have peculiarities in the vegetation in relation to the surrounding areas. There are remnants of Atlantic forest, present in abundance in the Araripe National Forest (FLONA) and higher humidity promoted by the "Cariri depression" (Figure 3), mainly in the municipalities of Crato, Juazeiro do Norte and Barbalha (BRANDÃO, 2014).
Figure 3. View of the Chapada do Araripe on its north-northeast flank, emphasizing a Cariri Depression. Road CE-494. Around the city of Crato. Source: Brandrão, 2014.
Climate classification Koppen-Geiger
The climatic classification by KOPPEN-GEIGER (1936) divides climates into 5 large groups ("A", "B", "C", "D", "E") and various types and subtypes. Each climate is represented by a variable set of letters (with 2 or 3 characters) with the following meaning: the first letter (upper case), Fundamental Zone or Group, denotes the general characteristic of the climate of a region. It is determined by the
temperature of the hottest and coldest months and by the water balance. In this way, the climatic group can be classified as: tropical climate, arid climate, temperate climate or hot temperate climate or subtropical climate, continental climate or cold temperate climate, glacial climate.
The second letter (lowercase) establishes the type of climate within the group, and denotes the particularities of the pluviometric regime, i.e. the amount and distribution of precipitation (only used if the first letter is "A", "C" or "D"). In groups whose first letter is either "B" or "E", the second letter is also a capital letter, denoting the amount of total annual precipitation (in case "B") or the average annual air temperature (in case "E"); The classification Steppes and Deserts and the monsoon climate is specific to zone A. Groups A, C and D are considered humid climates; B, dry and E, polar.
There may be a third letter (lower case), denoting the average monthly air temperature of the warmer months (in cases where the first letter is "C" or "D") or the average annual air temperature (in the case of the first letter Be "B"). It is used to distinguish climates with different air temperature variations, with subtypes being defined for climates of groups B, C and D. The codes for the third letter are: "a", "b", "c", "D", "h" and "k", respectively, can be classified as hot summer, summer temperate, summer short and cool, winter very cold, temperature varies regularly dry and hot dry and cold.
The climatic classification of Köppen is based on average annual and monthly values of temperature and precipitation, and the native vegetation is used to determine the climatological limits of its classification, which presents five major climates represented by the letters A, B, C, D and E. Each climate is characterized in more detail and receives two or three small letters of the alphabet.
To facilitate classification, Viana et al. (1997) developed an algorithm that shows orderly the steps for the qualification of the different groups, types, and climatic varieties that compose the classification of Köppen.
Climate classification of Thornthwaite (Ometto, 1981)
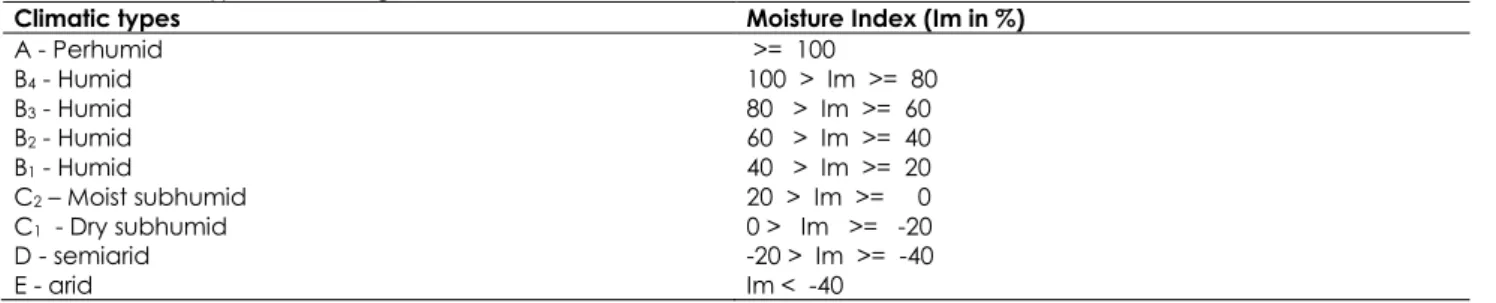
The climatic classification of Thornthwaite is based on several climatic indexes, such as humidity (Iu), aridity (Ia), moisture (Im) and annual ETP (PE) and seasonal variations. This method determines a formula, consisting of four uppercase and / or lowercase letters, to identify the climate of a region. There are nine major climatic types classified according to the Moisture Index value proposed by Thornthwaite, which are: A (Perhumid); B4 (Humid); B3 (Humid); B2 (Humid); B1 (Humid); C2 (Moist subhumid); C1 (Dry subhumid); D (Semiarid) and E (Arid). The climatic type referring to the seasonal variation of the water deficit or excess is initially dependent on the value of the moisture index.
The climatic indexes take into account the potential evapotranspiration according to Thornthwaite (1948) and the climatological balance according to the Thornthwaite-Mather method (1955), assuming the available water capacity (AWC) of the soil equal to 100 mm. In this way, the climatological water balance is initially calculated, then the indices are determined and then the classification key is entered. The analyzed sites are classified according to the climate through a formula composed basically of four uppercase and / or lowercase letters. As an example, Quixadá, DWA'a ', semiarid climate, with small water excess in the summer, megathermal, with ETP well distributed throughout the year (VIANA et al., 1997).
The Aridity index (Ia) depicts the water deficit (DEF) expressed as a percentage of ETP, expressed by the following formula:
𝐼𝑎 = 100 𝑥 𝐷𝐸𝐹 𝐸𝑇𝑃
The humidity content represents the excess water (EXC) expressed as a percentage of the need which is represented in turn by potential evapotranspiration (ETP).
𝐼𝑢 = 100 𝑥 𝐸𝑋𝐶 𝐸𝑇𝑃
As for the moisture index (Im), as in most cases, we have seasons with excess or water deficiency during the year, Thornthwaite expressed the moisture index for the year as follows:
Im = (Iu - 0,6 x Ia)
The following Tables (2, 3, 4 and 5) are presented to allow the Thornthwaite climatic classification, which contains the classification keys. According to the value of the Im are classified nine climatic types (Table 2).
Table 2 - Climatic types according to Thornthwaite.
Climatic types Moisture Index (Im in %)
A - Perhumid >= 100 B4 - Humid 100 > Im >= 80 B3 - Humid 80 > Im >= 60 B2 - Humid 60 > Im >= 40 B1 - Humid 40 > Im >= 20 C2 – Moist subhumid 20 > Im >= 0 C1 - Dry subhumid 0 > Im >= -20 D - semiarid -20 > Im >= -40 E - arid Im < -40
Table 3 - Climate classification key according to Thornthwaite, based on aridity index.
Climatic type Aridity index (Ia)
r - small or no water deficiency 0 < Ia <= 16,7 S - moderate deficiency in summer 16,7 < Ia <= 33,3 W - moderate winter deficiency 16,7 < Ia <= 33,3
S2 - major deficiency in summer Ia > 33,3
W2 - major deficiency in winter Ia> 33.3
Climatic type Humidity index (Iu)
r - small or no water excess 0 < Iu <= 10,0 S - Moderate excess in winter 10,0 < Iu <= 20,0
W - moderate summer excess 10,0 < Iu <= 20,0
S2 - major excess in winter Iu > 20,0
W2 - major excess in summer Iu > 20,0
Table 4 - Thornthwaite classification key, based on annual ETP.
Thermal province Annual ETP (PE, in mm)
E’ - Frost TE < 142,0 D’ - Tundra 142,0 <= PE < 285,0 C’1 - Microthermal 285,0 <= PE < 427,0 C’2 - Microthermal 427,0 <= PE < 570,0 B’1 - Mesothermal 570,0 <= PE < 712,0 B’2 - Mesothermal 712,0 <= PE < 855,0 B’3 - Mesothermal 855,0 <= PE < 997,0 B’4 - Mesothermal 997,0 <= PE < 1140,0 A’ – Megathermal PE >= 1140,0
Table 5 - Climatic sub-classes based on summer concentration of annual ETP (PE).
Sub-tipo climático Summer Concentration of PE (%)
a’ S.C. < 48,0 b’4 48,0 <= S.C. < 51,9 b’3 51,9 <= S.C. < 56,3 b’2 56,3 <= S.C. < 61,6 b’1 61,6 <= S.C. < 68,0 c’2 68,0 <= S.C. < 76,3 c’1 76,3 <= S.C. < 88,0 d’ S.C. >= 88,0
The classification is based on the assumption that all-natural vegetation in the world is a product or an expression of the existing climate. Thus, the boundaries between climatic regions were selected to correspond, as far as possible, to the areas of predominance of each type of vegetation, which is why the global distribution of climate types and the distribution of biomes present a high correlation.
Climatology constitutes the study of climate and treats "the atmospheric patterns of atmospheric behavior in its interactions with human activities and with the surface of the planet over a long period of time" (MENDONÇA & DANNI-OLIVEIRA, 2017). Obtaining Data
All weather data on precipitation and temperature comes from the Data-Climate website, which provides world climate data for cities, which in turn comes from a climate model, which has more than 220 million data points and a resolution of 30 Seconds arc. The model uses weather data from thousands of weather stations around the world. These meteorological data were collected between 1982 and 2012 (30 years).
Due to the scarcity of information about climate and temperature normologies for all cities studied, since not all of them have rainfall stations and / or
data published by official institutions, they used the data from Climate-Data, which is based on data from the OpenStreetMap project, which are updated regularly to quickly reflect any changes to the project data. This scarcity of data makes it difficult for public planning for resource application, technical assistance and deployment of technologies for water abstraction, as well as for research.
The temperature and rainfall data of the metropolitan region of the Cariri region of Ceará were submitted to Koppen-Geiger and Thornthwaite classification, to compare the results.
Results and Discussion
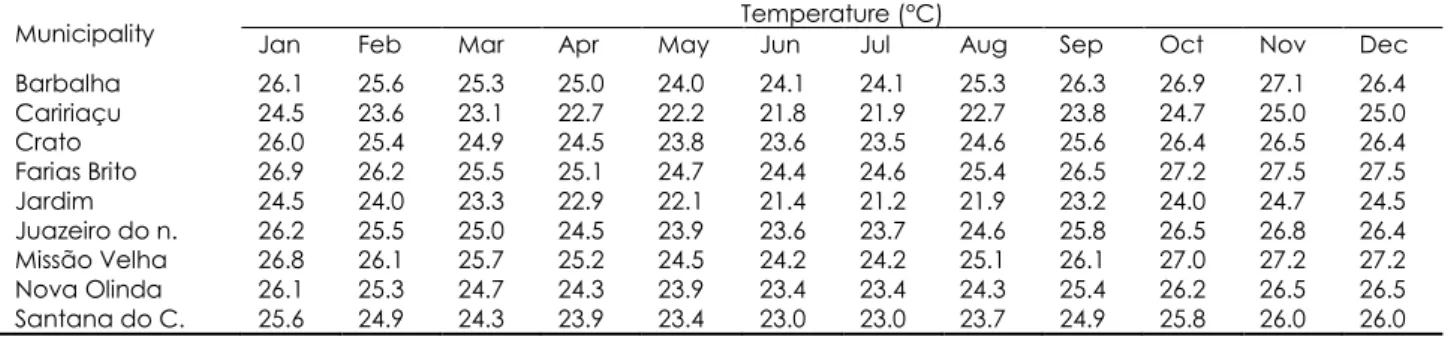
The main elements used in the classification systems and available for the study region, temperature and precipitation, are shown in Tables 6 and 7.
Table 6 - Average monthly temperature, in degrees centigrade for the municipalities of the Metropolitan Region of Cariri, Ceará.
Municipality Jan Feb Mar Apr May Temperature (°C) Jun Jul Aug Sep Oct Nov Dec
Barbalha 26.1 25.6 25.3 25.0 24.0 24.1 24.1 25.3 26.3 26.9 27.1 26.4 Caririaçu 24.5 23.6 23.1 22.7 22.2 21.8 21.9 22.7 23.8 24.7 25.0 25.0 Crato 26.0 25.4 24.9 24.5 23.8 23.6 23.5 24.6 25.6 26.4 26.5 26.4 Farias Brito 26.9 26.2 25.5 25.1 24.7 24.4 24.6 25.4 26.5 27.2 27.5 27.5 Jardim 24.5 24.0 23.3 22.9 22.1 21.4 21.2 21.9 23.2 24.0 24.7 24.5 Juazeiro do n. 26.2 25.5 25.0 24.5 23.9 23.6 23.7 24.6 25.8 26.5 26.8 26.4 Missão Velha 26.8 26.1 25.7 25.2 24.5 24.2 24.2 25.1 26.1 27.0 27.2 27.2 Nova Olinda 26.1 25.3 24.7 24.3 23.9 23.4 23.4 24.3 25.4 26.2 26.5 26.5 Santana do C. 25.6 24.9 24.3 23.9 23.4 23.0 23.0 23.7 24.9 25.8 26.0 26.0 Table 7 - Average monthly precipitation in centimeters for the municipalities of the Metropolitan Region of Cariri, Ceará.
Municipality PRECIPITATION (cm)
Jan Feb Mar Apr May Jun Jul Aug Sep Oct Nov Dec
Barbalha 16.6 21 23.9 18.7 5.1 2.6 1.2 0.6 0.6 2.3 4.4 8.8 Caririaçu 16.6 24.1 27.1 22.2 7.0 3.4 2.0 1.1 1.1 2.5 4.2 8.5 Crato 17.3 20.9 24.1 20.1 5.7 2.7 1.0 0.6 0.6 2.4 4.4 8.8 Farias Brito 12.2 16.2 21.4 15.6 4.7 1.4 0.5 0.4 0.5 1.3 2 5.8 Jardim 10.7 14.5 19.7 14.5 5.5 3.8 2.6 0.6 0.7 1.8 2.9 6.6 Juazeiro 18.0 22.0 25.2 20.1 6.2 3.0 1.2 0.7 0.6 2.7 4.5 9.1 Missão Velha 12.6 19.7 24.8 16.5 4.3 2.2 0.9 0.4 0.6 1.9 3.7 6.6 Nova Olinda 14.2 16.8 22.1 19 5.2 2.0 0.9 0.4 0.6 1.8 3.4 6.6 Santana do C. 13.6 16.5 21.8 18.7 5.7 2.4 1.1 0.4 0.6 1.9 3.7 6.5
The average temperature recorded among municipalities is 24.85 ° C throughout the year, varying between 21.4 ° C and 27.5 ° C. Precipitation is concentrated between the
months of January and April, with August being the driest month.
After subjecting the Köppen key, the entire metropolitan region was classified according to Table 8.
Table 8 - Annual Total Precipitation (P), Mean Annual Temperature (T), Rainy Season, Dry Season and Koppen-Geiser classification for municipalities in the Metropolitan Region of Cariri, Ceará.
Municipality P (cm) (°C) Rainy season Dry season Classification
Barbalha 105.80 25.52 Summer Winter Aw
Caririaçu 119.80 23.42 Summer Winter Aw
Crato 108.60 25.10 Summer Winter Aw
Farias Brito 82.00 25.96 Summer Winter Aw
Jardim 83.90 23.14 Summer Winter Aw
Juazeiro do N. 113.30 25.21 Summer Winter Aw
Missão Velha 94.20 25.78 Summer Winter Aw
Nova Olinda 93.00 25.00 Summer Winter Aw
Santana do C. 92.90 24.54 Summer Winter Aw
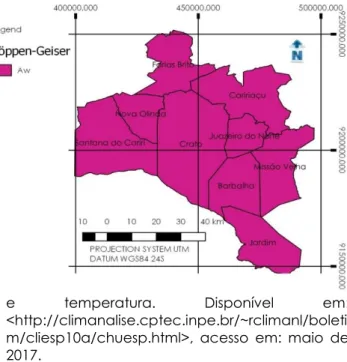
The results show that the entire region was classified as Aw. This climate is called the tropical climate with dry season, also known as savannah climate, is the name given to megathermal climates (group A in the classification key of Köppen), where every month of the year have average monthly temperature higher than 18 ° C, but at least one of the months of the year has a mean total rainfall of less than 60 mm.
The typical biome of the regions with this type of climates is the savanna, according to Köppen,
that is equivalent to the Caatinga biome (white and open forest in Tupi-Guarani), that is a tropical esthetic savannah with desert physiognomy. This result corroborates those provided by the Climate-Date website.
Then, the same data for the same region were submitted to Thornthwaite classification. However, to perform the steps in this classification, it is necessary to perform the water balance for each locality (Table 9).
Table 9. Water balance for municipalities in the Metropolitan Region of Cariri, Ceará.
Municipality PREC. ETP P - ETP ETR DEFIC. EXC.
Barbalha 1699 1465.5 233.5 1248.15 217.35 450.85 Caririaçu 1935 1183.58 751.42 1075.59 107.99 859.41 Crato 1748 1399.91 348.09 1208.1 191.82 539.9 Farias Brito 1378 1545.56 -167.56 1288.05 257.51 89.95 Jardim 1313 1154.61 158.39 1131.99 22.62 158.39 Juazeiro do norte 1817 1417.41 399.59 1233.69 183.72 183.72 Missão Velha 1550 1511.96 38.04 1347.61 164.35 202.39 Nova Olinda 1527 1385.93 141.07 1184.89 201.05 342.11 Santana do C. 1508 1319.95 188.05 1145.74 174.2 362.26
The water balance data are used in calculations of the moisture, dryness and thermal
efficiency indexes, which are shown in table 10 below.
Table 10. Effective moisture content (Im), Aridity index (Ia), Humidity index (Iu), (Annual ETP, PE, mm), Summer concentration of PE (PE,%) and According to Thornthwaite, for the municipalities of the Metropolitan Region of Cariri, Ceará.
Municipality Im (%) Ia Iu PE (mm) PE (%) Classification
Barbalha 30.76 30.76 12.31 1465.50 0.352 B1 W W A’ a’
Caririaçu 72.61 9.12 67.14 1183.58 0.364 B3 r W2 A’ a’
Crato 38.57 13.70 30.35 1399.91 0.363 B1 r W2 A’ a’
Farias Brito 5.82 16.66 -4.18 1545.56 0.364 C2 r r A’ a’
Jardim 13.72 1.96 12.54 1154.61 0.375 C2 r W A’ a’
Juazeiro do N. 41.15 12.96 33.38 1417.41 0.362 B2 r W2 A’ a’
Missão Velha 13.39 10.87 6.86 1511.96 2.888 C2 r r A’ a’
Nova Olinda 24.68 14.51 15.98 1385.93 3.688 B1 r W A’ a’
Figure 4. Comparative map between the Köppen-Geiser and Thornthwaite classification for the metropolitan region of the Cariri region of Ceará.
Only the municipalities Nova Olinda and Santana do Cariri (B1 r W A 'a') and Farias Brito and Missão Velha (C2 r r A 'a') are classified in a similar way. In contrast to the Köppen classification, that characterized the region in a homogeneous way.
For Peel (2007), the Köppen classification system, developed more than 100 years ago, continues to be widely used today. According to Vianello & Alves (2000), this is a didactic classification, flexible and versatile, at the same time simple.
For Mendonça and Danni-Oliveira (2017), a good climatic classification should be based on meteorological data series from different locations, which facilitates the mapping, as well as making it possible to synthesize and group similar climatic elements into classes or climatic types.
Conclusions
According to the Koppen-Geiser classification, the nine municipalities present in the metropolitan region of the Cariri region of Ceará are classified as Aw savanna climate. For Thornthwaite, they can be generally classified as B1, B3 and C2, around humid to moist subhumid.
The use of geographic information systems (GIS) helps to visualize the classification system.
References
BARRY, R. G.; CHORLEY, R. J. Atmosfera, tempo e clima. Bookman Editora, 2009.
BRANDÃO, R. L. Geodiversidade do estado do Ceará. Fortaleza: CPRM, 2014. 214 p.
CAVALCANTI, I. F. A. Tempo e clima no Brasil. Oficina de textos, 2016.
CPTEC/INPE – Centro de Previsão de Tempo e Estudos Climáticos. Climatologia de precipitação
e temperatura. Disponível em:
<http://climanalise.cptec.inpe.br/~rclimanl/boleti m/cliesp10a/chuesp.html>, acesso em: maio de 2017.
CUNHA, A. R. da; MARTINS, D. Classificação climática para os municípios de botucatu e são manuel sp. Irriga, Botucatu, v.14, n.1, p. 1-11, 2011. KÖPPEN, W. Das geographisca System der Klimate.
Gebr, Borntraeger, 1936. p.1-44.
MENDONÇA, F.; DANNI-OLIVEIRA, I. M. Climatologia: noções básicas e climas do Brasil. Oficina de textos, 2017.
NÓBREGA, R. S. Um pensamento crítico sobre classificações climáticas de Köppen até Strahler. Revista Brasileira de Geografia Física, n.3, p 18-22, 2010.
OMETTO, J.C. Bioclimatologia vegetal. São Paulo: Agronômica Ceres, 1981. 440p.
PEEL, M. C.; Finlayson, B. L.; McMahon, T. A. Updated world map of the Koppen-Geiger climate classification. Hydrol. Earth Syst. Sci., n.11, p.1633– 1644, 2007.
ROLIM, G. S.; CAMARGO, M. B. P. de; LANIA, D. G.; MORAES, J. F. L. de. Classificação climática de köppen e de Thornthwaite e sua aplicabilidade na determinação de zonas agroclimáticas para o estado de São Paulo. Bragantia, Campinas, v.66, n.4, p.711-720, 2007.
SAMPAIO, M. S.; ALVES, M. C.; CARVALHO, L. G. de; SANCHES, L. Uso de Sistema de Informação Geográfica para comparar a classificação climática de Koppen-Geiger e de Thornthwaite. Anais... XV Simpósio Brasileiro de Sensoriamento Remoto - SBSR, Curitiba, PR, Brasil, INPE p.8858, 2011.
THORNTHWAITE, C.W. Problems in the classification of climates, Geogr. Rev., v.33, p. 233-255. 1948. VIANELLO, R. L., ALVES, A. R. Meteorologia básica e
aplicações. Viçosa, UFV Imprensa Universitária, 449p, 2000.
VIANA, T.V.A.; BASTOS, E.A.; ALVES, D.R.B.; FOLEGATTI, M.V. Algoritmo de classificação de Koppen. In: Congresso Brasileiro de Agrometeorologia, 10, 1997, Piracicaba-SP. Anais... Piracicaba: Sociedade Brasileira Agrometeorologia, 1997. p.255-257.