Orientador de Dissertação
PROF. DOUTORA LEONOR GALHARDO
Coordenador de Seminário de Dissertação PROF. DOUTOR EMANUEL GONÇALVES
Tese submetida como requisito parcial para a obtenção do grau de
MESTRE EM PSICOBIOLOGIA 2015 BEHAVIOURAL DIFFERENCES IN MOZAMBIQUE TILAPIA (OREOCHROMIS MOSSAMBICUS) VANDA MARNOTO
2 Dissertação de Mestrado realizada sob a orientação da Prof. Doutora Leonor Galhardo, apresentada no ISPA – Instituto Universitário para a obtenção de grau de Mestre na especialidade de Psicobiologia
3
Agradecimentos
Esta tese, assim como todo o curso de mestrado, não teria sido possível sem o incondicional apoio dos meus pais, pelo que o meu primeiro agradecimento é-lhes claramente dirigido, assim como à minha família. De formas distintas, todos contribuíram de forma direta e indireta para a realização deste percurso que se revelou tão trabalhoso quanto estimulante e prazeroso. Ao meu filho, que acompanhou de perto todo o processo de forma paciente e divertida, sempre cheio de curiosidade e compreensão e ao meu irmão, que sempre me soube quando era necessário animar-me, fica o meu total afeto.
À Prof. Leonor Galhardo, sobre quem tantas vezes refiro como alguém “que quero ser quando crescer”, um gigante obrigado. Foi cativante e imensamente fortalecedor aprender com a Leonor que, independentemente das suas ocupações e resoluções profissionais e pessoais, sempre se revelou presente. A sua capacidade de exposição, aliada a uma liderança inabalável e a uma paciência infindável, estreitamente acompanhadas por um carinho implícito, fizeram de mim uma afortunada orientanda. Um abraço muito apertado, cheio de admiração e carinho!
Gostaria de agradecer ao Prof. Emanuel Gonçalves que, como professor exemplar que todos reconhecem, esteve sempre pronto a elucidar-me sobre qualquer ponto necessário, nunca permitindo que houvesse falta de informação, e que sempre nos motivou a cumprir prazos e a estabelecer os objetivos apropriados.
Não obstante os seus horários preenchidos, o Professor Rui Oliveira revelou sempre uma preocupação com o meu percurso académico e teve uma forte influência na escolha deste tema que não só se harmonizou com as minhas necessidades profissionais e pessoais como fortaleceu ainda mais o meu interesse por esta área de estudo.
Ao António Roleira, um sincero obrigado, não só pela forma irrepreensível como conduziu o meu estágio que me permitiu conhecer mais de perto a espécie estudada nesta Unidade Curricular, como pela constante e incansável capacidade de me ajudar logisticamente durante o processo de observação dos vídeos. Ainda, pelos bons momentos partilhados, que foram muitos! Conhecer o Gonçalo Oliveira enquanto professor é uma experiência bastante divertida. A sua forma de ensinar é cativante e tão elucidativa! No entanto, a sua capacidade de me ensinar não terminou aqui. A sua ajuda no tratamento estatístico deste trabalho foi fundamental e ajudou a tornar este projeto exequível, durante o seu próprio processo académico de doutoramento. Por tudo isto, muito obrigado, Dr. Oliveira! Estou muito orgulhosa de ti.
Dirijo à Teresa Oliveira as minhas últimas, mas nunca menos importantes, palavras. Conheci-a enquanto colega mas rapidamente fiquei conhecedora das suas capacidades educativas. A admiração que lhe tenho, pela sua infatigável necessidade e força de aprender, e pela sua capacidade de motivar outros a seguir os seus objetivos, fizeram deste conhecimento um processo de amizade. A sua constante alegria e disponibilidade são contagiantes. Orgulho-me de ser sua amiga e alegro-me tanto com as suas vitórias! Um abraço muito apertado, Teresa!
À Sofia Carvalheiro, Renata Alves e Rodrigo Bento, meus companheiros de “guerra”, muitas felicidades!
4
NOME: Vanda Marnoto Nº ESTUDANTE: 21808
CURSO: Psicobiologia
ÁREA DE ESPECIALIZAÇÃO: ANO LECTIVO: 2014/2015
ORIENTADOR: Prof. Doutora Leonor Galhardo DATA: Dezembro de 2015
TÍTULO DA DISSERTAÇÃO: Diferenças comportamentais em tilápias de Moçambique (Oreochromis mossambicus)
RESUMO
As diferenças comportamentais sempre foram visualmente observadas em animais de diversas espécies e, nas últimas décadas, deu-se início a uma série de estudos que pudessem aprofundar este conhecimento.
Pelas suas características e pela sua importância comercial, a tilápia de Moçambique também tem sido alvo de estudo e as suas diferenças comportamentais têm-se mostrado relevantes e fáceis de observar. Esta tese propôs-se verificar a existência das diferenças comportamentais entre os indivíduos observados e se estas diferenças seriam consistentes ao longo de vários contextos e correlacionáveis entre si. Seis testes deram lugar a um conjunto de resultados que divulgaram padrões comportamentais de agressão, atividade, exploração e reatividade. Estes três últimos padrões revelaram uma correlação positiva entre si, mas negativa com o padrão de agressividade. Estas correlações podem ser expressivas de diversas adaptações ao meio ambiente circundante. Os três grupos de animais observados mostraram diferenças de comportamento significativas que podem ser explicadas pela diferença de idades e experiência prévia.
Palavras-chave: diferenças comportamentais, tipos comportamentais, tilápias de Moçambique
TÍTULO DA DISSERTAÇÃO EM INGLÊS: Behavioural differences in Mozambique tilapia (Oreochromis mossambicus)
ABSTRACT
Behavioural differences have always been visually observed in many species and, in the last few decades, a series of studies was initiated to better our knowledge on the subject.
Due to its characteristics and its commercial importance, the Mozambique tilapia has also been the subject of study and their behavioural differences have been shown to be relevant and easy to observe. This thesis set out to verify the existence of behavioural differences between the observed individuals and if these differences would be consistent over different contexts and correlated with each other. Six tests were carried out and gave place to a set of results that revealed behavioural patterns of aggressiveness, activity, exploration and reactivity. These last three patterns disclosed a positive correlation among them but a negative one with the aggressiveness pattern. Such correlation may express diverse adaptations to the surrounding environment. The three groups of observed animals showed significant behavioral differences that might be explained by age differences and previous experience.
6
Index
Introduction ... 8
Definition of concepts related to behavioural differences ... 8
Behavioural traits, behavioural types and behavioural plasticity ... 10
Ontogeny of behavioural traits ... 12
Importance of behavioural types in scientific studies and ecology ... 13
Integrating behavioural traits within ecological studies... 15
Correlation between behavioural syndromes across different contexts ... 16
Mozambique tilapia as a model for scientific studies ... 17
Aims of this study ... 18
Materials and methods ... 19
Animal husbandry ... 19
Experimental procedures ... 20
Mirror test ... 20
Intruder test ... 21
Open field test ... 21
Novel object test ... 21
Sudden event test ... 22
Confinement test ... 22
Blood sampling and cortisol assay ... 22
Data analysis ... 23
Statistical procedures ... 23
Results ... 25
Components for quantified behavioural variables ... 25
Reactivity tests ... 25
Behavioural correlations among tests ... 28
7
Discussion ... 32
Behavioural correlations ... 32
Components for quantified behavioural variables ... 32
Behavioural correlations among tests ... 33
Differences in behavioural responses among different groups ... 36
Conclusion ... 37
References ... 38
Appendix I ... 45
8
Introduction
Like humans, other animals exhibit different behavioural characteristics from each other that tend to be somewhat consistent throughout time (Dingemanse & Dochtermann, 2013). This consistency is broadly named as personality in humans after which it has been scientifically recognized in other species (Gosling & John, 1999). Some will consider personality in “higher” species but not in “lower”, such as fish. Personality studies are very important to understand differences in behavioural responses of individuals or populations belonging to the same species. In these last few decades, scientists have begun to debate not only inter-individual variations but also the similarities of individual behaviour variation in non-human animals and humans, primarily based on constructs, definitions and empirical studies from the psychology field of studies in humans (Gosling, 2001), initially named “animal personality” (Buss, 1991).
Some theorists avoided the ‘personality’ term, with just a slight variation in meaning, to name related concepts, such as “temperament” (Boissy, 1995; Clarke & Boinski, 1995) “coping styles or strategies” (J.M Koolhaas et al., 1999) and “behavioural syndromes” (Sih, Bell, & Johnson, 2004), analogous to literature on personality types in humans (Pervin & John, 1999).
Definition of concepts related to behavioural differences
Animal personality is defined as consistent differences between individuals in their behaviour over time (Réale, Reader, Sol, McDougall, & Dingemanse, 2007). It is characterized by a variation of behavioural tendencies between individuals, which affects behaviours expressed in different contexts relates to consistent patterns of thinking and feeling (Stamps & Groothuis, 2010). As discussed by Castanheira et al. (2015), despite including an important emotional component, when applied to animals, this aspect is often neglected.
Temperament refers to relatively consistent individual dispositions that underlie and modulate the expression of behaviour (Boissy, 1995; McDougall et al. 2006),
9 meaning that individual characteristics may be expressed in different contexts as different behaviours (Herczeg & Garamszegi, 2012).
Coping styles designate a coherent set of behavioural and physiological stress responses consistent over time, which is characteristic to a certain group of individuals (Koolhaas et al., 1999).
This is a term more often used in physiological and biomedical research, and it is linked to a general stress response, whereas the expression behavioural syndromes, representing suites of behavioural traits that co-vary across different contexts (Sih et al., 2004),is commonly found in research related to behavioural ecology and not necessarily associated to stress.
The concept of coping styles comprises two distinct behavioural responses to stress, associated with also distinct hypothalamus-pituitary-interrenal (HPI) axis reactivity, where proactive (i.e. active coping) individuals actively avoid a stressful stimulus, show high levels of aggressive behaviours (Millot, Bégout, & Chatain, 2009; Øverli et al., 2007), are more “fixed” in their behavioural responses (Koolhaas et al., 1999; Raoult et al., 2012; Sih et al., 2004) and present low response of HPI axis reactivity (Silva et al., 2010) with low levels of blood cortisol, opposite of reactive individuals (i.e. passive coping), that reflect immobility, higher flexibility in behavioural responses (Raoult et al., 2012) and low levels of aggression, parallel to having high response of HPI axis reactivity (Castanheira et al., 2015; Koolhaas et al., 1999).
Although developed in separate literature, the definitions of “temperament” and “coping styles” eventually converged with that of “animal personality” (Réale et al., 2007; Stamps & Groothuis, 2010). Still, this diversity of concepts on individual differences in animal behaviour soon brought literature to become fragmented leading to the necessity of a framework to bring together these notions (Budaev & Brown, 2011), as well as the methodology required to clarify the associated difficulties, such as complications in quantifying behaviour (Réale et al., 2007).
The concept of “personality” places behavioural tendency on a time context. Behaviour presents itself over time, while “behavioural syndrome” focuses on the behavioural correlation across contexts. It also differs from “personality” in the sense that it doesn’t claim for a genetic basis and it is grounded on the statistical view of the correlation (i.e. when one behaviour changes, it is likely to be accompanied by the other behaviour, but it doesn’t necessarily cause that change) (Sih & Bell, 2008).
10 In reality, despite some differences in approaches, most of the underlying definitions are common.
Animals don’t all behave the same way in different contexts and even the same individual may change its behaviour accordingly to its needs. These behavioural differences may be observed in many species, as well as fish (Budaev & Zworykin, 2002).
Behavioural traits, behavioural types and behavioural plasticity
Each individual is composed of a set of traits (or characters) that characterize it and may distinguish it from other individuals. These traits can also vary between populations and species. Their phenotype, id est (henceforth i.e.) their observable and measurable traits, based on genotype and affected by the environment (Bolnick et al., 2011) are designated as behavioural types (Sih et
al., 2004). Behavioural types are thus not random, but rather depend on the individual’s genetics
and the set of conditions in which it presents itself (Réale et al., 2007). Individuals don’t behave the exact same way every time. For example, motivation to have access to a given resource or to perform a given behaviour may influence behaviour (Galhardo, Almeida & Oliveira, 2011; Galhardo & Oliveira, 2009). But, even so, patterns of behaviour present some degree of stability across contexts and repeatability, i.e., a rough exhibition of the same behavioural traits over time (Jacobs, 2009). Examples of these behavioural traits are anti-predator defense, resource use and competitive ability (Bolnick et al., 2011).
Furthermore, it is common to find and quantify between-individual differences in behaviour (Dingemanse & Dochtermann, 2013), meaning that there is probability that no two organisms are exactly identical in their behavioural traits. These between-individual behavioural differences are broadly referred to as variation (Armitage, 1986; Carter et al., 2013; Dingemanse & Dochtermann, 2013; Dingemanse & Wolf, 2010).
Behavioural types are not measured in a binary system, where one can say, for example, that an individual is either bold or shy (independent types of behaviour), nor can be interpreted as bimodal variables. Rather, these two types of behaviour are indeed opposite extremes of a shyness-boldness continuous axis, but within which there is a distribution and individuals will
11 often vary from being very shy to being very bold (i.e. tendency for an individual to take risks, where boldest individuals take more risks and shyest individuals avoid risks)(Wilson & Godin, 2009; Wilson et al., 1994).
This shyness-boldness axis has been widely studied (Galhardo, Vitorino & Oliveira, 2012; Gosling, 2001; Harcourt et al., 2009; Magnhagen et al., 2014; White et al., 2013; Wilson et al., 1994) and is one of five categories proposed by Réale et al. (2007), which also include exploration-avoidance (individual’s reaction to a new stimulus, such as new environment, new food, new object), aggressiveness (individual’s agonistic behaviour towards conspecifics), activity (individual’s general activity level) and sociability (individual’s reaction of seek or shun
conspecifics, apart from aggressive situations). Another relevant axis mentioned by Réale but first considered by Koolhaas et al. (1999) was the
reactive-proactive axis, closely related to the concept of “coping style”, since it refers to the reaction of an animal to a stressful situation. More proactive individuals try to wield the situation while reactive tend to freeze (i.e. stay still) (Careau et al., 2008). This, it is frequently associated with the shyness-boldness axis.
So if animals tend to show some stability in their behavioural types across contexts and vary from conspecifics, this means that some animals likely display one behavioural trait more than others, regardless of the context. Yet, this stability, or inflexibility in behavioural change, may sometimes be counterintuitive. On one hand, if an individual is coherently aggressive across different contexts, this aggressiveness may be adaptive in one context but maladaptive in another (example given (hereforth e.g.) spiders with high levels of aggressiveness may adaptively win in territory defense but exhibit nonadaptive sexual cannibalism (Sih et al., 2005)). On the other hand, if the density of shy individuals in any given species who chose safe habitats is high, the population becomes overcrowded (Budaev & Brown, 2011; Wilson et al., 1994).
Even though, in theory, an individual should be completely and broadly plastic in behaviour, chances are that the changes are not so drastic from situation to situation. Plasticity tends to “move” around an anchor point of behaviour, with slow-changing state variable (Sih & Bell, 2008).
Some animals are more plastic than others. Optimal behavioural plasticity occurs then when an individual displays flexibility in its behavioural type and alters its performance accordingly to the
12 changing environmental conditions (e.g. if predation risk is high, it may be productive to reduce foraging when energy reserves are high but to increase it if energy reserves are low) and suboptimal behavioural plasticity occurs when an individual maintains a fixed behavioural performance even in counterproductive conditions (e.g. a very aggressive individual may be a good forager but may incidentally attack potential mates) (Budaev & Brown, 2011; Frost et al., 2007; Jacobs, 2009).
Thus, being plastic in its behavioural traits is an adaptive requirement for any individual. In reality, this adaptation to changing environmental conditions will attest to their survival and reproductive success (Nussey, Wilson, & Brommer, 2007; Piersma & Drent, 2003). As it seems, bolder guppies are more attractive to females, thus increasing their successful reproduction (Sih et
al., 2004). Since each individual does not express the full range of behavioural traits of its
population, some theorists have tried to explain the adaptive potential of this variation.
Yet, some authors defend that it may not show only positive results. For example, bolder sunfish tend to explore more, engage in predator inspection and feed on more exposed environments, which may lead to species dispersal but, although more territory is covered, chances of coming in contact with different parasites species also increases (Sih et al., 2005).
Ontogeny of behavioural traits
As stated before, an individual’s behavioural types result from a joint action of genetic charge and environmental conditions and are relatively repeatable over time. In fact, a behavioural type is not necessarily set for life. Ongoing life experience may either fortify traits, and therefore strengthen behavioural types, or it can weaken them and therefore reshape behavioural types, through negative and positive feedback loops, respectively (Sih et al., 2005). Similarly, behavioural types may also have effect on learning experiences (e.g. boldness and speed of learning).
Negative feedback loops lead to behaviour convergence over time. For example, during an individual’s asset (e.g. energy reserve, reproductive value) protection process, it is cautious when in need to protect its high assets, which eventually erodes them, leading to low assets. In order to
13 increase its assets again, the individual needs to act bolder, thus increasing its assets and so on (Luttbeg & Sih, 2010; McElreath & Strimling, 2006; Sih et al., 2014).
Positive feedback loops may lead to behaviour divergence over time. Studies have shown that individuals with prior winning results in conspecifics conflicts, due to bolder behaviour, have higher probabilities of winning again in future conflicts, as opposed to shyer individuals with losing experiences, who will most likely continue to lose. Thus, over time, it is possible to discriminate two different types of behaviour in individuals, bolder and shyer (Frost et al., 2007; Oliveira, Silva & Simões, 2011).
Aside from these life skills, phenotypic plasticity may also develop from social learning, with individuals gaining helpful surrounding information from observing conspecifics’ behaviours, reducing costs paid by learning first hand (Frost et al., 2007). A study has shown that Arctic charr (Salvelinus alpines) individuals with no experience in predator defense displayed almost none anti-predator responses, and increased levels of this behaviour after observing anti-predator-experienced conspecifics (Vilhunen, Hirvonen & Laakkonen, 2004).
It is possible to affirm that ontogeny (i.e. the development of an organism from embryo to adulthood) and social learning help individuals retain information about previous experiences that affect current and future behaviour, then shaping the repeatability of behavioural traits, as well as inter-individual variation.
Importance of behavioural types in scientific studies and ecology
Individual variation in fish behaviour has had known implications in areas such as behavioural ecology, aquaculture, neurosciences, health and welfare (Castanheira et al., 2013).
Ignoring behavioural traits, when building an experimental design in the field of ecology, may be counterproductive, since some important methodological problems may arise when establishing measures (Careau et al., 2008). For example, when performing capture-mark-recapture tests, it is important to remember that shy animals are usually less observed and therefore, less trappable than bolder conspecifics (Wilson et al., 1994). Because many studies can be approached by
14 ultimate (ecology and evolution) and proximate (neuroendocrinology, genetics) views, it is important to understand these implications.
Behavioural types such as boldness and aggressiveness have shown to have influence on fitness (Ariyomo, Carter & Watt, 2013; Smith & Blumstein, 2008). Aggressiveness helps the individual gaining access to mates, resources and maintain dominance (Ang & Manica, 2010; Larson, O’Malley & Melloni, 2006) and promote foraging success (Dyer et al., 2009; Stamps, 2007) among other important requirements for fitness. However, patterns of aggressiveness may not always be correlated to expression of boldness in non-social contexts (Biro, Beckmann & Stamps, 2010; Herczeg et al., 2009).
Implications of behavioural differences in ecological and evolutionary processes, such as demography, population density and production as well as its stability and persistence, dispersal, colonization, disease transmission, social evolution and adaptive potential, speciation, species interaction, eco-evolutionary dynamics or community structure have been recently reviewed and validated (for detailed information please see Wolf and Weissing (2012)).
Welfare is another dimension of studies in which behavioural differences take part (Galhardo & Oliveira, 2009). Animal care specialists in many areas know, by experience, that each individual has specific needs and behaviours. Growing welfare concerns in areas such as aquaculture, zookeeping and veterinary care have led to studies on variation of behaviour types in animals (Martins et al., 2012; Watters & Powell, 2012).
An individual’s ability to cope with stressful events is well related to its health and behavioural variation shows that the exact same environmental conditions may be well accepted by one individual and not by another (Galhardo, 2010; Huntingford & Adams, 2005; Prunet et al., 2012), but also because individuals with different behavioural types will display different cognitive and physical enrichment needs (Carere & Locurto, 2011).
It is important to study behavioural differences because interdisciplinary approaches in use are valid, because it has evolutionary weight since behaviours evolve in correlation with others, because it must be carried out in the field as well as in controlled environments for better comparison, because it may have direct implications in the welfare of housed animals and because similar underlying mechanisms of humans may help to better understand its nature and evolution (Carere & Locurto, 2011).
15
Integrating behavioural traits within ecological studies
Over the years, tests (e.g. exposition to novel objects, exposition to mirror, dyadic encounters, open field) have been conceived to verify different behaviour types (e.g. boldness, aggressiveness, exploration) in different species (for review please see Budaev & Brown, 2011; Conrad et al., 2011; Gosling, 2001; Réale et al., 2007).
In order for tests to prove efficient, certain methodological goals must be considered. Test design should incorporate objectives such as method choice, adequate tests (i.e. do they really measure the required trait?) and correct intensity of stimulus (i.e. is the stimulus too strong or too weak, leading to misplacement of the behaviour on the desired scale?). Theorists have still not come to a consensus on whether one or more tests should be carried out for the assessment of each trait studied which should be based on the efficiency of its previous utilization, or if one single test may identify two or more traits (Carter et al., 2013). It is then fundamental to certify that the tests are valid, meaning ‘the degree to which the test actually measures what it purports to measure’ (Anastasi, 1968; Burns, 2008), and reliable, meaning the coherent repeatability of results over performed tests (Burns, 2008; Carter et al., 2013; Réale et al., 2007). In fact, behaviours must be repeatable to be recognized as behavioural traits (Carter et al., 2013; Sih et al., 2005).
Following the assessment of a well-constructed design, results must be statistically treated and concepts such as stability, consistency and variation play an important part of the process in determining behavioural types. Stability means that the absolute value of an individual’s behaviour hardly changes (i.e. the individual presents the same intensity of behaviour throughout different contexts). Consistency regards the correlation (or predictability) of an individual’s behaviours over repeated measurements or across situations (i.e. there may be possible to predict one behaviour if another coherently presents itself over time and across contexts). Variation relates to the behavioural differences between individuals (Budaev & Brown, 2011).
When trying to find patterns of correlated behaviours, investigators usually turn to a principal component analysis (PCA), where all data is primarily associated and calculated based on the original behavioural measurements resulting in new linear combinations between sets of behaviours. This result shows the strongest positive or negative correlations between the sets of behaviours, allowing us to interpret them according to the objectives of the study (Budaev, 2010).
16
Correlation between behavioural syndromes across different contexts
A relevant aspect of understanding behavioural types is related to our ability to correlate them and predict the behavioural outcome of an individual in different contexts (e.g. feeding, mating, reproduction, parental care, territory establishment, predation avoidance, dispersal, social), so that if an individual coherently presents itself as being bolder and aggressive in a given context, it is likely that it will behave the same in another context (Castanheira et al., 2013). Sih et al. (2004) defined behavioural syndromes as ‘suites of correlated behaviours expressed either within a given behavioural
context or across different contexts’, pointing boldness, aggressiveness, activity, fearfulness and
reactivity as being some of the most relevant (Budaev & Brown, 2011).
This concept implies that, for example, in a population where most individuals may vary in their activity levels across situations, some are almost always more active than others. When these different behavioural types are coherently correlated (e.g. exploration and boldness), where some individuals are bolder and tend to explore more across different contexts than others, behavioural syndromes emerge. Accordingly, we refer to behavioural types when referring to individuals and to behavioural syndromes when related to populations or species (Jacobs, 2009). Within a syndrome, individuals maintain a consistent behavioural type.
Behavioural correlations, when existing, are likely to be positive (e.g. a bolder animal is usually more aggressive across contexts) or negative (e.g. when exploring territory in a feeding context, an individual may not be hiding from predators at the same time – time budget) (Jacobs, 2009). Some studies have documented such correlations. Aggressiveness and boldness have been positively correlated and quantified in Gasterosteus aculeatus (Bell & Sih, 2007) as well as boldness and exploration in Amatitlania nigrofasciata (Jones & Godin, 2010). On the other hand, boldness and sociability have been negatively correlated in Gasterosteus aculeatus (Harcourt et al., 2009). Reactivity is generally correlated to boldness and aggressiveness, where proactive individuals are generally more aggressive, exploratory and bolder than reactive individuals (Koolhaas, 2008; Koolhaas et al., 1999).
The relative stability of behavioural traits helps to describe and predict trends (i.e. typical ways of behaviour exhibition) (Budaev & Brown, 2011).
17
Mozambique tilapia as a model for scientific studies
Initially, when performing comparative studies on personality traits between humans and other species, model animals were used, involving a few primates, rodents and domesticated animals (Gosling, 2001; Koolhaas et al., 1999). More recent studies have focused on a more enlarged set of species of birds, reptiles, fish and insects which produced information on a range of different behavioural syndromes (Gosling, 2001).
As such, fish have been important representative taxa in the study of behaviours because of their evolutionary relation to other vertebrates and good adaptation to different environments (Gerlai
et al., 2000; Powers, 1989) and are easy to maintain in a laboratory set (Sergey Budaev & Brown,
2011). Between 2004 and 2010, 149 studies on behavioural syndromes in these species were conducted (Conrad et al., 2011). Examples of the more numerous studies undertaken include the study of shyness-boldness axis, behavioural correlations and inter-population comparisons (Conrad et al., 2011).
Oreochromis mossambicus is one of over 3,000 species of the Cichlidae family. Cichlids present a wide
variation in social behaviour (e.g. ranging from territorial to shoaling and different parental styles). For all these reasons, it has been used as a model system in evolutionary studies (Seehausen et al., 2008; Simões et al., 2012). This species tolerates a wide range of diet requirements, ecological conditions and reproduces easily (Russell, Thuesen & Thomson, 2012). Furthermore, both biology and behaviour of this species is well known in aquaria and its ethogram has been described in detail (Oliveira, 1995). Mozambique tilapia is a very social mouthbrooder, leaving in shoals during the non-breeding period, and being the males very territorial/aggressive in the breeding season. During this season, these animals form leeks in shallow waters, where they build pits in the substrate for which they attract the females.
Studies to verify the existence of behavioural types or behavioural syndromes in Mozambique tilapias (O. mossambicus) may be of great importance and doing so could contribute to the gathering of sufficient information for a large groups of animals that models can be applied and generalization of the role of behavioural differences may be accepted and subject to more scrutinized studies.
18
Aims of this study
In this thesis, behaviour of individually housed males of O. mossambicus was quantified in three behavioural contexts (exploration, aggressiveness and reactivity) across six different tests (respectively: novel object and open field tests, mirror and intruder tests and sudden event and confinement tests).
The first aim of this study was evaluating possible behavioural correlations among tests belonging to the same context and across contexts in order to detect potential behavioural types.
The second aim was assessing whether there were differences in behavioural responses among three groups of animals varying in age and origin.
19
Materials and methods
Animal husbandry
Thirty-six male Mozambique tilapias (O. mossambicus) were observed throughout six different tests, in order to achieve results that would help understand the objectives of this thesis. 24 of the animals used in this study belong to the ISPA – University Institute of Psychological, Social and Life Sciences - stock, held in the building’s biotherium, in which half was composed of young individuals (around six months of age) and the other half composed of experienced individuals (older than 2 years old). 12 animals also used in the experiment came from a different biotherium (CCMAR - Centre of Marine Sciences of the University of Algarve) one year previously to this study and were also older than two years when this study started. This group of animals was always maintained at ISPA’s biotherium separately from the original stock. ISPA’s biotherium room was artificially set to 26-28ºC, using air conditioning. Fish at ISPA were maintained in 120x40x50 cm (240l) glass aquaria with a fine gravel substrate, a water temperature of 26ºC±2ºC and a 12hour/day photoperiod. Each aquarium held stable social groups of 3–5 males and 5–6 females.
Aquaria’s water was filtered with daily siphoning, sandy substrate and external Eheim biofiltering sets (washed monthly, never disregarding the biological component, thus avoiding an imbalance of the nitrogen cycle) and ventilated with constant air flow supply. Water was tested weekly for pH (6.0-6.2) and ammonia (<0.5 ppm) and nitrites (0.2-0.5 ppm) with a Palintest kit®. Daily feeding of animals included an ad libitum supply of commercial cichlid sticks (ASTRA) and twice a week frozen food (chopped mixture of spinach, peas, shrimp and cockles) was given to complement an optimal diet. Animals were identified with a bead system, in which each set of three different colored beads is uniquely combined to form an identification code and surgically placed underneath the dorsal fin with a nylon line (Galhardo, 2010).
20
Experimental procedures
For the purpose of resetting their social behaviour, experimental animals were isolated for 7 days prior to the experiment.
The experimental design consisted of six different tests paired to help identifying behavioural traits within the aggression, exploration, reactivity and boldness contexts, where mirror test (MT) and intruder test (IT) measured aggressiveness traits, open field test (OFT) and novel object test (NOT) helped identifying exploration/activity traits and sudden event test (SET) and confinement test (CT) allowed measuring reactivity traits.
Tests were undertaken in four consecutive days in the following order: day 1, open field test; day 2, novel object test and intruder test; day 3, sudden event test and mirror test; and day 4, confinement test. Rather than randomized, tests were performed in the same order for all animals to ensure similar conditions for all participants. A blood sampling, for cortisol assays, was undertaken 20 minutes after the behavioural sampling of the last test. All testes were recorded with a video recorder placed over one meter away from aquaria settings, and later converted to a set of DVDs. A dark curtain was used to protect the experimental area, in order to avoid unnecessary stressors to the animals.
Behavioural sampling was focal and continuous, registered twice daily at the same time to avoid circadian effects, with individual’s behaviours being registered in accordance with an ethogram list of known agonistic, locomotor, feeding and non-social behaviours of the species (Oliveira, 1995) (please see Appendix I for adapted ethogram).
Mirror test
Protocol for the mirror test (Budaev, Zworykin & Mochek, 1999) included the individual being placed in an isolation aquarium (50x25x30cm) with a covered mirror occupying half of one of the side glass walls from top to bottom. The animal was allowed five minutes to recover from the disturbance, after which the mirror was uncovered and filming began. Animal was observed for ten minutes and behaviours towards mirror and environment were registered.
21
Intruder test
Intruder test protocol (Brelin, Petersson & Winberg, 2005; Ebner et al., 2005; Janczak, Pedersen & Bakken, 2003) involved placing the individual (test fish and intruder) in an isolation glass aquarium (50x25x30cm) placed inside an experimental glass aquarium (100x40x50cm) in a central area, where another individual (resident fish) had already been placed. Resident fish was chosen in order to be slightly bigger than the intruder, so to behave as dominant. The fish was allowed five minutes to recover before a ten minutes filming session began, where behaviours towards resident fish and environment were registered.
Open field test
Protocol for open field test (Budaev & Zhuikov, 1998; Budaev et al., 1999) comprised of fish being positioned in the corner of an experimental glass aquarium (100x40x50cm), with a removable opaque partition holding the fish in the original corner. Animal was allowed five minutes to recover and the partition was then removed, commencing a ten minutes filming session, and interactions with the environment were observed.
Novel object test
The novel object protocol (Janczak et al., 2003; Kooij et al., 2002) consisted of fish being set in an isolation glass aquarium (50x25x30cm) and introducing a novel object, in this case a white ping-pong ball, in the center front area of the aquarium. Filming began immediately and lasted for ten minutes, during which interactions with environment and novel object were registered.
22
Sudden event test
The sudden event protocol (Kooij et al., 2002) included fish being put inside an isolation glass aquarium (50x25x30cm). Food is then delivered and as soon as fish starts to eat, a sudden event such as the very quick introduction and removal of a strange and visible object (child’s beach rake) occurs. Filming begins immediately and ends after ten minutes of observing its behaviour.
Confinement test
Protocol for confinement test involved placing the fish in an isolation glass aquarium (20x10x12cm) with water level barely covering animal’s height (4 to 5cm). Filming begins and lasts ten minutes, after which the individual is restrained for blood collection (Brelin et al., 2005).
Blood sampling and cortisol assay
Experimental fish undertook a blood sampling with the purpose of verifying cortisol levels after the tests. Blood drawing always took place at the same time of day, in order to avoid circadian effects. Individuals were placed in a temporary aquarium and slightly anaesthetized in a solution of MS-222 (tricaine methane sulphonate, Sigma; 200 ppm). 1 ml syringes and 25G/16mm needles were used to draw 100-200 µl of blood from the caudal vein, after which measurements of body length and weight were undertaken.
To recover from anesthesia, individuals were temporarily set in another small aquarium with aerated water, where they would recover within seconds to a minute. The handling process took only a few minutes so the cortisol release in the systemic circulation as a response to the stressful event was not taken into account (Foo & Lam, 1993).Free cortisol fraction was extracted from the plasma by adding diethyl ether to the sample, as the steroid solvent. The samples were then centrifuged (5 min, 1000 rpm, 4 °C) and frozen (10 min, - 80 °C) to separate the ether fraction. The steroids were isolated by evaporating the ether. This process was repeated twice. Levels of
23 free cortisol fraction were then determined by radioimmunoassay, using the commercial antibody ‘Anti-rabbit, Cortisol-3’ [ref: 20-CR50, Interchim (Fitzgerald), Montluçon, France, cross-reactivity: cortisol 100%, Prednisolone 36%, 11-Desoxycortisol 5.7%, Corticosterone 3.3%, Cortisone b 0.7%] and the radioactive marker [1,2,6,7-3H] Cortisol [ref: TRK407-250mCi, Amersham Biosciences, Piscataway, NJ/USA] (Galhardo, Vital & Oliveira, 2011). Intra and inter-assay variability were respectively 4.9% and 5.9%.
Data analysis
Observation of videos used the software software “Observer” from Noldus XT 7.0 to record and analyze behaviouraldata which was then exported to an Excel file for further analysis.
Statistical procedures
In order to simplify the analysis, a Principal Components Analysis (PCA) was conducted on the behavioural markers assessed in each test. PCA identifies the dimensionality of correlated dependent variables to assess behavioural markers (Howell, 2007).
An identical procedure was adopted for each PCA: the analysis started by confirming that KMO values were higher than .80 and a significant Bartlett test was obtained. Next, a Kaiser rule was adopted for factor extraction (i.e., eigenvalues number > 1) that explained the largest proportion of the observed variables (60%-80%) (Hair, 2006). A Varimax rotation method was used, thus leading to factors that are orthogonal (Budaev, 2010). When analyzing the rotated matrix, a cut-off point of higher than .60 was established for factor loadings. Manifest variables with loadings lower than .60 or with double loadings were eliminated from the analysis (Hair, 2006). Factors with only one significant loading were also eliminated from the analysis as they were considered to require additional studies for conceptual support. The PCAs were re-run when necessary in order to fully comply with the criteria previously described. The final solutions for each test are
24 presented in the Results section. For each final solution, the factor scores were calculated and used in the subsequent test of hypothesis.
In order to detect overlapping results or behavioural patterns, a correlation matrix of the factor scores was calculated.
A MANOVA multivariate test of significance was adopted to test the hypothesis of differences between three groups of animals in the sample. Following a significant multivariate result (Wilks Lambda = 0.201, F(12,24) = 2.254, p < 0.05), Univariate Test for each Principal Component were conducted. For each component, with significant univariate results, a post-hoc analysis (Scheffé test) was run to contrast differences between groups.
Ethical Note
The experiments described were conducted in accordance to national legal standards on protection of animals used for experimental purposes. Refinement was considered as much as knowledge available allowed. Interference with animals and blood sampling procedures were reduced to a minimum, and included the use of anesthesia and a fast and full recover.
25
Results
Components for quantified behavioural variables
Reactivity tests
For the reactivity axis, comprising both Confinement Test and Sudden Event Test, the first factor loading (F1, explaining 59,55% and 44,30%, respectively) was identified as a reactivity pattern, and the second factor loading (F2, explaining 20,06% and 22,22%, respectively) was identified as an inactivity pattern. In the CT’s, F1 was characterized by a set of locomotion patterns of variable durations and frequencies. SET’s F1 was marked by the fast operculum beating associated with locomotion patterns. A negative correlation was found between the expected reactivity marker for this test (latency to resume feeding) and operculum beating (rSpearman
=-0,499; p<0,05).
26
Behavioral
context Tests Behaviors within each contexto PCA loading
F1 F2
PCA denomination Reactivity Inactivity
Reactivity Confinement test Variance explained (79,61%) 59,55% 20,06%
Frequency to remain inactive on the substrate in the front of aquarium -0,748 0,503 Frequency of inactivity on the substrate while touching wall with mouth -0,651 0,316 Frequency of inactivity on the substrate while not touching wall -0,494 0,785 Frequency of inactivity on the substrate with fast operculum beating -0,787 0,510 Frequency of inactivity on the substrate in a vertical body position -0,412 0,860 Duration of inactivity on the substrate in a vertical body position 0,844 0,331 Latency to remain inactive on the substrate -0,602 -0,391 Frequency of swimming with fast operculum beating -0,835 0,281 Duration of swimming with fast operculum beating -0,833 0,108 Frequency of active fin movement in the front of aquarium -0,948 -0,097 Duration of active fin movement in the front of aquarium -0,845 -0,338 Frequency of active fin movement in the back of aquarium -0,762 -0,329 Duration of active fin movement in the back of aquarium -0,779 -0,509 Frequency of active fin movement with fast operculum beating -0,970 -0,175 Duration of active fin movement with fast operculum beating -0,843 -0,406
Reactivity Sudden event test PCA denomination Reactivity Inactivity
Variance explained (66,52%) 44,30% 22,22%
Frequency of hovering while not touching wall -0,734 -0,089 Duration of hovering in the front bottom of aquarium -0,063 0,891 Frequency of hovering in the back bottom of aquarium -0,303 -0,783 Duration of hovering in the back bottom of aquarium 0,141 -0,921 Frequency of hovering with fast operculum beating -0,915 -0,056 Frequency of sliding with fast operculum beating -0,764 -0,079 Duration of sliding with fast operculum beating -0,862 0,041 Frequency of swimming with fast operculum beating -0,784 0,019 Duration of swimming with fast operculum beating -0,752 0,107 Frequency of nibbling with no food ingestion -0,603 0,361
Frequency of other behaviors with fast operculum beating -0,714 -0,168
Table 1. Factor loadings for quantified variables and total variance explained by each component for the reactivity axis (Confinement Test and Sudden Event Test)
Exploration tests
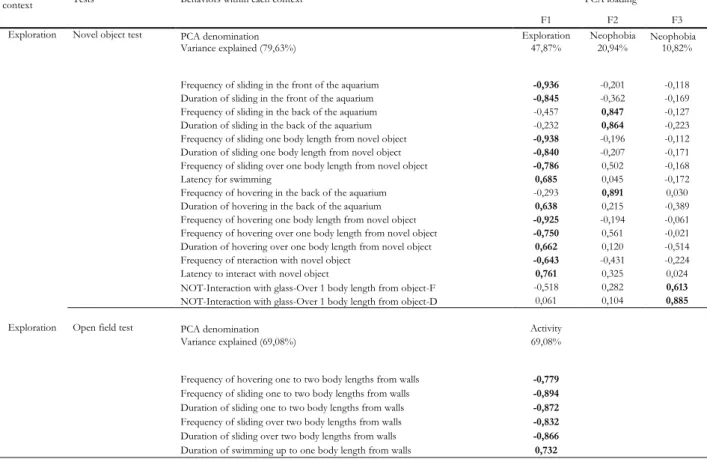
For the exploration axis, Novel Object Test (NOT) was comprised of three explanatory factors. F1, explaining 47,87% of the results, was signed as an exploration pattern characterized by the proximity to the novel object; whereas F2 (explaining 20.94%) and F3 (explaining 10.82%) were labeled as neophobia, associated to inactivity or distraction behaviours (F1) and away from the novel object (F2). The Open Field Test (OFT) was explained by only one factor (explaining 69,08% of the results) and identified as an activity pattern represented by locomotion patterns of behaviour, as shown by Table 2.
27
Behavioral
context Tests Behaviors within each context PCA loading
F1 F2 F3
Exploration Novel object test PCA denomination Exploration Neophobia Neophobia
Variance explained (79,63%) 47,87% 20,94% 10,82%
Frequency of sliding in the front of the aquarium -0,936 -0,201 -0,118 Duration of sliding in the front of the aquarium -0,845 -0,362 -0,169 Frequency of sliding in the back of the aquarium -0,457 0,847 -0,127 Duration of sliding in the back of the aquarium -0,232 0,864 -0,223 Frequency of sliding one body length from novel object -0,938 -0,196 -0,112 Duration of sliding one body length from novel object -0,840 -0,207 -0,171 Frequency of sliding over one body length from novel object -0,786 0,502 -0,168
Latency for swimming 0,685 0,045 -0,172
Frequency of hovering in the back of the aquarium -0,293 0,891 0,030 Duration of hovering in the back of the aquarium 0,638 0,215 -0,389 Frequency of hovering one body length from novel object -0,925 -0,194 -0,061 Frequency of hovering over one body length from novel object -0,750 0,561 -0,021 Duration of hovering over one body length from novel object 0,662 0,120 -0,514
Frequency of nteraction with novel object -0,643 -0,431 -0,224
Latency to interact with novel object 0,761 0,325 0,024
NOT-Interaction with glass-Over 1 body length from object-F -0,518 0,282 0,613 NOT-Interaction with glass-Over 1 body length from object-D 0,061 0,104 0,885
Exploration Open field test PCA denomination Activity
Variance explained (69,08%) 69,08%
Frequency of hovering one to two body lengths from walls -0,779 Frequency of sliding one to two body lengths from walls -0,894 Duration of sliding one to two body lengths from walls -0,872 Frequency of sliding over two body lengths from walls -0,832 Duration of sliding over two body lengths from walls -0,866
Duration of swimming up to one body length from walls 0,732
Table 2. Factor loadings for quantified variables and total variance explained by each component for the activity axis (Novel Object Test and Open Field Test)
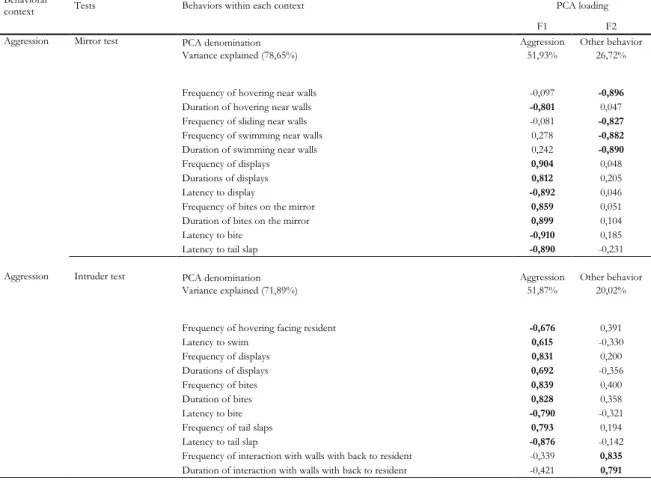
Aggressiveness tests
As for the aggression axis, MT and IT’s first factor (explaining 51,93% and 51,87% of the results, respectively) was termed as an aggressiveness pattern, marked by aggressive patterns of behaviour, such as displays, biting and tail slaps of variable duration, frequency and latencies. F2 of both tests was stamped as other behaviour, mainly related to behaviour such as nibbling the tank’s wall, as seen in Table 3.
28
Behavioral
context Tests Behaviors within each context PCA loading
F1 F2
Aggression Mirror test PCA denomination Aggression Other behavior
Variance explained (78,65%) 51,93% 26,72%
Frequency of hovering near walls -0,097 -0,896
Duration of hovering near walls -0,801 0,047
Frequency of sliding near walls -0,081 -0,827
Frequency of swimming near walls 0,278 -0,882
Duration of swimming near walls 0,242 -0,890
Frequency of displays 0,904 0,048
Durations of displays 0,812 0,205
Latency to display -0,892 0,046
Frequency of bites on the mirror 0,859 0,051
Duration of bites on the mirror 0,899 0,104
Latency to bite -0,910 0,185
Latency to tail slap -0,890 -0,231
Aggression Intruder test PCA denomination Aggression Other behavior
Variance explained (71,89%) 51,87% 20,02%
Frequency of hovering facing resident -0,676 0,391
Latency to swim 0,615 -0,330 Frequency of displays 0,831 0,200 Durations of displays 0,692 -0,356 Frequency of bites 0,839 0,400 Duration of bites 0,828 0,358 Latency to bite -0,790 -0,321
Frequency of tail slaps 0,793 0,194
Latency to tail slap -0,876 -0,142
Frequency of interaction with walls with back to resident -0,339 0,835
Duration of interaction with walls with back to resident -0,421 0,791
Table 3. Factor loadings for quantified variables and total variance explained by each component for the aggression axis (Mirror Test and Intruder Test)
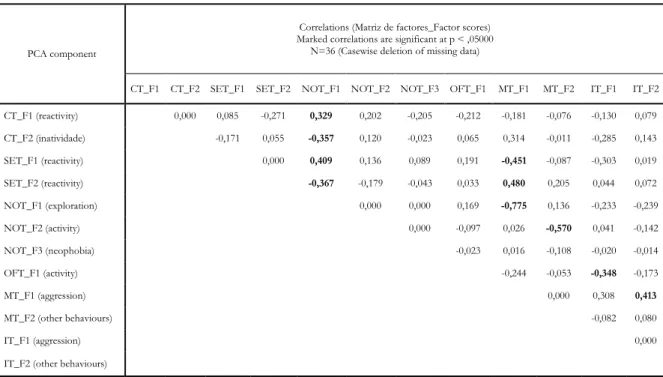
Behavioural correlations among tests
Exploration (NOT’s F1) correlates positively with reactivity (CT’s and SET’s F1) and negatively with inactivity (CT’s F1 and SET’s F2) and with aggressiveness (MT’s F1) (See Table 4). This suggests that more exploratory individuals are those that more actively react to a stressful stimulus, but are less aggressive in a social context. The same way, aggressiveness (MT’s F1) correlates negatively with reactivity (SET’s F1) and exploration (NOT’s F1) and positively with
29 inactivity (SET’s F2) and with other behaviour in the IT (IT’s F2) (See Table 4). These correlations add the fact that more aggressive animals are also those which perform more of other behaviours. Other behaviours, as already described, are mainly characterized by nibbling in the aquarium’s walls. Notably, no further correlations were found between components of tests belonging to the same behavioural context.
PCA component
Correlations (Matriz de factores_Factor scores) Marked correlations are significant at p < ,05000
N=36 (Casewise deletion of missing data)
CT_F1 CT_F2 SET_F1 SET_F2 NOT_F1 NOT_F2 NOT_F3 OFT_F1 MT_F1 MT_F2 IT_F1 IT_F2 CT_F1 (reactivity) 0,000 0,085 -0,271 0,329 0,202 -0,205 -0,212 -0,181 -0,076 -0,130 0,079 CT_F2 (inatividade) -0,171 0,055 -0,357 0,120 -0,023 0,065 0,314 -0,011 -0,285 0,143 SET_F1 (reactivity) 0,000 0,409 0,136 0,089 0,191 -0,451 -0,087 -0,303 0,019 SET_F2 (reactivity) -0,367 -0,179 -0,043 0,033 0,480 0,205 0,044 0,072 NOT_F1 (exploration) 0,000 0,000 0,169 -0,775 0,136 -0,233 -0,239 NOT_F2 (activity) 0,000 -0,097 0,026 -0,570 0,041 -0,142 NOT_F3 (neophobia) -0,023 0,016 -0,108 -0,020 -0,014 OFT_F1 (activity) -0,244 -0,053 -0,348 -0,173 MT_F1 (aggression) 0,000 0,308 0,413 MT_F2 (other behaviours) -0,082 0,080 IT_F1 (aggression) 0,000
IT_F2 (other behaviours)
Table 4. Correlation matrix of factor scores (values in bold are significant for p<0.05)
Differences in behavioural responses among different groups
There are differences among the three groups of animals across the different tests (Wilks λ = 0,201; F = 2,254; p=0,010). Univariate results for each dependent variable show that these
30 differences among groups are specifically related to reactivity (CT F1), Activity (OFT F1), Aggressiveness (MT F1 and IT F1) and Other behaviour (IT F2) as can be observed in Table 5.
Effect
Univariate Results for Each Principal Component isolated in each test Degree
of liberty
CT_F1 CT_F1 CT_F1 CT_F1 OFT_F1 OFT_F1 OFT_F1 OFT_F1 MT_F1 MT_F1 MT_F1 MT_F1 IT_F1 IT_F1 IT_F1 IT_F1 IT_F2 IT_F2 IT_F2 IT_F2 Intercept 1 0,048 0,048 0,077 0,783 0,001 0,001 0,001 0,970 0,011 0,011 0,013 0,909 0,010 0,010 0,011 0,916 0,006 0,006 0,007 0,932 Groups 2 14,328 7,164 11,437 0,000 7,495 3,747 4,496 0,019 7,026 3,513 4,144 0,025 7,030 3,515 4,147 0,025 7,266 3,633 4,323 0,022 Error 33 20,672 0,626 27,505 0,833 27,974 0,848 27,970 0,848 27,734 0,840 Total 35 35,000 35,000 35,000 35,000 35,000
Table 5. Significant univariate results for principal components
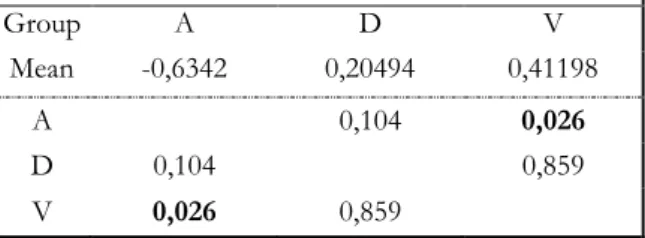
There were differences in behaviour between groups A and D in the aggression context (both MT F1 and IT F1, Scheffé Test according to the means of factor scores, with p=0,025) where group A expressed a higher level of aggressive behaviours when compared to group D, with group V showing no statistical differences with the other two groups as can be observed below in Figure 1 (please see Appendix II for detailed information).
An one-way ANOVA presented no significant differences between all three groups, regarding cortisol levels (F(2, 31)=1,013, p=0,375).
Conversely, group V displayed noteworthy differences from the other groups in the reactivity context (CT’s F1; p=0,001) and from group A in the activity axis (OFT’s F1; p=0,026) and displacement activity associated with the aggression axis (IT’s F2; p=0,022). In the first case, group V was far less active in responding to a stressful stimulus (confinement). In the second case, the same animals were more active than the animals in group A when exploring an open field in an aquarium, but exhibited less of other behaviour towards an opponent than the other group.
31
Figure 1. Graphic representations of statistical differences between groups in behavioural patterns in which a) and b) show significant differences between groups A and D in the aggressiveness axis, c) shows significant differences between V and the other 2 groups in the reactivity axis and d) and e) show significant differences between groups A and V
c e d * * * * a * b
32
Discussion
Behavioural correlations
Components for quantified behavioural variables
PCA results led to a strongest first component of reactivity patterns in the Confinement Test and the Sudden Event Test, aggressiveness patterns for the Mirror Test and Intruder Test and also an activity pattern for the Open Field Test and exploration pattern for the Novel Object Test. Patterns were denominated accordingly to the set of behavioural measures that correlated with each other, known in literature for having great significance in assessing behavioural patterns (Castanheira et al., 2015; Mazue, Dechaume-Moncharmont & Godin, 2015; Oswald, Singer & Robison, 2013; Réale et al., 2007; Silva et al., 2010; Smith & Blumstein, 2010). Hence, it was expected that for the reactivity axis’s tests, a reactivity pattern (e.g. nibbling) was observed for the strongest component, as well as an exploration pattern (e.g. interaction with novel object) for the exploration axis and aggression pattern (e.g. display, bite) for the aggressiveness axis.
The second and third components of each test do not explain results as strongly, but they are supported by behavioural measurements that relate to patterns usually associated with the behavioural axis under study.
For both reactivity axis and aggressiveness axis, the second components were labelled inactivity for the Confinement Test and Sudden Event Test and other behaviour for the Mirror Test and Intruder Test.
Using PCA to find patterns of correlated behaviours, as a conservative analysis method (Muschick, Indermaur & Salzburger, 2012), led to some relevant behaviours being eliminated in the process (e.g. latency for nibble in the SET). Also, some behaviours expressed differently may have high importance degree but appear to be incorporated in the results (e.g. interaction with novel object). PCA selects principal components and common variance, leading to distinct behavioural manifestations that are unavoidably eliminated in the analysis process, regardless of its biological proeminence. The remaining set of behavioural measurements leave room for interpretation and cautious procedures in doing so are necessary (Budaev, 2010) However, it was
33 evident that, even though such a recognized behavioural measurement like latency for nibble (in the Sudden Event Test) was disregarded by the PCA, a one-way ANOVA test confirmed that it was negatively correlated with the fast operculum beating of the fish while hovering (in the same test), a behavioural measurement considered by PCA as having significant value for the reactivity pattern. In fact, several studies have proposed that ventilation rate in fish is a noninvasive efficient behavioral marker (Barreto & Volpato, 2004; Carere & van Oers, 2004), and should be used to identify behavior profiles (Barreto & Volpato, 2011).
It seems to be noteworthy that Budaev & Brown (2011) have also observed that an individual’s behaviour is not only context dependent, but is also influenced by its motivational status. Motivation, a net of external and internal factors that result in temporary changes in behaviour (Manning & Dawkins, 1998), then makes it very difficult to originate identical conditions in the environment for the tested individuals.
Behavioural correlations among tests
The exploration pattern correlated positively with reactivity (test) and negatively with inactivity (test) and aggression (test) patterns. Aggression pattern correlated positively with inactivity (test) and other behaviour (IT) patterns and negatively with reactivity (test), as well as the previously mentioned exploration (test) pattern.
Known behavioural correlations in literature (for review of major findings from extensive literature on behavioural syndromes in fish, please see Conrad et al. (2011)), such as positive correlations between exploration and activity and reactivity, were observed in this study, which may constitute behavioural syndromes and, as such, may be an adaptive strategy for O.
mossambicus, as has been shown for other species of fish and other animals (Budaev et al., 1999;
Cote et al., 2010; Dingemanse et al., 2007; Wilson & Godin, 2009; Wilson, Godin & Ward, 2010). In fact, more active individuals who are disposed to explore more disperse more over new territories (Sih et al., 2004). This is important for male tilapias, at least during the breeding season,
34 where territories may become over populated and with highly aggressive interactions. Hence, aggressive patterns can change with social context depending on the resident animal’s social status or even other factors, such as audience effect and location where behaviours are taking place (Oliveira, 2009).
Surprising results of negative correlations between the exploration patterns and the aggression patterns, and positive correlations between inactivity and the latter have ascended from the correlation matrix of factor scores, since most copying styles related literature has shown these correlations to be the opposite for exploration (Budaev et al., 1999; Schurch & Heg, 2010) and for inactivity (Bell & Stamps, 2004; McGhee, Fuller & Travis, 2007; Moretz, Martins & Robison, 2007). Thus more exploratory individuals are usually more territorial and also more aggressive, and generally more active (Cutts, Adams & Campbell, 2011; Cutts, Betcalfe & Caylor, 1998). Nonetheless, negative correlation of exploration and aggressiveness have been observed in cichlid fishes (Budaev et al., 1999), which as mention above may be a good adaptation to avoid highly competitive breeding arenas of males as well as may be a good strategy in parental care. In fact, being consistently aggressive may not be an adequate characteristic for a male progenitor (Ros et
al., 2004).
Furthermore, results of aggressiveness response to intruder tests may be difficult to control since animals may adjust their aggressiveness to the more or less dominant context generated by the resident animal. In our study, residents were chosen to be proportionally bigger than the intruder (our target animal), but still they behaved with different degrees of aggressiveness. Basic et al. (2012) did not show any differences between rainbow trout lines of low and high responsiveness in response to an intruder-resident test. Øverli et al. (2004) has shown how low responsive trouts can become more aggressive when placed in a dominant social position.
This study has come upon a negative correlation between aggression and reactivity, contrary to a previous study showing that most efficient feeders also exhibit faster recovery for feed intake and a higher level of aggression (Martins et al., 2008; Sih et al., 2004), but with similarities to an also previous study that has concluded that, for the same cichlid species, an opposite behavioural response to conspecific skin extract is presented (van de Nieuwegiessen et al., 2008).
35 The correlation between Mirror Test’s aggression pattern (F1) and Intruder Test’s other behaviour (F2) is very interesting to note. this last category is directly related to behaviours such as nipping or motion activities that take place away from the social stimulus (in this case, a conspecific male) and has been associated with displacement activity as an agonistic behaviour (i.e. agonistic activities displayed on weaker conspecifics or on the substrate (Galhardo, 2010)), usually presented by non-territorial male cichlids, serving as a coping strategy for frustration in an undesirable situation (Clement et al., 2005; Øverli et al., 2004). One study has revealed no significant correlation between agonistic behaviours among individuals in a Mirror Test, opposite to an Intruder Test result, inferring that the mirror is not necessarily a predictive value for aggression when comparing these two contexts (Balzarini et al., 2014). Contrarily, Oliveira (2009) has predicted that changes in androgens levels affect behaviours occurring in front of a mirror, escalating to more aggressive behaviours, thus making it possible to predict that the mirror test is indeed a useful tool to assess aggressiveness.
When trying to find a correlation between tests measuring the same motivational context, it became clear that this was not found in the Confinement and Sudden Event tests for reactivity nor in the Open Field and Novel Object tests for exploration. On one hand, this limitation may be conceptual, since literature usually refers to multi-testing for one behavioural trait and single testing for several behavioural traits as being an issue for concern when utilized in animal behaviour tests (Carter et al., 2013).
Earlier studies in this field of work have also not been able to correlate the Novel Object and Open Field tests, when attempting to measure boldness (Carter et al., 2012; Coleman & Wilson, 1998; Toms, Echevarria & Jouandot, 2010), suggesting that the behaviours are context-specific. In this study, the NOT measured exploration and the OFT measured general activity only, possibly due to the reduced dimensions of the aquarium. As far as the reactivity tests were concerned, CT relates to an activity pattern in response to confinement while SET relates to feeding resuming after an unexpected event. But this issue also occurs in behavioural syndromes, as results suggest that more exploratory and active individuals in non-social contexts are less aggressive in social contexts. This may steer one in the direction that non-social exploration and reactive activity may produce responses that cannot be compared with more social contexts. Thus, no behavioural syndrome can be described across the tested contexts. In reality, Ferrari et
36
al. (2015) have also found no consistency in behavioural differences of seabass individuals across
contexts for feed intake recovery and exploration. Nonetheless, similar results have previously come up, discussing the possibility that more exploratory individuals may be less aggressive based on the fact that they frequently have less access to food and, as such, have a higher need to behave more actively to achieve resources that may potentially offer food supply (Wilson et al., 1993).
Differences in behavioural responses among different groups
As far as the groups’ behavioural differences for the different sets of tests, there are two major responses unveiled by groups A, D and V, where A and D were different in their aggressiveness patterns and V were different from A in the activity and other behaviour patterns and from both A and D in the reactivity pattern. Being group D the youngest, the strengthening of behavioural types in relation to aggression seems to not have yet been experienced by this group, since they have probably not experienced enough social stimulus to act in a more aggressive manner (Sih et al., 2005). This experience commonly develops through social learning or eavesdropping, where younger individuals observe more experienced ones, consequently being prone to behavior changes (Frost et al., 2007; Schurch & Heg, 2010). This learning method reduces costs of learning consequences first hand. However, interactions with conspecifics are unavoidable and it has been recorded that winners in a fight tend to keep winning in posterior encounters, while losers tend to keep losing (Dugatkin & Druen, 2004; Hsu, Earley & Wolf, 2006).
As far as the differences observed between groups A and V, it is possible that, again, life experience has had influence on the individuals’ behaviours. Group A was born in a different stock and facility from individuals of group V. Different husbandry procedures, different social learning may or even different physical conditions (e.g. no substrate in the aquarium) may have shaped current behaviour. Group V was comprised of adult individuals that were adapted to handling, and have lived in consistent social groups.