2017 | Lavras | Editora UFLA | www.editora.ufla.br | www.scielo.br/cagro
Energy potential of residual maize biomass at different
spacings and nitrogen doses
Potencial energético da biomassa residual do milho em diferentes espaçamentos e doses de nitrogênio
Rodrigo Ambrosio1, Volnei Pauletti1*, Gabriel Barth2, Fabrício Pinheiro Povh2, Dimas Agostinho da Silva3, Hilbert Blum1
1Universidade Federal do Paraná/UFPR, Departamento de Ciências do Solo, Curitiba, PR, Brasil 2Fundação ABC, Castro, PR, Brasil
3Universidade Federal do Parana/UFPR, Departamento de Engenharia e Tecnologia Florestal, Curitiba, PR, Brasil *Corresponding author: vpauletti@ufpr.br
Received in April 11, 2017 and approved in September 6, 2017
ABSTRACT
Agricultural residual biomass is an important source of energy, and its production and quality vary according to the crop management. This study aimed to assess the effects of plant distribution and nitrogen fertilization on the energy production potential of the biomass of maize cultivated under no tillage. The field experiment was installed in southeast Brazil using five nitrogen rates (0, 60, 120, 180, and 240 kg ha-1) and two inter-row spacings (0.4 and 0.8 m). Grain yield, residual biomass productivity, and bioenergy potential in different
parts of the plant (grain, stalk+leaf, husk, and cob) were assessed. No change in grain yield was observed using narrow row spacing. Stalk+leaf and husk productivity was higher using 0.8 m than using 0.4 m of inter-row spacing. Nitrogen application resulted in increased grain yield and biomass productivity. Nitrogen influences the bioenergy potential by increasing the biomass and calorific value. Application of the maximum nitrogen fertilization rate is recommended for grain yield considering the use of only the husk and cob can generate 2712 kWh ha-1 of bioenergy.
Index terms: Renewable energy; Zea Mays (L.); calorific value; electricity; macronutrients.
RESUMO
A biomassa residual agrícola é uma importante fonte de energia e sua produção e qualidade varia com o manejo das lavouras. O objetivo deste estudo foi avaliar o efeito da distribuição de plantas e da adubação nitrogenada sobre o potencial de produção de energia da biomassa do milho cultivado sob sistema de plantio direto. O experimento de campo foi instalado no sudeste do Brasil, com cinco doses de nitrogênio (0, 60, 120, 180 e 240 kg ha-1) e dois espaçamentos entrelinhas (0,4 e 0,8 m). Foram realizadas avaliações de produtividade
de grãos, produtividade de biomassa residual e potencial de bioenergia em diferentes partes da planta (grão, colmo + folha, palha da espiga e sabugo). A variação no espaçamento não alterou o rendimento de grãos. A produtividade de folhas + palha de espiga foi maior em 0,8 m do que 0,4 m de espaçamento. A aplicação de nitrogênio resultou no aumento do rendimento de grãos e da produtividade de biomassa. O nitrogênio influência o potencial da bioenergia ao aumentar a biomassa e o poder calorífico. Com a dose de 226 kg ha-1
de nitrogênio, taxa máxima para o rendimento de grãos, e considerando apenas o uso de palha da espiga e sabugo, é possível gerar 2712 kWh ha-1 de bioenergia.
Termos para indexação: Energia renovável; Zea Mays (L.); valor calorífico; eletricidade; macronutrientes.
INTRODUCTION
Bioenergy production from energy plant species competes with food production for water and land. An alternative to this competition is the use of lignocellulosic residues from crop yield, which can be used as raw materials to generate heat and electricity in thermal power plants (Varvel; Wilhelm, 2008). The energy resulting from the use of agricultural residual biomass has some important characteristics, such as short-term biomass renewability, which maintains the CO2 balance (Pfaumann,
2006; Johnson et al., 2007); cultivated areas for food production and power generation (Cassman; Liska, 2007); and exploitation of energetic and financial costs of grain production.
high calorific value, ranging from 15.6 to 18.3 MJ kg-1,
similar to the values of species grown solely for energy production such as Eucalyptus sp. (Quirino et al., 2004; Ioannidou et al., 2009). Because of the different energy contents and amounts of biomass produced by distinct parts of the maize plant, its potential to generate energy varies significantly (Pordesimo; Edens; Sokhansanj, 2004; Varvel; Wilhelm, 2008).
Maize production is influenced by nitrogen application and inter-row spacing. Positive productivity responses can be found at narrow spacing, in which density-tolerant genotypes present maximum (Zea mays L.) grain productivity (Al-Naggar et al., 2015); however, negative productivity can also be observed (Modolo et al., 2010), suggesting variation in productivity due to the environment and crop management. This study aimed to determine the influence of different plant inter-row spacings and nitrogen fertilization on the productivity and energy generation potential of the residual biomass of maize cultivated under no tillage.
MATERIAL AND METHODS
The field experiment was conducted in southeast Brazil (24°4’0” S; 49º9’20” W) in the 2010-11 season. Climate in the region is Cfa according to Koppen’s classification; humid and subtropical, with hot summers. Soil in the experimental site is classified as clayey Ferralsol, with smooth wavy relief (IUSS Working Group, 2015), and it presents the following chemical and textural attributes at a depth of 0-0.2 m: P (Mehlich-1) = 47 mg dm-3; organic matter (OM) =
13 mg dm-3; pH (CaCl
2) = 4.5; H+Al (SMP) = 60 mmolc
dm-3; Al = 12 mmol c dm
-3; K = 2.4 mmol c dm
-3; Ca = 38
mmolc dm-3; Mg = 9 mmol c dm
-3; sum of bases (SB) =
49 mmolc dm-3; cation exchange capacity (CEC) = 109
mmolc dm-3; base saturation (V) = 45%; Al saturation =
20%; and clay, silt, and sand content = 417, 130, and 453 g kg-1, respectively.
The maize utilized was the simple early-maturing hybrid AG-8088 YG. To maintain a final population of 75,000 plants per hectare, the number of plants per linear meter was altered even with variation in the row spacing. Fertilization during sowing was 450 kg ha-1, with fertilizer
formulated with 0:20:20 corresponding to 90 kg ha-1 of
P2O5 and K2O.
The study was conducted in a randomized block design with four replicates and treatments following a factorial design combining two narrow row spacings (0.4
and 0.8 m) with five nitrogen rates (0, 60, 120, 180, and 240 kg ha-1). Nitrogen fertilizer was applied by broadcast
topdressing on the first day after planting using ammonium nitrate (34% N) as the nitrogen source. Plot dimensions were 4.8 × 6 and 2.8 × 6 m for 0.8 and 0.4 m inter-row spacings, respectively.
At physiological maturity, grain yield was obtained by harvesting four linear meters from the four central lines of each plot and correcting the moisture to 13%. At the same time, eight maize plants were cut just above the first visible node above ground. The plants were separated into stalk+leaf, husk, cob and grains; weighed; ground with a hammer mill; and subsampled for oven-drying at 60 °C to a constant weight to determine the dry matter (DM), calorific value, and contents of C and H. Biomass productivity was measured by taking the final plant population obtained and counting the plants harvested to determine the grain yield. The harvest index (HI) of the collected plants, defined by the ratio of the grain dry weight to total plant dry matter, was calculated, and the DM of the different plant parts was determined.
After drying, the samples were once again ground in a Wiley-type mill for subsequent C and H analysis and calorific value determination. Total contents of C and H were determined by dry combustion using a VARIO EL-III Elemental® Analyzer.
Higher calorific value (HCV) was determined using an adiabatic bomb calorimeter (IKAWERNE, model C5000) according to ABNT/NBR 8633/84 guidelines (ABNT, 1984). Conversion to kilowatt-hour per hectare (kWh ha-1) was conducted according to the following
Equation 1:
E = (HCV / C1) . C2.DM
where E is the energy obtained from the burning of biomass (kWh ha-1), HCV is the higher calorific value (MJ kg-1), C1
is the coefficient to transform the MJ unit to kWh (1 kWh = 3.6 MJ), C2 is the average efficiency of boilers equal to 20% (Nogueira; Lora, 2003), and DM is the maize dry matter (kg ha-1).
Statistical analyses were performed using R software (R Development Core Team R, version 2.1.1). The data were tested for normality using the Kolmogorov-Smirnov test and homogeneity of variances was verified by the Bartlett test; when homogeneous, the variables were subjected to ANOVA. Regression analysis was used to evaluate the effect of N rates. Pearson correlation analysis was conducted to verify the relationship between some variables.
RESULTS AND DISCUSSION
Maize yield and biomass productivity
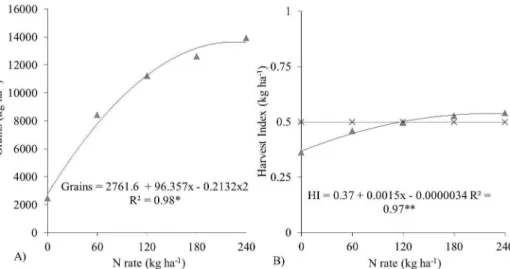
The maize grain yield was not influenced by the interaction between N fertilization rates and narrow row spacing or the isolated effect of narrow row spacing. The rate of N for maximum productivity, or maximum technical efficiency (MTE), of N was 226 kg ha-1 for
a grain yield of 13,647 kg ha-1 (Figure 1A). In a study
conducted by Farinelli and Lemos (2012) in a tropical region of Brazil, the MTE was 151 kg ha-1 N for a
grain yield of 8900 kg ha-1. The two results are similar
considering that the amounts of N needed to produce one ton of grain were 16.6 kg in our study and 17 kg in the previous study.
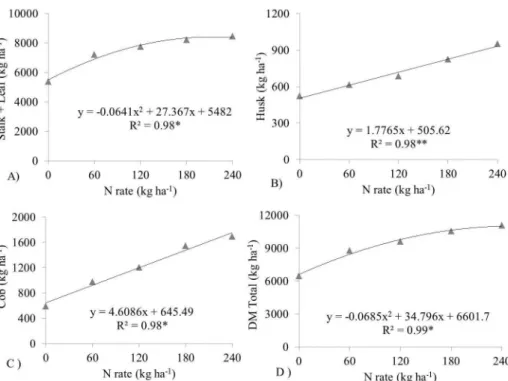
Higher doses of N showed higher biomass productivity of the plants (Figure 2). For the stalk+leaf biomass (Figure 2A), the MTE of Nwas 213.5 kg ha-1,
generating 8404 kg ha-1, whereas for the biomass of ear
husks and cobs treated with 240 kg ha-1 of N (Figures
2B and C), a linear increase with N was observed, with biomass productivity of 933 kg ha-1 and 1752 kg ha-1,
respectively. Variation in narrow row spacing had an effect on only the biomass of ear husks, which was greater at 0.8 m (765 kg ha-1) than at 0.4 m (672 kg ha-1) of inter-row
spacing. The total biomass, discounting grain production, increased 1.7 times with nitrogen fertilization, reaching values close to 11,000 kg ha-1 with the application of 254
kg N ha-1 (Figure 2D). Cobs presented the highest increase
in productivity (2.8 times) compared with that of the other parts of the plant (Figure 2C).
Harvest index (HI)
Narrow row spacing did not alter the HI. However, with increasing N doses, contribution to the total plant biomass decreased for stalks+leaves and husks and increased for cobs and grains (Table 1). Therefore, in addition to stimulating the production of grains (Figure 1A) and biomass (Figure 2), application of N interferes with biomass partitioning, favoring the production of grains at high doses.
The high increase in grain productivity (Figure 1A) in relation to biomass (Figure 2D) resulted in an increase in the harvest index (HI) from 0.36 to 0.54 with increasing N doses. Nitrogen rates higher than 117 kg ha-1 when the HI
was 0.5 (50% grains and 50% of the biomass) showed higher production of grains compared with biomass, regardless of the inter-row spacing method used (Figure 1B).
Pereira et al. (2011) obtained grain yields for two maize hybrids similar to that found in this study with application of 150 kg ha-1 N but with biomass distributed in
35, 9, 8, and 48% of stalks+leaves, husks, cobs, and grains, respectively. However, Kamanga et al. (2014) found no variation in the HI as a function of N application (max. 30 kg N ha-1), with a mean HI value of 45.2%.
Cobs and husks accounted for approximately 10% of the aboveground biomass of maize (Table 1), or approximately 20% of the biomass without grains. The removal of this amount of biomass (approximately 2000 kg ha-1) from cultivation areas will probably not have a negative
influences on the aspects of soil conservation that are inherent to the presence of this biomass on the ground, especially in systems without soil disturbance such as no tillage.
Figure 1: Grain yield and harvest index (ratio of production of grains to total aboveground biomass) of maize as
Figure 2: Dry matter of the stalk+leaf (A), husk (B), cob (C), and total biomass (D) of maize as a function of nitrogen
rate. (*; **) Statistically significant at 5% and 1% probability levels, respectively.
Table 1: Participation of stalk+leaf, husk, cob, and grains in shoot dry matter yield as a function of nitrogen rate.
N rate Stalk + Leaf Husk Cob Grains Kg ha-1
---%---0 52.8 5.2 5.8 36.3
60 44.2 3.8 6.0 46.0
120 40.5 3.6 6.3 49.6
180 36.7 3.7 6.9 52.7
240 35.0 3.9 7.0 54.1
Mean 41.8 4.0 6.4 47.7
Elemental analysis of carbon (C) and hydrogen (H)
Variation in inter-row spacing and treatment interactions did not affect the concentrations of C and H in the plants with different N fertilization rates. The mean concentrations of C were 40, 38, and 41% in the stalks+leaves, husks, and cobs, respectively, showing little variation between the plant parts.
Increased N rates provided a positive linear effect on the C concentration in all plant parts assessed (Figure 3). These increases were 2, 3.1, and 0.4% for cobs, stalks+leaves, and husks, respectively.
The contents of C and H found in this study are close to those observed by Protásio et al. (2012), ranging between 45% for C and 6.4% for H in maize husks, 47% for C and 6% for H in maize cobs, 38% for C and 5.1% for H in rice husks, 47% for C and 6.3% for H in sugar cane, and 48% for C and 6.3% for H in eucalyptus. High concentrations of C and H are important for selecting residual lignocellulosic materials for bioenergy production because of the energy value of elements and the positive correlation with the calorific value (Obernberger; Thek, 2004; Protásio et al., 2012).
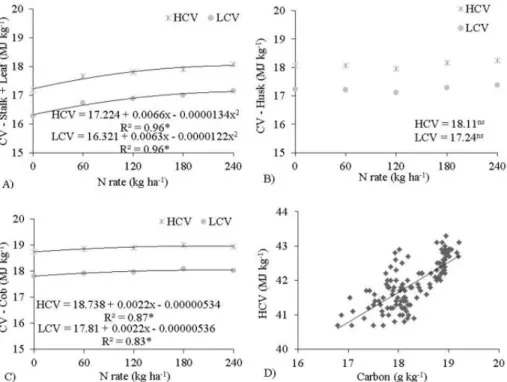
Higher (HCV) and lower (LCV) calorific value
Only the N application influenced the calorific value of maize biomass, with no effect of plant distribution on this variable. Whereas the HCV and LCV of husks were not influenced by the treatments (means of 18.11 and 17.24 MJ kg-1, respectively) (Figure 4B), the MTE of N for HCV
was 246 kg ha-1 in the stalks+leaves (Figure 4A) and 202
kg ha-1 in the cobs (Figure 4C). With these N levels, the
HCVs for the stalks+leaves and cobs were 18.02 and 18.95 MJ kg-1, respectively. The highest LCVs were obtained
with application of 258 kg ha-1 N for the stalks+leaves
(Figure 4A) and 203 kg ha-1 N (Figure 4C) for the cobs,
Figure 3: Concentration of carbon of the different parts
of the maize plant (stalk+leaf, husk, cob, and grains) as a function of nitrogen rate. ns = not significant, * and ** = statistically significant at 5% and 1% probability
levels, respectively.
Figure 4: Higher calorific value (HCV) and lower calorific value (LCV) of stalk+leaf (A), husk (B), and cob (C) and
correlation between carbon concentration and higher calorific value (HCV) of the aboveground biomass (D) of maize as a function of nitrogen rate. (*) Statistically significant at 5% probability level.
to those observed by Mullen et al. (2010) (17.80 MJ kg-1),
whereas the HCVs observed for the husks and cobs are higher than those found by Quirino et al. (2004) (15.62 MJ kg-1). The LCV found for cobs in this work
was similar to that reported by Ioannidou et al. (2009) (18.25 MJ kg-1).
The increase in HCV provided by N can be explained by the increased C concentration (Figure 3F) and the correlation between C concentration and the HCV (Figure 4D). The variation observed in both higher and lower calorific values did not correlate with the variation observed in H concentrations.
Considering the MTE for CV, the highest HCVs and LCVs were observed for the cobs, followed by the husks and stalks+leaves, which can be considered the preferred order for energetic use.
Similar to other lignocellulosic biomass feed stocks and residues, it appears that maize biomass also has potential for use in thermal energy production. Pordesimo, Edens and Sokhansanj, (2004) observed that regardless of the part of the maize plant and the stage of development, the HCV ranged from 16.75 to 20.93 MJ kg-1. A review
conducted by Parikh, Channiwala and Ghosal (2005) The HCV of total maize DM reported in the
literature is 18.57 MJ-1 kg (Morissette; Savoie; Villeneuve,
that analyzed the HCV measured in different solid fuels observed values of 18.2, 14.94, 15.19, and 18.64 MJ kg-1
for sugar cane bagasse, rice husks, eucalyptus bark, and eucalyptus wood, respectively.
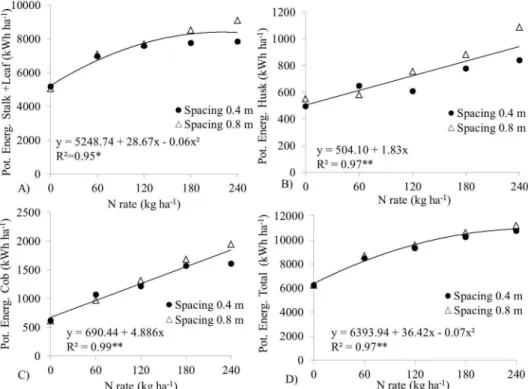
Bioenergy potential
In this study, the bioenergy potential, which considers CV and biomass production, was not altered by the interaction between the N rate and inter-row spacing for all plant parts evaluated. However, the effect of N rates was significant for all the parts evaluated (Figure 5), and 0.8 m of inter-row spacing presented higher potential than 0.4 m of spacing in the stalks+leaves– (7493 and 7069 kWh ha-1, respectively)
and husks (772 and 674 kWh ha-1, respectively).
Compared with the treatment without N topdressing, the MTE for the energy potential of the stalks+leaves was 239 kg ha-1 (8376 kWh ha-1) (Figure 5A), whereas the
energy potentials of the husks (965 kWh ha-1) and cobs
(1776 kWh ha-1) (Figure 5B and C) increased linearly as a
function of N rates by 184 and 290%, respectively. The MTE of N for energy potential was higher than that observed for the productivity of grains (226 kg ha-1) (Figure 1A), which is mainly due to the effect of N
application on the change in the contribution of each plant
part to the total biomass produced (Table 1). At high N doses, DM participation is lower than that of grains (Table 1; Figure 1B), and a higher dose of N is required to produce one kilogram of DM.
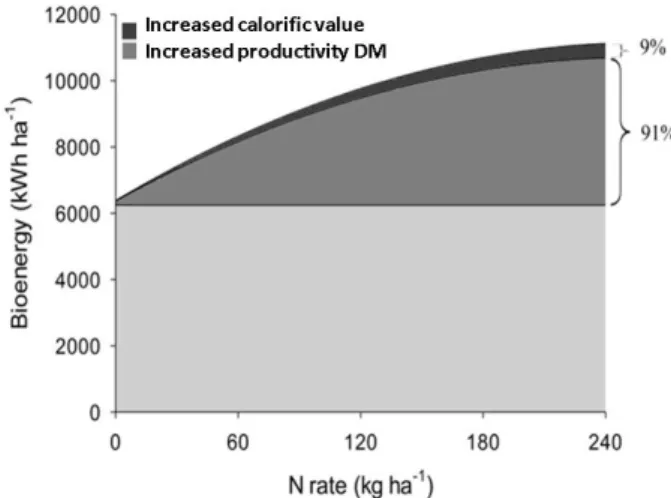
The energy potential of the whole maize shoot (stalk+leaf, cob and husk) (Figure 5D) was higher at the dose of 260 kg ha-1 N. At this dose, the estimated bioenergy
production was 11,131 kWh ha-1. This energy increase was
due to the increased HCV of the biomass (approximately 9%) and especially to the production of maize DM, which contributed to 91% of the observed increase (Figure 6).
Therefore, the residual biomass of maize may be an interesting supply source for small thermoelectric plants because, in addition to exploiting a food production residue, it does not require the use of agricultural areas exclusively for bioenergy generation.
Considering the MTE of N for a grain productivity of 226 kg ha-1 (Figure 1A), the DM production (Figure 2),
and the potential for energy generation (Figure 5) of each plant part, each kg of biomass could generate 1.03, 1.01, and 1.06 kWh of energy from the stalks+leaves, cobs, and husks, respectively. If the total plant DM, except for grains, was used (Figure 2D and 5D), 11,050 kWh ha-1
would be produced, and using only cobs and husks, it
Figure 5: Potential for bioenergy generation of stalk+leaf (A), husk (B), cob (C), and total biomass (D) of maize as
would be possible to generate 2712 kWh ha-1 of bioenergy.
Increased energy potential with nitrogen fertilization was also observed by Ning et al. (2012), who found that increasing the applied dose of N from 150 kg ha-1 to
300 kg ha-1 provided increases of 8.4, 4.73, and 8.5% in
DM, productivity of grains, and bioenergy, respectively.
CASSMAN, K. G.; LISKA, A. J. Food and fuel for all: Realistic or
foolish? Biofuels Bioproducts Biorefining, 1(1):18-23,
2007.
FAO. Food and Agriculture Organization of the United
Nations. 2016. Available in: http://ww.fao.org. Access in:
August, 19, 2016.
FARINELLI, R.; LEMOS, L. B. Topdressing nitrogen in maize
crop under consolidated conventional and no-tillage
systems.Pesquisa Agropecuária Tropical,
42(1):63-70, 2012.
IOANNIDOU, O. et al. Investigating the potential for energy,
fuel, materials and chemicals production from corn
residues (cobs and stalks) by non-catalytic and catalytic pyrolysis in two reactor configurations. Renewable and
Sustainable Energy Reviews,13(4):750-62, 2009.
IUSS WORKING GROUP WRB. WORLD REFERENCE BASE FOR SOIL RESOURCES 2014, update 2015 International soil classification system for naming soils and creating legends
for soil maps. World Soil Resources Reports No. 106. FAO:
Rome, Italy, 2015. 192p.
JOHNSON, J. M. F. et al. Biomass – Bioenergy crops in the
United States: A changing paradigm. The Americas
Journal of Plant Science and Biotechnology,
1(1):1-28, 2007.
KAMANGA, B. C. G. et al. Improving the efficiency of use of small amounts of nitrogen and phosphorus fertilizer on smallholder maize in central Malawi. Experimental Agriculture, 50(2):229-249, 2014.
MODOLO, A. J. et al. Performance of corn hybrids at the Southwest of Paraná under different row spacing. Revista
Ciência Agronômica, 41(3):435-441, 2010.
MORISSETTE, R.; SAVOIE, P.; VILLENEUVE, J. Combustion of corn stover bales in a small 146-kw boiler. Energies,
4:1102-1111, 2011.
MULLEN, C. A. et al. Bio-oil and bio-char production from corn
cobs and stover by fast pyrolysis. Biomass and Bioenergy,
34(1):67-74, 2010.
NING, T. et al. Nitrogen uptake, biomass yield and quality of intercropped spring- and summer-sown maize at different nitrogen levels in the North China Plain. Biomass and
Bioenergy, 47:91-98, 2012.
NOGUEIRA, L. A. H.; LORA, E. E. S. Dendroenergia:
Fundamentos e aplicações. Rio de Janeiro: 2th ed.
Interciência, 2003. 200p.
Figure 6: Total bioenergy production from maize
resulting from increased calorific value (CV) and productivity of dry matter (DM) as a function of
nitrogen rate.
CONCLUSIONS
Variation in inter-row spacing has little influence on biomass productivity and partitioning and consequently on maize potential for energy generation. In contrast, N application increased the productivity of grains and dry matter, the calorific power, and the potential for energy generation from maize. Maximum grain yield was obtained with application of 226 kg ha-1 N, resulting in 13,647 kg ha-1
of grain yield and 10,968 kg ha-1 of total biomass. This
biomass presents an energy potential of 11,050 kWh ha-1.
Considering the use of only husks and cobs, it is possible to generate 2712 kWh ha-1 of bioenergy.
REFERENCES
ABNT - Associação Brasileira de Normas Técnicas. NBR 8633
Carvão vegetal - Determinação do poder calorífico. São
Paulo: ABNT. 1984.13p.
AL-NAGGAR, A. M. M. et al. Maize response to elevated plant density combined with lowered N-fertilizer rate is genotype-dependent. The Crop Journal, 3(2):96-109,
OBERNBERGER, I.; THEK, G. Physical characterization and chemical composition of densified biomass fuels with
regard to their combustion behavior. Biomass and
Bioenergy, 27(6):653-669, 2004.
PARIKH, J.; CHANNIWALA, S. A.; GHOSAL, G. K. A correlation for calculating HHV from proximate analysis of solid fuels.
Fuel, 84(5):487-494, 2005.
PEREIRA, J. L. A. et al. Evaluation of structural plant components of maize hybrids harvested at different phenological stages.
Revista Brasileira de Milho e Sorgo, 10(1):47-55, 2011.
PFAUMANN, P. Biocombustibles¿ La fórmula mágica para
las economías rurales de ALC? Washington DC:
Inter-American Development Bank, Rural Development Unit, 2006. 23p.
PORDESIMO, L. O.; EDENS, W. C.; SOKHANSANJ, S. Distribution
of aboveground biomass in corn stover. Biomass and
Bioenergy, 26(4):337-343, 2004.
PROTÁSIO, T. P. et al. Canonical correlations between chemical and energetic characteristics of lignocellulosic wastes.
Cerne, 18(3):433-439, 2012.
QUIRINO, W. F. et al. Poder calorífico da madeira e de resíduos
lignocelulósicos. Biomassa e Energia, 1(2):173-182, 2004.
SCHIMIDT, J. P. et al. Hillslope variability in corn response to nitrogen linked to in-season soil moisture redistribution.
Agronomy Journal, 99:229-237, 2007.
SILVA, F. C. Manual de análises químicas de solos, plantas e fertilizantes. Brasília: 2th Ed. Embrapa Solos, 2009. 627p.
USDA - UNITED STATE DEPARTMENT OF AGRICULTURE. Near
Record Safrinha Crop Increases Glogal Corn Supply.
2016. Available in: <http://www.usda.gov/wps/portal/usda/ usdahome> Access in: March 10, 2016.
VARVEL, G. E.; WILHELM, W. W. Cob biomass production in the western corn belt. BioEnergy Research,