Acta Scientiarum
http://www.uem.br/acta ISSN printed: 1806-2636 ISSN on-line: 1807-8672
Doi: 10.4025/actascianimsci.v37i2.25116
Concentrate levels of crossbred bulls slaughtered at 16 or 22 months:
performance and carcass characteristics
Adriana Pinto1, Rodrigo Augusto Cortêz Passetti1*, Ana Guerrero1,2, Dayane Cristina Rivaroli1, Daniel Perotto3 and Ivanor Nunes do Prado1
1
Departamento de Zootecnia, Universidade Estadual de Maringá, Av. Colombo, 5790, 87020 -900, Maringá, Paraná, Brazil. 2Departamento de Produção Animal e Ciência de Alimentos, Faculdade de Veterinária da Universidade de Zaragoza, Zaragoza, Espanha, União Européia. 3
Departamento de Ciência Animal, Instituto Agronômico do Paraná, Ponta Grossa, Paraná, Brazil. *Author for correspondence. E-mail: [email protected]
ABSTRACT. This study was performed to assess the animal performance of 97 bulls, ½ Purunã vs. ½ Canchim, that were slaughtered at 16 (16M) or 22 (22M) months with three concentrate levels (0.8, 1.2, and 1.6%) of body weight (BW). The initial body weight was lower for the 16M bulls. The final body weight and hot carcass weights were similar between the two slaughter ages. The hot carcass dressing was higher for 22M bulls. The average daily gain was higher for 16M bulls. The feed intake and dry matter feed conversion were similar between 16 and 22M bulls. The carcass length, marbling, and bone percentage were lower for 16M bulls. However, the Longissimus dorsi muscle area was higher for 16M bulls. The leg length, cushion thickness, fat thickness, conformation, colour, texture, muscle percent, and fat percent were similar between 16 and 22M bulls. The final and hot carcass weights were lower for bulls that were fed with 0.8% of BW. The carcass dressing was similar for the three concentrate levels. The average daily gain was higher for bulls that were fed with 1.6% of BW of concentrate and lower for those that were fed with 0.8%. The concentrate levels had no effect on carcass characteristics, feed intake, and dry matter conversion.
Keywords: bovine, feed intake, crossbreeding, Longissimus.
Níveis de concentrado na dieta de touros abatidos aos 16 ou 22 meses: desempenho e
características de carcaça
RESUMO. Este estudo foi realizado para avaliar o desempenho animal de 97 touros, ½ Purunã vs ½ Canchim, que foram abatidos aos 16 (16M) ou 22 (22M) meses, com três níveis de concentrado (0,8, 1,2 e 1,6%) do peso vivo. O peso inicial foi menor para os touros 16M. O peso final e peso de carcaça quente foram similares entre as duas idades de abate. O rendimento de carcaça quente foi maior para os touros 22M. O ganho médio diário foi maior para os touros 16M. O consumo de ração e conversão alimentar da matéria seca foi semelhante entre os touros 16 e 22M. O comprimento de carcaça, marmorização e percentagem de ossos foram menores para os touros de 16M. No entanto, a área do músculo Longissimus dorsi foi maior para os touros de 16M. O comprimento da perna, espessura de coxão, espessura de gordura, conformação, cor, textura, percentual de músculo e gordura foram semelhantes entre os touros de 16 e 22M. Os pesos finais e de carcaça quentes foram menores para os touros, que foram alimentados com 0,8% de concentrado do PV. O rendimento de carcaça foi semelhante para os animais dos três níveis de concentrado. O ganho médio diário foi maior para os touros, que foram alimentados com 1,6% do peso vivo de concentrado e menor para aqueles que foram alimentados com 0,8%. Os níveis de concentrado não tiveram efeito sobre as características de carcaça, ingestão e conversão de matéria seca.
Palavras chave: bovinos, consumo, cruzamentos, Longissimus.
Introduction
The Brazilian beef herd is essentially composed of Bos taurus indicus – zebu (ANUALPEC, 2014),which are slaughtered at an advanced age between three and four years; they have a lower quality meat than Bos taurus taurus animals and their crossbreeds (Ducatti et al., 2009; Maggioni et al.,
Acta Scientiarum. Animal Sciences Maringá, v. 37, n. 2, p. 149-157, Apr.-June, 2015
Rotta et al., 2009).
One of the alternatives for finishing young animals is at the feedlot, which partly represents the addiction to technology among cattle raisers due to the high volume, due to the high volume of information offered by research centres. Thus, it is possible to slaughter animals between 14 to 18 months old and to obtain standardized carcasses of high quality (Ito et al., 2010; Ito et al., 2012a, b).
On the other hand, in order to optimize the livestock systems, it is necessary to adjust the quantity and quality of the ration based on animals' requirements (NRC, 2000). The voluntary intake is the determinant for a balanced diet, and establishing a strategy allows for better cattle performance (Forbes, 1988; Maggioni et al., 2009).The concentrate level in cattle diets determines the animal performance, feed efficiency, and carcass characteristics, with better results in finished cattle when they are fed with high concentrate levels (Silveira et al., 2009). Thus, it is necessary to determine the slaughter age and concentrate levels that are the most adequate for the requirements of crossbred cattle finished in a feedlot in order to promote a better use of nutrients, animal response, and carcass quality.
The objective of this study was to evaluate animal performance and carcass characteristics of ½ Purunã vs. ½ Canchin bulls slaughtered at 16 or 22 months and fed with three concentrate levels in the diets (0.8, 1.2, or 1.6% in relation to the BW).
Material and methods
Local animal management and sampling
This work was conducted at a model farm at the experimental station of the Agronomic Institute of Paraná - Iapar, located at Ponta Grossa city, south of Brazil. Ninety-seven ½ Purunã vs. ½ Canchim bulls were divided according to their age (16 - 16 or 22months- 22M) and were fed with three concentrate levels (0.8, 1.2, or 1.6% of BW). In the16M system from calving to 90 days, the calves were kept with the cows in annual winter pastures. After weaning (90 days), the calves were kept in
Hemarthria altissima pastures with concentrate supplementation (1.5 kg d-1 of the mix consisting of
73% of grain ground corn + 25% of soybean meal + 2% mineral) during the winter. The bulls were housed in collective pens with an average age of 10 months.
At twelve months, the bulls were moved to individual pens and remained there during the next four months. In the 22M system, from calving to 90
days, the calves were kept with the cows in annual winter pastures. After weaning (90 days), the calves were kept in Hemarthria altissima pastures with concentrate supplementation (1.5 kg d-1 of the mix
consisting of 73% of grain ground corn + 25% of soybean meal + 2% mineral) during the winter. At 18 months, the animals were housed individually and remained there during the next four months.
The 16 and 22M bulls that were fed concentrate at 0.8% of BW received a diet with a forage:concentrate ratio of 73:27 and 72:28, respectively. The 16 and 22M bulls that were fed concentrate at 1.2% of BW received a diet with a forage:concentrate ratio of 59:41. The 16 and 22M bulls that were fed concentrate at 1.6% of BW received a diet with a forage:concentrate ratio of 47:53 and 44:56, respectively. The forage consisted of maize silage, and concentrate was composed of 73% of grain ground corn + 25% of soybean meal+2% mineral.
The initial body weight (IBW) in the individual pens for the 16M bulls that were fed concentrate at 0.8% of BW was 269.5 ± 11.8 kg, while bulls that were fed concentrate at 1.2% of BW were 269.0 ± 8.5 kg, and bulls that were fed concentrate at 1.6% of BW were 252.3 ± 10.3 kg. For the 22M group, the IBW for bulls that were fed concentrate at 0.8% of BW was 291.1 ± 10.9 kg, bulls that were fed concentrate at 1.2% of BW were 301.9 ± 12.2 kg, and bulls that were fed concentrate at 1.6% of BW were 280.2± 10.9 kg.
In the feedlot, the bulls remained in individually covered pens with an 8 m2 area, concrete floor,
forage, concentrate and mineral feeder, and a drinker that was regulated by an automatic float system. The bulls were weighed at the beginning of the experiment. After, periodic weights were conducted every 28 days following a solid and liquid fasting period of 16h, which was obtained by removing the feed at 16h of the previous day.
The feed was managed in two daily meals at 8 and at 14h. The next morning before the first meal, the orts were removed to calculate the feed intake and the daily adjustment of the silage that was provided. The feed was adjusted to obtain 5% of orts of the total that was provided. The mineral supplement was provided freely in individual salt feeder, and suited to meet the animals’ requirements.
Animal performance
Cattle feeding on feedlot 151
experimental period. The DM intake (DMI - kg d-1)
was calculated based on the DM percentage that was offered and the orts, according to the equation DMI kg = (%DMoffered - %DMorts)/FBW, The DMI per 100 kg of BW was calculated based on the rate between the daily dry matter intake divided by the cattle average weight and multiplied by 100.
The feed conversion (FC) was calculated as the ratio between the intake and the animal performance, according to the equation FC = (DMI/ADG).
Carcass characteristics
At the end of the experiment, the bulls were weighed after 16h of fasting from solids and liquids and were slaughtered at a commercial slaughter house Curitiba, Paraná State, Brazil. The bulls were sensitized with a compressed air pistol and were bled from the vessels of neck after which the head, leather, viscera, tail, claws, diaphragm, and excess visceral fat were removed. Next, carcasses were divided medially through the sternum and vertebral column. The carcasses were chilled for 24h at 4°C. After chilling them, the right side of the carcass was used to determine the quantitative characteristics.
The hot carcass weight (HCW) was determined soon after slaughter and prior to chilling the carcass. The hot carcass dressing (HCD) is the individual animal dressing percentage and was defined by the ratio HCW:BW. The conformation (CON) was determined after excluding fat thickness, where the highest value indicated the best conformation. CON can be considered superior, very good, good, regular, poor, or inferior; ratings may also be reported as plus, average, and minus. The carcass length (CLE) was measured from the skull board to the pubic bone on the anterior side of the first rib. The leg length (LLE) was evaluated with a wooden compass with metallic edges to measure the distance from the anterior border of the pubic bone to a middle point on the tarsal bone.
The cushion thickness (CTH) was determined by using a wooden compass with metallic edges that measured the distance between the lateral face and the median at the superior part of the cushion. The cushion is the muscle (Biceps femoris). The fat cover (FAT) was measured via a caliper, between the 12 and 13th ribs on Longissimus muscle (LM), and
averaged over three points. The Longissimus muscle area (LMA) was measured on the right side of the carcass; after a cross-section cut was made between the 12 and 13thribs using a compensating planimeter
that measured the areas of irregularly shaped objects. The LMA of 100 kg carcass-1 (LMC) is defined by
the ratio LMA:HCW, multiplied by 100.
The marbling (MAR) was measured in the LM between the 12 and 13thribs by using the Brazilian
scoring system (18 to 16 - abundant, 15 to 13 - moderate, 12 to 10- mean, 9 to 7 -small, 6 to 4- light, and 3 to 1 -traces). The texture (TEX) was determined by the fascicle size (muscular “grain” size) and was evaluated subjectively on a point scale (very fine - 5, fine - 4, slight - 3, coarse - 2, and very coarse - 1). Muscle color (COL) was analyzed after a 24-hour carcass chilling period. Color was evaluated according to a point scale 30 min. after a cross-sectional cut was made on the LM between the 12 and 13thribs (cherry
red - 5, red - 4, slightly red - 3, dark red - 2, and dark - 1). Muscle, fat, and bone were physically separated from the LM section, collected between the 10 and 12thribs, and were calculated individually according to
Hankins and Howe (1946) as follows:
%M ¼ 6:292 þ 0:910 X1
%F ¼ 1:526 þ 0:913 X2
%B ¼ 2:117 þ 0:860 X3
where:
X1, X2, and X3 represent muscle (MUS%), fat (FAT%), and bone (BON%) percentages, respectively.
Statistical analysis
The ninety-seven animals were distributed in a completely randomized design in a factorial 3 x 2 consisting of three levels of concentrate (0.8, 1.2, and 1.6% concentrate in relation to the body weight) and two finishing systems (16 - 16 or 22M- 22 months). The results were submitted to the analysis of variance (ANOVA) and the averages were compared by the T test (5%) using SAS (2004).
Results and discussion
No interaction was found for IBW, FBW, ADG, HCW, and HCD between the slaughter age (16M and 22M) and concentrate levels in the diets (0.8, 1.2, and 1.6% of BW, Table 1). Thus, the results were presented and discussed as principal effects.
Acta Scientiarum. Animal Sciences Maringá, v. 37, n. 2, p. 149-157, Apr.-June, 2015
Table 1. Animal performance and carcass characteristics of ½ Purunã vs. ½ Canchim bulls finished at two ages and with three levels of concentrate in the diets.
Concentrate level, kg BW-1
Item Age 0.8 1.2 1.6 Mean SEM P<
N 28 37 32
Initial body weight, kg 16M 269.5 269.0 252.3 263.6 10.18 Ns
22M 291.1 301.9 280.2 291.1 11.38 Ns
Mean 280.3 285.5 266.3 277.4 7.67 Ns
SEM 10.20 9.89 9.92
p < * * * *
Final body weight, kg 16M 469.7b 487.0a 479.1a 478.6 8.52 *
22M 465.5b 483.5a 484.1a 477.7 9.89 *
Mean 467.6b 485.3a 481.6a 478.2 6.56 *
SEM 8.21 7.76 8.32
p < Ns Ns Ns Ns
Average daily gain, kg 16M 1.51 1.60 1.72 1.61 0.07 Ns
22M 1.16 1.25 1.29 1.23 0.06 Ns
Mean 1.33 1.43 1.51 1.42 0.06 Ns
SEM 0.06 0.05 0.05
p < * * * *
Hot carcass weight, kg 16M 257.2b 268.8a 265.9a 264.0 5.48 *
22M 251.3b 261.8a 257.8a 257.0 6.52 *
Mean 254.3b 265.3a 261.9a 260.5 4.15 *
SEM 5.32 5.22 5.87
p < Ns Ns Ns Ns
Hot carcass dressing, % 16M 54.7 55.2 55.5 55.1 0.45 Ns
22M 54.0 54.1 53.3 53.8 0.44 Ns
Mean 54.4 54.6 54.4 54.5 0.45 Ns
SEM 0.41 0.38 0.39
p < * * * *
Ns, not significant. Means followed by different letters are different (*p < 0.05).
This result shows that bulls can be slaughtered at 16 months old when using the feedlot system. The nutrient use of younger animals is better than that of older animals. Due to this, younger animals gain more weight. Results similar to those found in this paper were observed by Kuss et al. (2009) in young bulls. However, Freitas et al. (2008) and Pazdiora et al. (2009) did not observe an effect on ADG between young bulls and bulls.
The HCW did not change due to the slaughter age because no difference was found in the FBW. Similar results were observed by Pazdiora et al. (2009) in the HCW, which was justified by the similarity in the FBW between young bulls and bulls. The HCD was higher (p < 0.05) for 16M bulls than for 22M bulls. Santos et al. (2008) evaluated the carcass characteristics of super early and early animals, and reported a superior HCD in young animals. The higher value HCD for the 16M bulls may be attributed to an increase in the gastrointestinal tract in early bulls (Menezes et al., 2007).
The bulls started the experiment with similar IBW; however, bulls that were fed concentrate at 1.2 and 1.6% of BW presented with a higher FBW than bulls that were fed concentrate at 0.8% of BW. Most of the data in the literature shows that the FBW is determined by the level of concentrate in the diet (El-Memari Neto et al., 2003; Gesualdi Júnior et al.,
2000; Silveira et al., 2009). A higher value FBW is determined by a higher energy intake, since high levels of forage can inhibit the food intake through physical effects (Bogomolov et al., 2013; Mertens, 1994).
The ADG obtained from animals that were fed with higher concentrate levels in the diets occurred because of the use of a higher quality diet for these animals. Remember that CP and NDF intake were higher for cattle that were fed with higher concentrate levels in the diets, once a food substitution occurred without changing the DMI; the maize silage with lower CP and NDF content for concentrate (corn + soybean). However, Zervoudakis et al. (2001) did not observe a difference for ADG in animals that were fed with 1 or 2% of concentrate in the diets, although it was expected according to other authors that a higher ADG value would be observed with diets containing higher concentrate levels. On the other hand, Silva et al. (2005) reported a linear increase in the ADG with the increase in concentrate levels, with greater gains when diets were composed of 65% of concentrate. According to (Costa et al., 2002; Resende et al., 2001), the ADG increases for animals finished on a feedlot when the concentrate level in the diet is incremented.
Cattle feeding on feedlot 153
value acquired and the operational costs, since carcasses with different weights demand the same labour and the same processing time.
The HCD was similar among the concentrate levels 0.8, 1.2, and 1.6% of BW. However, (Costa et al., 2002; Gesualdi Júnior et al., 2000), when evaluating the concentrate level effects on the carcass dressing, observed a linear increase, but when the carcass dressing was expressed in relation to the empty body weight, no difference among the concentrate levels was found. Similarly, Silva et al. (2002) found that the principal factor influencing the increase in the carcass dressing was the linear decrease of the gastrointestinal weight when the concentrate in the diets was increased, due to the fact that animals that are fed with higher levels of concentrate presented with higher digestibility. Although, no effects on the animals carcass dressing were identified by Steen and Kilpatrick (2000) by the concentrate level in the diet.
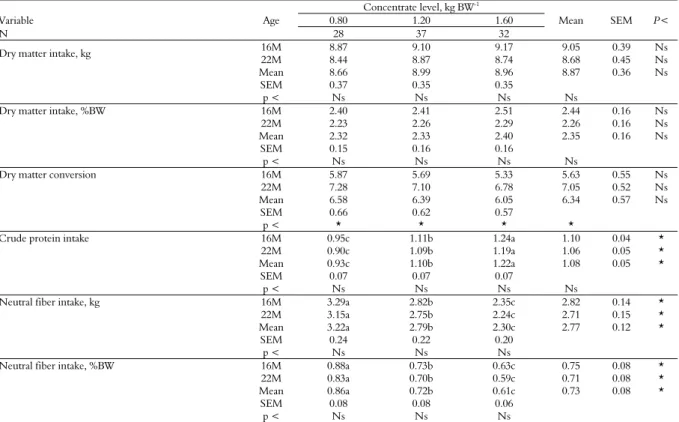
There was no interaction for the DMI, DMI 100 kg-1, CPI, NDF, NDFI, and NDFI 100 kg-1 (Table 2).
The DMI was similar between 16 and 22M bulls. Corroborating with this result, Pacheco et al. (2006) did not observe a difference in the DMI between cattle finished on a feedlot and slaughtered at two different ages: super early and early. Likewise, the age difference between the two categories that
were reviewed was not significant enough to influence the DMI. The DMI in relation to the BW (2.35%) has to be considered normal for cattle finished on the 16 and 22M systems and fed with a diet containing rations of forage and concentrate close to 50%.
The 16M bulls presented with a better DMC when compared) to 22M bulls. The dry matter feed conversion was 6.34 kg of DM for each kg of bodyweight. In general, young bulls (24 months or lower) originating from Bos Taurus vs Bos indicus
crossbreeding, finished on feedlot, and fed with a diet containing high protein levels and high energetic density presented with a DMC of 6 to 7 kg of DM for each kg of ADG.
The average CPI of 1.08 kg d-1 was close to the
recommended value of NRC (2000) for animals finished on a feedlot; they were expected to earn 1.30 to 1.50 kg d-1, as was the case in this experiment.
Furthermore, the average NDFI (0.73% of BW) was under the maximum levels that are considered to inhibit cattle intake on a feedlot when feeding concentrate at 1.2% of BW (Mertens, 1994). Thus, independent of the rearing system, the NDF level in the diets did not interfere with cattle food intake. The intake of NDF was low due to the high quality of the maize silage that was used (50% of FND).
Table 2. Animal performance of ½ Purunã vs. ½ Canchim bulls finished at two ages and with three levels of concentrate in the diets.
Concentrate level, kg BW-1
Variable Age 0.80 1.20 1.60 Mean SEM P<
N 28 37 32
Dry matter intake, kg 16M 8.87 9.10 9.17 9.05 0.39 Ns
22M 8.44 8.87 8.74 8.68 0.45 Ns
Mean 8.66 8.99 8.96 8.87 0.36 Ns
SEM 0.37 0.35 0.35
p < Ns Ns Ns Ns
Dry matter intake, %BW 16M 2.40 2.41 2.51 2.44 0.16 Ns
22M 2.23 2.26 2.29 2.26 0.16 Ns
Mean 2.32 2.33 2.40 2.35 0.16 Ns
SEM 0.15 0.16 0.16
p < Ns Ns Ns Ns
Dry matter conversion 16M 5.87 5.69 5.33 5.63 0.55 Ns
22M 7.28 7.10 6.78 7.05 0.52 Ns
Mean 6.58 6.39 6.05 6.34 0.57 Ns
SEM 0.66 0.62 0.57
p < * * * *
Crude protein intake 16M 0.95c 1.11b 1.24a 1.10 0.04 *
22M 0.90c 1.09b 1.19a 1.06 0.05 *
Mean 0.93c 1.10b 1.22a 1.08 0.05 *
SEM 0.07 0.07 0.07
p < Ns Ns Ns Ns
Neutral fiber intake, kg 16M 3.29a 2.82b 2.35c 2.82 0.14 *
22M 3.15a 2.75b 2.24c 2.71 0.15 *
Mean 3.22a 2.79b 2.30c 2.77 0.12 *
SEM 0.24 0.22 0.20
p < Ns Ns Ns
Neutral fiber intake, %BW 16M 0.88a 0.73b 0.63c 0.75 0.08 *
22M 0.83a 0.70b 0.59c 0.71 0.08 *
Mean 0.86a 0.72b 0.61c 0.73 0.08 *
SEM 0.08 0.08 0.06
p < Ns Ns Ns
Acta Scientiarum. Animal Sciences Maringá, v. 37, n. 2, p. 149-157, Apr.-June, 2015
The average DMI was similar to the values that were observed for young cattle finished on a feedlot and fed with a ration rich in nitrogen and energy (Véras et al., 2000). The NRC (2000) indicates that DMI should be between 2.3 to 2.5% of BW per day. Carvalho et al. (1997), when worked with concentrate levels of 20, 32.5, 57.5, and 70%, did not verify changes in the DMI as a result of the concentrate levels in the diets. The control of the food intake is a result of several mechanisms that are interrelated and integrated on the precise response on feed (Véras et al., 2000). The DMI is controlled by physiological, physical, and psychogenic factors. Dias et al. (2000) confirmed that the domination of one control mechanism of food intake over another is associated with the diet quality, the energy content, and digestibility, but the correlation with food intake can be positive or negative.
The higher CPI for high concentrate levels was calculated based on the CP content in the concentrate, since the increase in the concentrate levels in the diets occurred due to the substitution of forage (maize silage) for concentrate (corn + soybean). With a lower concentrate level in the diet (0.8% of BW), the CPI was less than the NRC (2000) concentrate level requirements for cattle in this animal category. On the other hand, for the higher concentrate level in the diet (1.6% of BW),the CPI was greater than the levels recommended by the NRC (2000). Likewise, the intermediate concentrate level in the diet (1.2% BW) met the recommendations of the NRC (2000) for beef cattle.
The higher NDFI for cattle that were fed with lower concentrate levels is related to a higher forage intake (maize silage), since an increase in the concentrate level in the diet reduced the maize silage intake, which represents the higher NDF content in terms of composition than the concentrate. However, NDF was lower (0.73% of BW) due to the quality of the maize silage and concentrate levels in the diets. Thus, no interference was observed by the FND on the feed intake of cattle on a feedlot.
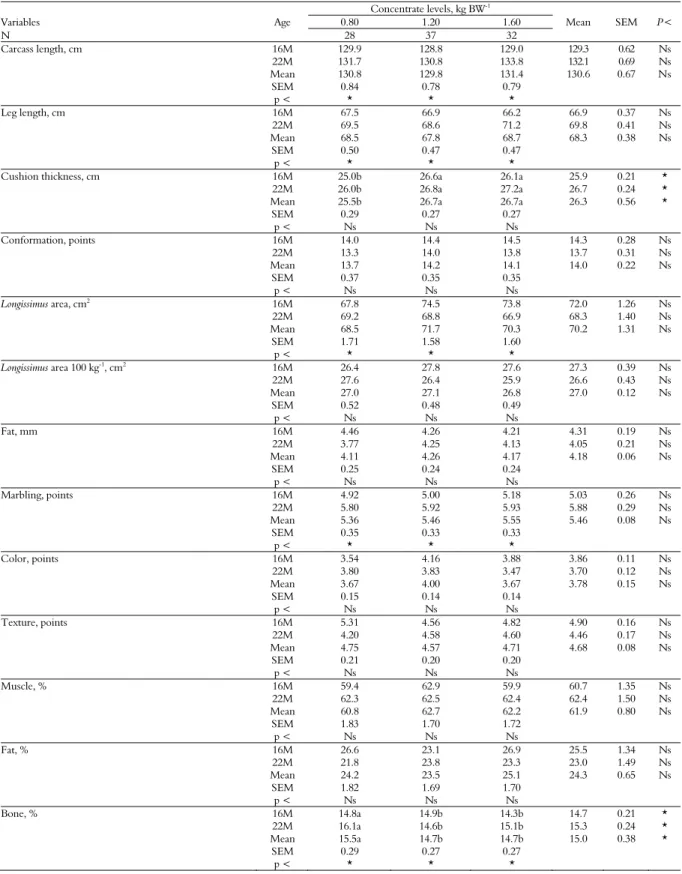
The carcass length (CLE) and the leg length (LLE) were higher for 22M bulls than 16M bulls (Table 3). This difference occurred because 22M bulls were older and presented with greater bone and muscle development than the 16M bulls. The Longissimus dorsi muscle area (LMA) value was higher (p < 0.05) for 16M bulls than 22M bulls; however, when LMA was analyzed while considering the carcass weight, no difference was observed between 16 and 22M. Opposite to these results, Santos et al. (2008) observed that super early
cattle presented with a higher LMC value than early cattle.
The FAT was similar between 16 and 22M bulls. In general, cattle finished in a feedlot with high protein and energy content diets are slaughtered and found with 3 to 4 mm of fat (Rotta, et al., 2009a). Brazilian market requirements stipulate that cattle must have between 3 to 6 mm of FAT. This way, the 16 and 22M bulls meet the demands of the markets in Brazil. A greater amount of marbling in 22M bulls is related to the higher age of these animals. In general, cattle that are slaughtered at an advanced age present with higher intramuscular fat deposits, so they also have higher marbling (ROTTA et al., 2009a and b).
The COL, TEX, MUS%, and FAT% were similar between the 16 and 22M bulls. These variables are similar to the values observed in crossbred cattle, finished on a feedlot, and fed with diets containing high protein and energy contents (Rotta et al., 2009b). Thus, the slaughter age has little influence on the COL, TEX, MUSC%, and FAT% when cattle are slaughtered earlier than 24 months of age. On the other hand, cattle slaughtered at an earlier age (16M -16 months) present with a higher percentage of bone, since the bone tissue is deposited at a younger age.
Cattle feeding on feedlot 155
carcass. Similar results were observed by F. F. Silva et al. (2002). Different levels of concentrate in the diets have little influence over the carcass
characteristics of ½ Purunã vs. ½ Canchin cattle. Only two variables were influenced by the three concentrate levels that were used in the animals diet.
Table 3. Carcass characteristics of animals ½ Purunã vs. ½ Canchin slaughtered at three weights and two finishing systems.
Concentrate levels, kg BW-1
Variables Age 0.80 1.20 1.60 Mean SEM P<
N 28 37 32
Carcass length, cm 16M 129.9 128.8 129.0 129.3 0.62 Ns
22M 131.7 130.8 133.8 132.1 0.69 Ns
Mean 130.8 129.8 131.4 130.6 0.67 Ns
SEM 0.84 0.78 0.79
p < * * *
Leg length, cm 16M 67.5 66.9 66.2 66.9 0.37 Ns
22M 69.5 68.6 71.2 69.8 0.41 Ns
Mean 68.5 67.8 68.7 68.3 0.38 Ns
SEM 0.50 0.47 0.47
p < * * *
Cushion thickness, cm 16M 25.0b 26.6a 26.1a 25.9 0.21 *
22M 26.0b 26.8a 27.2a 26.7 0.24 *
Mean 25.5b 26.7a 26.7a 26.3 0.56 *
SEM 0.29 0.27 0.27
p < Ns Ns Ns
Conformation, points 16M 14.0 14.4 14.5 14.3 0.28 Ns
22M 13.3 14.0 13.8 13.7 0.31 Ns
Mean 13.7 14.2 14.1 14.0 0.22 Ns
SEM 0.37 0.35 0.35
p < Ns Ns Ns
Longissimus area, cm2
16M 67.8 74.5 73.8 72.0 1.26 Ns
22M 69.2 68.8 66.9 68.3 1.40 Ns
Mean 68.5 71.7 70.3 70.2 1.31 Ns
SEM 1.71 1.58 1.60
p < * * *
Longissimus area 100 kg-1, cm2 16M 26.4 27.8 27.6 27.3 0.39 Ns
22M 27.6 26.4 25.9 26.6 0.43 Ns
Mean 27.0 27.1 26.8 27.0 0.12 Ns
SEM 0.52 0.48 0.49
p < Ns Ns Ns
Fat, mm 16M 4.46 4.26 4.21 4.31 0.19 Ns
22M 3.77 4.25 4.13 4.05 0.21 Ns
Mean 4.11 4.26 4.17 4.18 0.06 Ns
SEM 0.25 0.24 0.24
p < Ns Ns Ns
Marbling, points 16M 4.92 5.00 5.18 5.03 0.26 Ns
22M 5.80 5.92 5.93 5.88 0.29 Ns
Mean 5.36 5.46 5.55 5.46 0.08 Ns
SEM 0.35 0.33 0.33
p < * * *
Color, points 16M 3.54 4.16 3.88 3.86 0.11 Ns
22M 3.80 3.83 3.47 3.70 0.12 Ns
Mean 3.67 4.00 3.67 3.78 0.15 Ns
SEM 0.15 0.14 0.14
p < Ns Ns Ns
Texture, points 16M 5.31 4.56 4.82 4.90 0.16 Ns
22M 4.20 4.58 4.60 4.46 0.17 Ns
Mean 4.75 4.57 4.71 4.68 0.08 Ns
SEM 0.21 0.20 0.20
p < Ns Ns Ns
Muscle, % 16M 59.4 62.9 59.9 60.7 1.35 Ns
22M 62.3 62.5 62.4 62.4 1.50 Ns
Mean 60.8 62.7 62.2 61.9 0.80 Ns
SEM 1.83 1.70 1.72
p < Ns Ns Ns
Fat, % 16M 26.6 23.1 26.9 25.5 1.34 Ns
22M 21.8 23.8 23.3 23.0 1.49 Ns
Mean 24.2 23.5 25.1 24.3 0.65 Ns
SEM 1.82 1.69 1.70
p < Ns Ns Ns
Bone, % 16M 14.8a 14.9b 14.3b 14.7 0.21 *
22M 16.1a 14.6b 15.1b 15.3 0.24 *
Mean 15.5a 14.7b 14.7b 15.0 0.38 *
SEM 0.29 0.27 0.27
p < * * *
Acta Scientiarum. Animal Sciences Maringá, v. 37, n. 2, p. 149-157, Apr.-June, 2015 Conclusion
To conclude the feedlot system of 120 days can be used to finish the 16 and 22M bulls without changing the slaughter weight. However, it is not easy to determine which system may be the most effective for finishing cattle, since changes in the desired carcass characteristics can occur. Furthermore, different concentrate levels in the diets of young bulls finished at 16 or 22M can be used without changing animal performance, but they do contribute to better food efficiency in cattle that are fed with lower concentrate contents in the diet. Concentrate level does not change carcass characteristics of cattle in both finishing system. Thus, the concentrate level in cattle diets have to be determined according to the ratio of costs/benefits.
References
ANUALPEC. (2014). Anuário da Pecuária Brasileira (20th ed. Vol. 1). São Paulo, SP, Brasil: Instituto FNP. Arboitte, M. Z., Restle, J., Alves Filho, D. C., Brondani, I.
L., Pacheco, P. S., Menezes, L. F. G. & Perottoni, J. (2004). Composição física da carcaça, qualidade da carne e conteúdo de colesterol no músculo Longissimus dorsi de novilhos 5/8 Nelore-3/8 Charolês terminados em confinamento e abatidos em diferentes estádios de maturidade. Revista Brasileira de Zootecnia, 33(4), 959-968.
Berg, R. T. & Butterfield, R. M. (1976). New concepts of cattle growth (Vol. 240): Sydney University Press Sydney.
Bogomolov, K. V., Bordachev, A. V. & Grabski, J. (2013).
Instrumental insemination of queen bees by using modern technical devices (Vol. 1). Ryazan: Publishing house Ryazan.
Carvalho, A. U., Valadares Filho, S. C. & Silva, J. F. C. (1997). Níveis de concentrado em dietas de zebuínos. 1. Consumo e digestibilidade aparente. Revista Brasileira de Zootecnia, 26(5), 986-995.
Costa, E. C., Restle, J., Pascoal, L. L., Vaz, F. N., Alves Filho, D. C. & Arboitte, M. Z. (2002). Desempenho de novilhos Red Angus superprecoces, confinados e abatidos com diferentes pesos. Revista Brasileira de Zootecnia, 31(1), 129-138.
Dias, H. L. C., Valadares Filho, S. C., Silva, J. F. C., Paulino, M. F., Cecon, P. C., Leão, M. I. & Oliveira, R. V. (2000). Consumo e digestões totais e parciais em novilhos F1 Limousin x Nelore alimentados com dietas com cinco níveis de concentrado. Revista Brasileira de Zootecnia, 29(2), 545-554.
Ducatti, T., Prado, I. N., Rotta, P. P., Prado, R. M., Perotto, D., Maggioni, D. & Visentainer, J. V. (2009). Chemical composition and fatty acid profile in crossbred (Bos taurus vs. Bos indicus) young bulls finished in a feedlot. Asian-Australasian Journal of Animal Sciences, 22(3), 433-439.
El-Memari Neto, A. C., Zeoula, L. M., Cecato, U., Prado, I. N., Caldas Neto, S. F., Kazama, R. & Oliveira, F. C. L. (2003). Suplementação de novilhos nelore em pastejo de Brachiaria brizantha com diferentes níveis e fontes de concentrado. Revista Brasileira de Zootecnia, 32(6 SUPPL. 2), 1945-1955.
Forbes, J. M. (1988). Metabolic aspects of the regulation of voluntary food intake and appetite. Nutrition Research Reviews, 1, 145-168.
Freitas, A. K., Restle, J., Pacheco, P. S., Padua, J. T., Lage, M. E., Miyagi, E. S. & Silva, G. F. R. (2008). Características de carcaças de bovinos Nelore inteiros vs castrados em duas idades, terminados em confinamento. Revista Brasileira de Zootecnia, 37(6), 1055-1062.
Gesualdi Júnior, A. M. F. P., Valadares Filho, S. C. J., Coelho da Silva, F. C. M. & Veloso, P. R. C. (2000). Níveis de concentrado na dieta de novilhos F1 Limousin x Nelore: características de carcaça. Revista Brasileira de Zootecnia, 29(5), 1467-1473.
Hankins, O. G. & Howe, P. E. (1946). Estimation of the composition of beef carcasses and cuts. US Department of Agriculture, 926, 1-20.
Ito, R. H., Prado, I. N., Rotta, P. P., Oliveira, M. G., Prado, R. M. & Moletta, J. L. (2012). Carcass characteristics, chemical composition and fatty acid profile of Longissimus muscle of young bulls from four genetic groups finished in feedlot. Revista Brasileira de Zootecnia, 41(2), 384-391.
Ito, R. H., Prado, I. N., Visentainer, J. V., Prado, R. M., Fugita, C. A. & Pires, M. C. O. (2010). Carcass characteristics, chemical and fatty acid composition of
Longissimus muscle of Purunã bulls slaughtered at 18 or 24 months of age. Acta Scientiarum.Animal Sciences, 32(3), 299-307.
Ito, R. H., Valero, M. V., Prado, R. M., Rivaroli, D. C., Perotto, D. & Prado, I. N. (2012). Meat quality from four genetic groups of bulls slaughtered at 14 months old. Acta Scientiarum. Animal Sciences, 34(4), 425-432. Kuss, F., López, J., Barcellos, J. O. J., Restle, J., Moletta, J.
L. & Perotto, D. (2009). Características da carcaça de novilhos não-castrados ou castrados terminados em confinamento e abatidos aos 16 ou 26 meses de idade.
Revista Brasileira de Zootecnia, 38(3), 515-522.
Maggioni, D., Marques, J. A., Rotta, P. P., Zawadzki, F., Ito, R. H. & Prado, I. N. (2009). Ingestão de alimentos. Semina: Ciências Agrárias, 30(4), 963-974. Maggioni, D., Prado, I. N., Zawadzki, F., Valero, M. V.,
Marques, J. A., Bridi, A. M., Moletta, J. L. & Abrahão, J. J. S. (2012). Grupos genéticos e graus de acabamento sobre qualidade da carne de bovinos. Semina: Ciências Agrárias, 33(1), 391-402.
Cattle feeding on feedlot 157
Mertens, D. R. (1994). Regulation of Forage Intake. In J. R. Fahey (Ed.), Forage Quality, Evaluation, and Utilization (pp. 450-493). Madison, WI, USA: American Society of Agronomy.
NRC. (2000). Nutrient Requirements of Beef Cattle (7th rev. ed.). Washington, DC, USA: Natl. Acad. Press. O'Connor, S. F., Tatum, J. D., Wulf, D. M., Green, R. D.
& Smith, G. C. (1997). Genetic effects on beef tenderness in Bos indicus composite and Bos taurus cattle. Journal of Animal Science, 75(7), 1822-1830. Pacheco, P. S., Restle, J., Vaz, F. N., Freitas, A. K., Padua,
J. T., Neumann, M. & Arboitte, M. Z. (2006). Avaliação econômica da terminação em confinamento de novilhos jovens e superjovens de diferentes grupos genéticos. Revista Brasileira de Zootecnia, 35(1), 309-320. Pazdiora, R. D., Dos Santos, A. P., Brondani, I. L., Restle, J., Arboitte, M. Z. & Cezimbra, I. M. (2009). Non-carcass body components of steers and young steers finished on feedlot. Acta Scienciarum. Animal Sciences, 31(1), 95-101. Resende, F. D., Queiroz, A. C., Oliveira, J. V., Pereira, J.
C. & Mâncio, A. B. (2001). Bovinos mestiços alimentados com diferentes proporções de volumoso: concentrado. 2. Efeito sobre a ingestão de nutrientes.
Revista Brasileira de Zootecnia, 30(1), 270-279.
Restle, J. (1999). Confinamento, pastagens e suplementação para produção de bovinos de corte: Universidade Federal de Santa Maria.
Restle, J., Pascoal, L. L., Faturi, C., Alves Filho, D. C., Brondani, I. L., Pacheco, P. S. & Peixoto, L. A. O. (2002). Efeito do grupo genético e da heterose nas características quantitativas da carcaça de vacas de descarte terminadas em confinamento. Revista Brasileira de Zootecnia, 31(1 SUPPL.), 350-362.
Rotta, P. P., Prado, I. N., Prado, R. M., Moletta, J. L., Silva, R. R. & Perotto, D. (2009). Carcass characteristics and chemical composition of the
Longissimus muscle of Nellore, Caracu and Holstein-friesian bulls finished in a feedlot. Asian-Australasian Journal of Animal Sciences, 22(4), 598-604.
Rotta, P. P., Prado, R. M., Prado, I. N., Valero, M. V., Visentainer, J. V. & Silva, R. R. (2009). The effects of genetic groups, nutrition, finishing systems and gender of Brazilian cattle on carcass characteristics and beef composition and appearance: a review. Asian-Australasian Journal of Animal Sciences, 22(12), 1718-1734.
Santos, A. P., Brondani, I. L. & Restle, J. (2008). Características quantitativas da carcaça de novilhos jovens e superjovens com peso de abate similares.
Ciencia Animal Brasileira, 9(2), 300-308.
SAS. (2004). SAS/STAT User guide, Version 9.1.2. Cary, NC, USA: SAS Institute Inc.
Shackelford, S. D., Koohmaraie, M., Cundiff, L. V., Gregory, K. E., Rohrer, G. A. & Savell, J. W. (1994). Heritabilities and phenotypic and genetic correlations for bovine postrigor calpastatin activity, intramuscular fat content, Warner-Bratzler shear force, retail product yield, and growth rate. Journal of Animal Science, 72(4), 857-863.
Silva, B. C., Pereira, O. G. & Pereira, D. H. (2005). Consumo e digestibilidade aparente total dos nutrientes e ganho de peso de bovinos de corte alimentados com silagem de Brachiaria brizantha e concentrado em diferentes proporções. Revista Brasileira de Zootecnia, 34(3), 1060-1069.
Silva, F. F., Valadares Filho, S. C., Ítavo, L. C. V., Veloso, C. M., Paulino, M. F., Valadares, R. F. D., Cecon, P. C., Silva, P. A. & Galvão, R. M. (2002). Consumo, desempenho, características de carcaça e biometria do trato gastrintestinal e dos órgãos internos de novilhos Nelore recebendo dietas com diferentes níveis de concentrado e proteína. Revista Brasileira de Zootecnia, 31(4), 1849-1864.
Silveira, M. F., Brondani, I. L., Arboitte, M. Z., Alves Filho, D. C., Restle, J., Pizzuti, L. A. D., Luz, T. R. R. & Retore, M. (2009). Composição física da carcaça e qualidade da carne de novilhos Charolês e Nelore que receberam diferentes proporções de concentrado na dieta. Arquivo Brasileiro de Medicina Veterinaria e Zootecnia, 61(2), 467-474.
Steen, R. W. J. & Kilpatrick, D. J. (2000). The effects of the ratio of grass silage to concentrates in the diet and restricted dry matter intake on the performance and carcass composition of beef cattle. Livestock Production Science, 62(2), 181-192.
Vaz, F. N., Restle, J., Brondani, I. L., Costa, E. C., Vaz, R. Z., Roso, C. & Carrilho, C. O. (2002). Suplementação energética sobre a qualidade da carcaça e da carne de vacas de diferentes idades, terminadas em pastagem cultivada de estação fria sob pastejo horário. Revista Brasileira de Zootecnia, 31(1), 173-182.
Vaz, F. N., Restle, J., Silva, N. L. Q., Alves Filho, D. C., Pascoal, L. L., Brondani, I. L. & Kuss, F. (2005). Nível de concentrado, variedade da silagem de sorgo e grupo genético sobre a qualidade da carcaça e da carne de novilhos confinados. Revista Brasileira de Zootecnia, 34(1), 239-248.
Véras, A. S. C., Valadares Filho, S. C. & Coelho da Silva, J. (2000). Composição corporal e requisitos energéticos e protéicos de bovinos Nelore, não-castrados, alimentados com rações contendo diferentes níveis de concentrado.
Revista Brasileira de Zootecnia, 29(6), 2379-2389.
Zervoudakis, J. T., Paulino, M. F., Detmann, E., Lana, R. P., Valadares Filho, S. C., Cecon, P. R., Queiroz, D. S. & Moreira, A. L. (2001). Desempenho e características de carcaça de novilhos suplementados no período das águas. Revista Brasileira de Zootecnia, 30(4), 1381-1389.
Received on September 29, 2014. Accepted on November 12, 2014.