A coupled hydrodynamic and ecological model
to manage water quality in Ria Formosa
coastal lagoon
F. Martins
1, P. Pina
2, S. Calado
3, S. Delgado
3& R. Neves
21Escola Superior de Tecnologia, University of Algarve, Portugal. 2Instituto Superior Técnico, Technical University of Lisbon, Portugal.
3DRAOT-Algarve, Environmental Ministry, Portugal.
Abstract
Nitrate and urban waste water directives have raised the need for a better understanding of coastal systems in European Union. The incorrect application of these directives can lead to important ecological or social penalties. In the paper this problem is addressed to Ria Formosa Coastal Lagoon. Ria Formosa hosts a Natural Park, important ports of the southern Portuguese coast and significant bivalve aquaculture activity. Four major urban waste water treatment plants discharging in the lagoon are considered in this study. Its treatment level must be selected, based on detailed information from a monitoring program and on a good knowledge of the processes determining the fate of the material discharged in the lagoon. In this paper the results of a monitoring program and simulations using a coupled hydrodynamic and water quality / ecological model, MOHID, are used to characterise the system and to understand the processes in Ria Formosa. It is shown that the water residence time in most of the lagoon is quite low, of the order of days, but it can be larger in the upper parts of the channels where land generated water is discharged. The main supply of nutrients to the lagoon comes from the open sea rather than from the urban discharges. For this reason the characteristics and behaviour of the general lagoon contrasts with the behaviour of the upper reaches of the channels where the influence of the waste water treatment plants are high. In this system the bottom mineralization was found to be an important mechanism, and the inclusion of that process in the model was essential to obtain good results.
1 Introduction
Ria Formosa is a large coastal lagoon, with an area of more than 80 Km2. In Figure 1 the western part of Ria Formosa can be seen. The western part represents more than 80% of the total area of Ria Formosa and is the study area in this work. The Eastern part (not seen in the figure) is long and narrow and the hydrodynamic connection to the western part is small.
The lagoon morphology is characterised by mudflats crossed by a complex network of channels. At low waters more than 80% of the area is dry, while in high water most of the mudflats are submerged. The average depth is thus very low (less than 1 meter) but the main channels have depths of about 5 meters. The western part of the lagoon is protected from the sea by three barrier islands and the Ancão peninsula. Three bars make the connection to the sea. These are highly dynamic inlets with a regular migration to East. Ria Formosa doesn’t have permanent fresh water streams discharging into it. During rain events some small rivers can present important instantaneous water flows. The ground water flows are also important fresh water sources. Ria Formosa hosts a Natural Park, important ports of the southern Portuguese coast and significant bivalve aquaculture activity. It is an important region for several species of limicolous birds’ nestbuilding. It is also important for several species of fish, mollusca and crustacea. The system receives the urban effluents from the two major cities of this region, Faro and Olhão. The cities are served by four waste water treatment plants (WWTP) that use secondary treatment and dispose their waters in the narrow channels near to land (points A to D in figure 1).
Figure 1: Ria Formosa coastal lagoon. Extensive mudflats, intricate net of channels, barrier islands and bars can be seen.
A B
C D
The objective of this study was to determine the impact of the effluents in Ria Formosa waters and specially the impact for the bivalve aquaculture activity. A monitoring plan was carried out with 38 sampling stations in the western part. The sampling was performed twice a month, in neap and spring tides conditions. In each sampling campaign two sets of observations were performed: one in low waters and other in high waters. The measured properties relevant for this work were the nutrient concentrations (Ammonia and Nitrate) and also Nitrite Phytoplankton and Suspended Sediments.
In the next section the modelling system is described and the modelling approach is introduced. The results obtained are than presented. The relevant processes and characteristics of the system are examined and conclusions are drawn.
2 Methodology
2.1. Model description
For this study the MOHID water modelling system was used. It is a modular 3D system (Miranda, et al. 2000). The velocity fields are computed in the hydrodynamic module, using a full 3D formulation with hydrostatic and the Boussinesq approximations. The horizontal grid is the orthogonal Arakawa C type grid. In the vertical direction a generic vertical geometry is used (Martins et al., 2001). Two transport models are coupled to this hydrodynamic module using eulerian and lagrangian formulations, respectively. A zero dimensional water quality model is coupled to the two transport models. Interactions between the surface and the water column (ex. Heat fluxes, wind stress) are handled by the surface module and the interaction between the bottom and the water column (ex. Oxygen sinks, bottom friction) by the bottom module. The ecological model uses a zero-dimension formulation that enables the application of the same model with both the lagrangian and the eulerian transport models. In this method the model equations are implemented in the form of source and sink terms of the transport models. Those terms are written in a generic form and can be applied both to eulerian cells and to lagrangian particles. The ecological model simulates the nitrogen cycle, the dissolved oxygen concentration, the BOD, the zooplankton and the phytoplankton population dynamics (Pina, 2001). The nitrogen species include the three main inorganic forms: ammonia, nitrate and nitrite and also three organic fractions: dissolved refractory fraction (DRON), dissolved non-refractory fraction (DNRON) and particulate fraction (PON). In figure 2 the conceptual diagram of the ecological model is illustrated. Primary producers consume ammonia and nitrate as a function of nutrient and solar radiation availability. The phytoplankton is consumed by zooplankton, which in turn, is consumed by organisms of higher trophic levels. The different species in each of these groups are not individualised. Ammonia, DNRON and PON compose the phytoplankton excretions. The PON decomposition produces ammonia and DRON. Ammonia is nitrified to nitrite and then to nitrate. The
fixation of atmospheric nitrogen is not included in the ammonia equations because it is usually small on saline waters.
A M M O N IA N IT R IT E N IT R A T E M O L E C U L A R N IT R O G E N D IS S O L V E D N O N - R E F R A C T O R Y O R G A N IC N IT R O G E N H IG H E R T R O P H IC L E V E L S Z O O P L A N K T O N P A R T IC U L A T E O R G A N IC N IT R O G E N P H Y T O P L A N K T O N D IS S O L V E D R E F R A C T O R Y O R G A N IC N IT R O G E N N it r if ic a t io n N it r if ic a t io n D e n it r if ic a t io n R e s p ir a t io n a n d E x c r e t io n s M in e r a liz a t io n R e s p ir a t io n a n d E x c r e t io n s M o r t a lit y a n d E x c r e t io n s M in e r a liz a t io n M in e r a liz a t io n " S lo p p y F e e d in g "
Figure 2: Mohid2000 Ecological model’s diagram.
2.2. Modelling approach
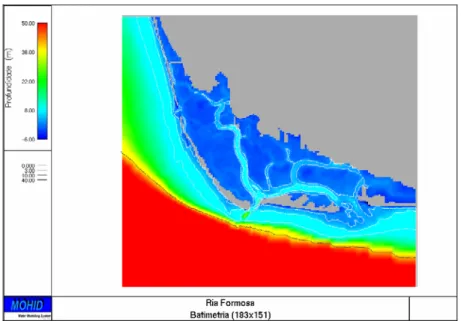
In this section the configuration of the runs is depicted. Two different grids were used in the simulations. For the hydrodynamic characterisation a refined grid with 183 x 151 cells was used. In Figure 3 the bathymetry for this grid is shown. The spatial step is variable, ranging from 50 meters in the central part of the lagoon to more than 500 meters close to the open boundary. The hydrodynamic results obtained with this grid were than integrated along with the bathymetry to a coarser grid with 61 x 50 cells and a variable spatial step between 150 and 1517.9 meters. This procedure is needed due to computational limitations, since several years’ simulations will be performed. The integration of the hydrodynamic results will give better results than simply run the model in the coarser bathymetry. The hydrodynamic will be implemented in a diagnostic way due also to computational reasons. In this technique the hydrodynamic results are recorded in a file and than used to run the ecological model. It is not practical to store the entire year results. For that reason only a characteristic period of the tide is used trough out the year. The chosen period is usually a spring neap cycle or a semidiurnal cycle. In this work an average annual semidiurnal cycle was used. The hydrodynamic model was forced by the tide at the open boundary and
average climatological winds. The fresh water flow was not considered due to the low and intermittent runoff to the system.
Figure 3: Ria Formosa bathymetry. Refined grid with 183 x 151 cells and variable spatial step between 50 and 521,7 meters.
The ecological model was run for a three years period to obtain stable conditions. Only the third year results were used. The main source of nutrients in Ria Formosa is the coastal area outside the lagoon. For this reason besides the WWTPs’ the ecological model was also forced by typical coastal concentrations imposed at the open boundary. An important forcing in ecological models is the light availability for micro organisms. In this study a light model based on (Brock, 1981) and (Steele, 1962) was used. The shading produced by suspended sediments and the auto shading from phytoplankton and zooplankton was also considered.
3 Results
The model results were compared with the measurements to enable a primary calibration of the runs. Since the measurements were carried out in the upper reaches of the channels, with only some stations in the main channels, they are only representative of the North part of the lagoon. The number of measurements was however considered sufficient for a primary calibration. The bathymetry resolution does not allow a point to point comparison. The measurements performed in the channel close to each discharge lay all in just two or three grid cells. For this reason the model results of these cells are compared with all the
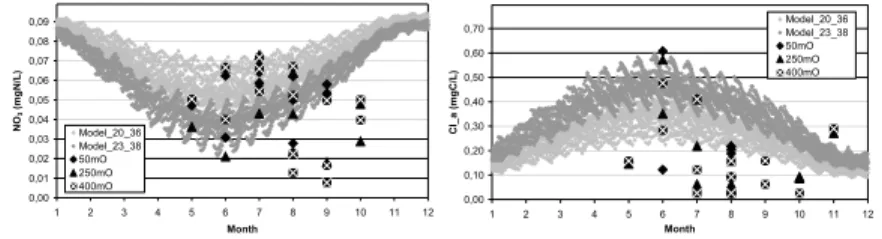
measurements for that channel. In figure 4, as a demonstrative example of the comparison procedure, the nitrate and phytoplankton concentrations measured near East Faro WWTP (point B in figure 1) are compared with the model results.
0,00 0,01 0,02 0,03 0,04 0,05 0,06 0,07 0,08 0,09 1 2 3 4 5 6 7 8 9 10 11 12 Month NO 3 (mgN /L) Model_20_36 Model_23_38 50mO 250mO 400mO 0,00 0,10 0,20 0,30 0,40 0,50 0,60 0,70 1 2 3 4 5 6 7 8 9 10 11 12 Month C l_a (mgC /L) Model_20_36 Model_23_38 50mO 250mO 400mO
Figure 4: Comparison between measured and modelled concentrations for Nitrate (left) and phytoplankton (right). The measured values in several stations near WWTP “B” and the adjacent cells’ model results are shown.
The measured values show a large variability both in time and space. In the same month and station the measurements can vary almost one order of magnitude. This is probably a response to the tidal cycle, both in the semidiurnal and in the fortnight frequencies. The fortnight cycle is not simulated as stated before, for that reason only the semidiurnal signal produced by the tide and the day-night signal produced by the light forcing are present. This explains the high frequency variation of the model results that display a thick cloud instead of a single line. In a low frequency (monthly) analysis it can be seen that the primary forcing is the light. The model results agree quite well with the observations for the summer months (May to August) especially for the nitrate. For the fall months (September and October) the model predicts higher phytoplankton and nitrate concentrations. The phytoplankton behaviour is likely a response to the excess of nutrients predicted by the model. The reason for a concentration of nutrients higher than the measurements in the fall months is probably the lack of information about the open boundaries. The model was forced by constant nutrient concentrations at these boundaries and the values used are typical of summer month. This shows the need for a better knowledge of the nutrient concentrations in the coastal region outside Ria Formosa.
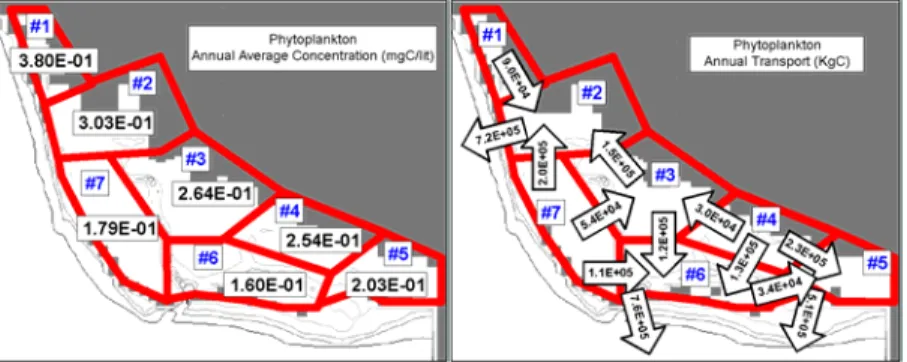
To understand the processes occurring inside the lagoon the model results were integrated spatially into boxes. Seven boxes were defined, to represent different regions of the lagoon, as shown in figure 5. The average annual concentrations in each box and the total transport of each species between boxes were computed. In Figures 5 and 6 these results are presented for Nitrate and Phytoplankton respectively. It can be seen that the nutrient fluxes across the bars have a net inward direction. This confirms the importance of the exterior coastal zone as a supplier of nitrate to Ria Formosa. The same pattern was also observed for ammonia but in a lesser degree since the WWTP’s are important sources of this nutrient. Phytoplankton is exported to the platform as expected.
Figure 5: Annual Average model concentration of nitrate in each box and total annual transport between boxes.
Inside the lagoon the phytoplankton concentrations are higher near the land, boxes 1 to 5, where the residence times are higher and the depths are lower. The residence time is an important issue in this system because the average residence time in the main channels is lower than a day. This hampers the developing of blooms since the plankton doesn’t have enough time to reproduce before it gets flushed. Only in the higher channel’s reaches the residence time is higher than a few days. The gross and net primary productions were also computed for each box, showing that higher productions occur near land. For the nitrate concentrations the opposite situation arises: the boxes near the islands, boxes 6 and 7, have higher concentrations than the boxes near land. This suggests that the nitrate entering the bars crosses boxes 6 and 7 and is consumed near land. The exchange of species between the boxes can also illustrate this mechanism: in figure 5 the transports are from boxes 6 and 7 to the boxes near land, and also from Olhão to Faro and Ancão. Phytoplankton fluxes are more difficult to interpret but in general are from the shallow areas to the deep channels and than to the outside. It must be noted that the region of box 7 is very shallow.
Figure 6: Annual Average model concentration of phytoplankton in each box and total annual transport between boxes.
One of the purposes of this work was to understand the impact of the WWTP’s discharges in Ria Formosa. A first conclusion is that the influence of the nutrient load in the tidal flats near the discharges can be high. In fact during the campaigns very high concentrations were observed in several locations near the discharges. On the other hand in the main channels, away from the discharges, the concentrations were consistently low. The model results corroborate this and show that far away from the discharges the nutrient load from outside the lagoon is the main driver of the system. One reason for this dual behaviour is the very low residence time in most of the lagoon and higher residence time in the regions near land where the WWTP’s are located.
This work also showed the importance of the bottom mineralization in this system. The first attempts to model the system considered only mineralization in the water column. In Ria Formosa this proved to be inadequate. To obtain good results bottom mineralization had to be implemented. It is easy to understand that this must always happen in systems with low residence times. In this cases the organic matter in the water column don’t have time to mineralise inside the lagoon and only the part that settles is transformed.
4 Conclusions
In this paper a coupled hydrodynamic and ecological numerical model was used in Ria Formosa coastal lagoon. The model was compared with measurements showing a good agreement for the summer months and poorer comparisons for fall months. This is probably due to the lack of information about the coastal boundary conditions. The exterior coastal area was shown to be the primary supplier of nutrients to the lagoon. The most productive regions of the lagoon were shown to be the shallow areas near land. The waste water treatment plants have an important impact in the channels near these regions but its impact is lower in the rest of the system. This is due to the low residence time of the lagoon. The bottom mineralization was also shown to be an important mechanism in this system.
References
Miranda, R., Braunschweig, F., Leitão, P., Neves, R., Martins, F. & Santos, A., MOHID 2000 – A coastal integrated Object Oriented Model. Proc. of Hydraulic
Engineering Software VIII. Lisbon, pp. 405-415, 2000.
Martins, F., Neves, R., Leitão, P. & Silva, A., 3D modelling in the Sado estuary using a new generic coordinate approach. Oceanologica Acta, 24, pp. S51-S62, 2001.
Pina, P., An integrated approach to study the Tagus estuary water quality, M.Sc. thesis, I.S.T., Technical University of Lisbon, Lisbon, 2001.
Brock, T.D., Calculating solar radiation for ecological studies. Ecological
Modelling, (14), pp. 1-19, 1981.
Steele, J.H., Environmental control of photosynthesis in the sea. Limnology and