Sustainability deterioration of electricity generation in Brazil
João M.L. Moreira
n, Marcos A. Cesaretti, Pedro Carajilescov, José R. Maiorino
Center of Engineering, Modeling and Applied Social Sciences, Universidade Federal do ABC, Av. dos Estados 5001, 09210-580 Santo André, SP, Brazil
H I G H L I G H T S
Multi-criteria decision analysis coupled with composite indicators. Allows revaluating beliefs and opinions with more consistent analyses. Sustainability indicator for individual projects of power generation. Encourage wind power, hydropower and nuclear power.
Encourage multi-production systems for natural gas and biomass plants.
a r t i c l e i n f o
Article history: Received 24 April 2015 Received in revised form 3 September 2015 Accepted 16 September 2015
Keywords:
Brazilian electricity sector Sustainability
Energy planning Project indicators
a b s t r a c t
The power generation sector in Brazil is usually considered to have a high level of sustainability because of its large share of hydropower, about 70%. The annual growth rate of the Brazilian power sector is about 4%/year with a growing capacity addition of fossil fuels, which indicates a deterioration regarding sus-tainability. This work utilizes multi-criteria analysis coupled with composite indicators to infer the sustainability evolution of the power generation sector in Brazil from 2010 to 2016. Seven criteria were considered: emission of greenhouse gases, immobilized area, use of fuel resources, water use, morbidity, energy generation reliability and energy efficiency. The assessment evidenced wind power and nuclear power plants as the most sustainable options for capacity addition after hydropower. Co-generation and combined cycle technologies should be encouraged in natural gas and biomass projects in order to re-duce impacts on sustainability. The assessment is interdisciplinary and admits tradeoffs amongst dif-ferent impacts and benefits, for instance, environmental impacts versus energy generation reliability. It is proposed that sustainability assessments be incorporated to the formal process of decision making in order to reduce opposition and facilitate obtaining consensus among different stakeholders.
&2015 Published by Elsevier Ltd.
1. Introduction
The demand for electricity in Brazil grows approximately 4%/ year, and currently about 70% of the installed capacity is hydro-power plants. Several electricity generation alternatives are being considered, and the country's electricity matrix is expected to
di-versify (Ventura Filho, 2012;EPE, 2014). Under the framework of
sustainable development, the country's energy decision makers should consider alternatives that reduce social and environmental impacts, as well as the points of view of different stakeholders (Zijp et al., 2015;Morrison-Saunders et al., 2014;Gasparatos and Scolobig, 2012;Bond and Morrison-Saunders, 2011;Buytaert et al., 2011; Vinodh, 2011; Obersteiner et al., 2010; Singh et al., 2010;
Evans et al., 2009;Goldemberg and Lucon, 2008;Weisser, 2007;
Loken, 2007;Veiga, 2006; Curran et al., 2005). Brazilian energy planners emphasize renewable energy but its implementation
faces difficulties due to lack of consensus triggered by various
is-sues, usually related to sustainability, that delay approval of
li-censes and construction permits for new projects (EPE, 2014). Long
term planning predicts the replacement of such projects by fossil fuel ones based on natural gas and coal simply because they have
more standardized and quicker licensing procedures (EPE, 2010;
EPE, 2014;Ventura Filho, 2012).
The objectives of the Brazilian planning agencies are influenced
by several factors related to environmental issues, business
inter-ests, energy supply reliability, low-tariff policies, etc. (EPE, 2014;
Ventura Filho, 2012;Weisser, 2007;Obersteiner et al., 2010; AN-EEL, 2010). The alternatives are given by the availability of energy sources, and consensus among various stakeholders regarding different Brazilian environmental issues. For example, the sus-tainability of the energy supply has become increasingly im-portant over the last 3 years due to lower rainfalls. To compensate
Contents lists available atScienceDirect
journal homepage:www.elsevier.com/locate/enpol
Energy Policy
http://dx.doi.org/10.1016/j.enpol.2015.09.021 0301-4215/&2015 Published by Elsevier Ltd.
n
Corresponding author.
E-mail address:joao.moreira@ufabc.edu.br(J.M.L. Moreira).
for lower generation from hydropower plants it is being con-sidered to increase the contribution of coal and nuclear power plants to meet the base load requirements.
Capacity addition, as other energy or industrial planning pro-blems, requires decision makers to deal with several issues belonging to social, environmental and economic dimensions (Vinodh, 2011;Buytaert et al., 2011;Obersteiner et al., 2010;Singh et al., 2010; Evans et al., 2009; del Rio and Burguillo, 2008;
Goldemberg and Lucon, 2008; Bebbington et al., 2007; Weisser, 2007;Loken, 2007; Veiga, 2006). For such decision-making pro-blems, several studies suggest to consider the sustainability as-sessment itself as part of the decision process taking into account
legitimate issues raised by different stakeholders (Zijp et al., 2015;
Morrison-Saunders et al., 2014; Gasparatos and Scolobig, 2012;
Bond and Morrison-Saunders, 2011; Buytaert et al., 2011). This procedure could facilitate obtaining consensus about various
de-bated issues regarding sustainability.Bond and Morrison-Saunders
(2011) call attention to three areas of debate: the definition of sustainability, reductionist versus holist visions, and
intergenera-tional issues or how time horizons are considered.Gasparatos and
Scolobig (2012) divide sustainability methods in three broad groups: monetary, biophysical and indicator based. The main as-sumptions in each group are related to value perspectives: an-thropocentric, ecocentric, degree of reductionism, and accept-ability of tradeoffs amongst different sustainaccept-ability issues. Since
these issues are difficult to be resolved they argue that one
pos-sible role of a sustainability assessment is to deal with this di-versity and to facilitate deliberation about it in an interactive way over time. For decision-making they suggest to combine holistic and reductionist approaches, combine biophysical, monetary and
well balanced indicators, and try to benefit from all methods to
capture the broad legitimate perspectives of stakeholders (
Gas-paratos and Scolobig, 2012;Bond and Morrison-Saunders, 2011). The choice of methods to carry out sustainability assessment is
an issue of debate.Zijp et al. (2015)observe that decision makers
often do not conduct a systematic problem analysis to make sus-tainability assessments. The consequence of such approaches is that their results may solely portray the points of view of the analysts and groups agreeing with those assumptions. To
cir-cumvent this problemZijp et al. (2015)propose a guide through
question articulation that lead the decision makers and stake-holders through all important choices and considerations to obtain a more comprehensive and acceptable sustainability assessment. Another important characteristic is that methods should be
transparent for all stakeholders, i.e., no black box (Loken, 2007).
The methods should also allow identifying actions to enhance the
sustainability level of the studied system (Vinodh, 2011).
The objective of this work is to make a sustainability assess-ment for the power generation sector of Brazil to infer its dete-rioration in the coming years. For the assessment we chose a short
period (2010–2016) so that the results could be used by decision
makers and stakeholders as a feedback information for future
planning and for sustainability follow-up (Hazelrigg, 2012;
Mor-rison-Saunders et al., 2014). We propose that the sustainability assessment be an important part of the decision making process for capacity addition in Brazil. Another objective of this work is to
discuss how the sustainability assessment wouldfit in the
Brazi-lian decision process for capacity addition. For this assessment, we consider the relevant commercial technology for power
genera-tion in Brazil. InSection 2, we describe the current state of the
electricity generation problem in Brazil, while in Section 3 we
present the methods and data adopted in this research. InSection
4we present the results and discussions, andfinally inSection 5
we make some concluding remarks.
2. The Brazilian electricity sector problem
Brazil's gross national product is approximately equal to those of France or United Kingdom in terms of purchase power and is distributed among the various states. Production is divided into the industrial, agricultural/livestock and service sectors and is concentrated in the Southeast and South regions, but there are relevant production activities in the other regions. The population is around 200 million inhabitants and concentrated in the South, Southeast and Northeast regions.
Fig. 1displays important primary resources available for elec-tricity generation, climate information, and the location of large power plants planned and under construction. Brazil pre-dominantly utilizes hydropower generation and is gradually
in-corporating other energy sources (Ventura Filho, 2012;EPE, 2010,
2011, 2014). Most of the major hydropower resources in the
Southeast, South and Northeast regions have been utilized; the resources in the Amazon region are still available, but their utili-zation is usually opposed by different social and environmental groups. There are three important hydropower plants under con-struction in that area: the Belo Monte, Jirau and Santo Antonio hydropower plants; and a nuclear power plant, Angra 3, is under construction in the Southeast. Other important resources for generating electricity in the country are natural gas and oil re-serves off the shore of the Southeast region, natural gas in the Amazon region, wind resources in the South and Northeast re-gions, and biomass and small hydropower plants throughout the country. The Amazon region is not available for biomass crop production due to prohibitive legislation for protecting the rain-forest (EPE, 2011).
Table 1 describes approximately the current Brazilian elec-tricity generation matrix. In 2010, hydropower included 76.2% of the total installed capacity, followed by natural gas with 8.4%. For comparison, the contributions of each primary energy source in
Brazil and in the world are listed inTable 1. The main power
de-mand in the country locates in the Southeast region, but most of the available hydroelectric resources are located in the Amazon region. Part of that has already projects under construction, as
shown inFig. 1, and the remainder resources on the Tapajos River
and on the left margin of the Amazon basin are object of future
planning for the next 10 years (EPE, 2014). However, to meet the
current and future demands for electricity in the country, all
power sources must be considered.Table 1also lists the expected
capacity distribution for 2016 (EPE, 2014). The oil entry in the table
refers to the fuel oil and small diesel plants spread across the entire country, particularly in the Amazon region.
The problem of electricity generation in Brazil is complicated by the variety of available alternatives and centers of consumption, large distances, as well as the social and environmental con-straints. Decision makers and stakeholders have priorities, pre-ferences and constraints, and formulate their decisions about
ca-pacity addition in the arena schematically presented inFig. 2(the
actors are identified in Appendix A). The several actors act on
different phases of the decision-making procedures in formal and informal processes. The discussions and arguments carried out during these procedures are typical of sustainability or sustainable
development issues (EPE, 2014). Thus, it appears natural
at-tempting to frame part of this debate regarding sustainability to help decision-making to meet the medium and long term planning (Zijp et al., 2015;Gasparatos and Scolobig, 2012; Buytaert et al.,
2011). The existing formal and informal institutions in the arena
shown inFig. 2can accommodate such a procedure.
3. Methods and data
suggested byZijp et al. (2015), named identification key, to select methods for sustainability assessment. They propose a set of
ar-ticulated questions to help defining the objective and scope of the
assessment. From the answers, they identify the most appropriate method or group of methods to conduct the assessment. Other researchers also suggest similar approaches to bring more con-sistency between sustainability assessment objectives and
em-ployed methods (Morrison-Saunders et al., 2014;Gasparatos and
Scolobig, 2012; Buytaert et al., 2011;Singh et al., 2010). Another key consideration regarding methods in this research is to con-sider the assessment itself as a means to make decisions about capacity additions. Thus, the several stakeholders should be in-volved in the whole decision making process, from the start to end, and in its revision for future assessments.
The approach considered in this work is as follows:
1. Identify how sustainability assessments can contribute within the existing decision-making procedures of the electricity gen-eration sector in Brazil.
2. Setup the sustainability assessment problem by identifying the object, scope, spatial and temporal boundaries, etc. We use the
identification key approach to do that (Zijp et al., 2015).
3. Identify the most appropriate set of methods and data based on
the defined problem.
4. Conduct the weight assignment.
5. Conduct the sustainability assessment of the power generation sector in Brazil aiming at evidencing its deterioration over time. 6. Discuss possible policy implications on the existing procedures of decision-making for the power generation sector in Brazil.
In this work, the criteria and themes chosen for the sustain-ability assessment aims to attend the points of view reported by different stakeholders but we have conducted no survey to infer their opinions. We discuss in the next section how it could be
undertaken and in the context shown inFig. 2.
Fig. 1. Climate, energy resources, and large power plants under construction in Brazil. HPP and NPP stand for hydro and nuclear power plants.
Table 1
Installed capacity in Brazil and the World in 2010 and 2016.
Energy source Capacity in Brazil (2010)a
Capacity in the world (2010) (%)b
Expected capacity in Brazil (2016)cc
(GW) (%) (GW) (%)
Hydropower 80.847 76.2 20.5 97.894 68.7
Biomass 5.380 5.1 1.3 10.905 7.7
Oilþ
5.108 4.8 4.9 4.787 3.4
Natural gas 8860 8.4 20.1 12.169 8.5
Nuclear 2.007 1.9 7.5 1990 1.4
Coal 1.765 1.7 41.2 3210 2.3
Wind power 1436 1.4 3.6 10.816 7.6
Others 687 0.7 0.9 687 0.5
Total 106.090 100 100 142.458 100
In 2010, the total electricity consumed in Brazil and the world was 455.8 and 18,466.5 TWh, respectively.þ
Oil refers to fuel oil and diesel power plants. aEPE (2010).
bEIA (2014). cEIA (2013).
Fig. 2.Brazilian arena for making decisions about capacity addition. SeeAppendix Afor the identification of agencies.
3.1. Sustainability assessment as a means for decision-making in the power generation sector
ConsideringFig. 2, we can devise in which context this work
wouldfit in the existing decision-making procedures of the power
generation sector in Brazil. EPE performs prospective studies about new projects and long term planning, IBAMA, other environmental agencies, and ANEEL deal with environmental and technical re-quirements and grant several licenses from construction and op-eration to decommissioning. ANEEL, ONS and CCEE are involved in regulations, auctions for new projects, energy dispatch and com-mercialization. The organized society publicizes their points of view in several formal and informal events, usually related to economic, social and environmental issues.
The entrepreneurs and investors make their decisions based on economic, social and environmental constraints imposed by the market, public agencies and society stakeholders. These agencies
issue official reports and documents periodically presenting the
status, trends and medium and long term planning while the or-ganized society (environmentalists, entrepreneurs, universities, and social organizations) also present their views.
The sustainability assessment proposed in this work would contribute for the EPE medium and long term planning. This agency already promotes public hearings to gather opinions and data from different society stakeholders, and gathers information and data from, investors, entrepreneurs, and other public agencies (EPE, 2014). So this process would be extended to incorporate the sustainability assessment for obtaining of consensus about
con-flicting issues.
3.2. Attributes of the sustainability problem
In this section, we attempt to define the sustainability
attri-butes of the problem using the identification key approach
sug-gested by Zijp et al. (2015). We start defining the problem
boundaries and inventory through questions and answers. We address important issues regarding sustainability to clarify the
objective and scope of the assessment to all stakeholders.Table 2
presents the object, spatial focus, temporal focus, and life cycle thinking of the assessment.
3.2.1. Set of criteria defining the sustainability state of the power generation sector
We define the state of the power generation sector regarding
its sustainability through a set of themes or criteria. Each power plant contributes to the sustainability state of the sector
introdu-cing more or less damages or benefits to the environment or
so-ciety. Since this set of criteria must be socially accepted, we
articulate questions and answers regarding the sustainability focus
of the assessment and justify the choices. Table 3 presents the
questions and answers regarding sustainability focus, issues, and the spatial and temporal focus of impacts.We consider issues proposed by different studies and publicized by Brazilian stake-holders. A list of issues is provided by different studies covering
biophysical, economic, environmental and social impacts (
Morri-son-Saunders et al., 2014;Buytaert et al., 2011;Singh et al., 2010;
Goldemberg and Lucon, 2008; Veiga, 2006). The environmental indices utilized by the industrial sector encompass both environ-mental and social dimensions, and usually consider the energy intensity, the mass intensity, the potential health and environ-mental risks, resource conservation, the extent of recycling, and
energy efficiency (Goldemberg and Lucon, 2008; Veiga, 2006;
Singh et al., 2010). Possible damage to human health includes respiratory and carcinogenic diseases, as well as the pathologies caused by climate change, ozone layer depletion, and radiation (Goldemberg and Lucon, 2008; Veiga, 2006; Singh et al., 2010). Additionally, the public is concerned by the consequences of po-tential accidents, particularly regarding nuclear power plants (Adamantiades and Kessides, 2009;Goldemberg and Lucon, 2008;
Lamarsh and Baratta, 2001,Cesaretti, 2010).A relevant issue for the power sector in Brazil is the energy generation reliability. Heavily based on hydropower, it has been under stress in dry periods due to low rainfalls, and requires increasing the share of thermal power plants for baseload generation. This criterion is essential for the Brazilian power sector today.
3.2.2. Selected data
Engineers could generate the data related to the themes
pre-sented inTable 3while designing, procuring and building power
plants. Since we did not have such data for all Brazilian power plants, in this work we gathered data in the literature and took instead a technology perspective, i.e., we employ impacts from
average projects of each technology (Cesaretti, 2010). We
sum-marize the gathered data inAppendix B. InTable 4we present the
corresponding parameters and design variables associated to each
issue fromTable 3. All data account for the life cycle of the
com-plete production chains during electricity generation, except for the one associated with use of natural resources. In that case, we consider only the resources related to fuel consumption for power generation.
3.2.3. Justifications for the selected set of criteria and data
The set of criteria includes important issues regarding the planet sustainability, which concern the Brazilian public opinion. Four of such issues are directly related to the management of terrestrial systems affected by the electricity sector, namely
Table 2
Articulated questions for defining the domain of boundaries and inventory.
Domain: system boundaries and inventory
Object What is the object under assessment?The Brazilian power generation sector. It is a system comprising several large state and private enterprises distributed over several regions of the country. The focus of this assessment is electricity generation. Since it causes social, environmental and economic impacts, they should be assessed for each new power generation project.
Spatial focus What is the spatial focus of the assessment?The spatial focus is the Brazilian territory because electricity is generated over the whole country (see Fig. 1).
Temporal focus What is the temporal focus of the assessment?The temporal variable has a period of 6 years or a generational focus. However, we consider one of the concerns of Brazilian society (preserving the Amazon forest biodiversity for future generations) despite the short temporal focus of the assessment. Life cycle thinking Which parts of the life cycle and supply chains are included in the assessment?In principle, the complete life cycle and supply chain. When data are not
available, we clarify which parts of the supply chain and life cycle are not considered.
emission of greenhouse gases, loss of biodiversity, use of water, and change of land use through deforestation and land
degrada-tion (Obersteiner et al., 2010). We focus on national and regional
issues with national impacts because local and regional impacts are usually treated in the environmental impact assessments performed for licensing new capacity projects. The economic di-mension is not focused because it is considered in the auction
procedures employed to define new capacity addition. Table 4
presents the parameters and design variables associated with the several issues. Below we justify the selected issues and criteria.
Reducing the emission of greenhouse gas is almost a con-sensual policy issue. The parameter that represents this criterion is the project direct and indirect emissions which can be decreased if proper designs and conducts are adopted.
The immobilized land area is an important issue in Brazil due to possible damages to natural rain forests in the Amazon region, where large hydropower projects are under construction. Another natural habitat that bears concern in the country is the Pantanal
marsh region in the Mato Grosso state (Souza Filho, 2013).
Pro-tection of biodiversity in such regions is considered an important issue and is usually associated with avoiding large immobilization
of land areas.Fthenakis and Kim (2009)introduced the concepts of
transformed area (m2) and immobilized area over time (m2year)
for computing direct and indirect use of area for generating en-ergy. The area downtime, which takes into account both the op-erating time of the power plant and the time required to recover the location to its original condition, is taken as the associated parameter of this criterion.
The criterion of use and process of natural resources is
considered because reducing the consumption of raw materials is essential for avoiding their exhaustion. The other reason is related to the ability of the environment to provide important natural services which are essential to life and reduce stress on the
en-vironment (Weisser, 2007;Veiga, 2006;Obersteiner et al., 2010).
In general, the greater is the amount of material input in the production chain, the greater will be the corresponding
environ-mental impacts (Obersteiner et al., 2010;Goldemberg and Lucon,
2008; Veiga, 2006; Weisser, 2007; Curran et al., 2005). We use materials to build power plants and all facilities involved in each energy production chain, and as fuel for generating power. Large amounts of construction materials are used to build hydropower dams and nuclear reactors. Metals and other materials are used to build fossil, biomass, and wind power plants.
Due to lack of data, we restrict this criterion only to fuel utili-zation for power generation. We use consider for that the inverse energy density of the several fuels. For hydroelectric and wind power plants we consider that the use of natural resources is zero because in those plants the water and wind return to the en-vironment almost without disturbance. Thus for this criterion, the evaluation does not account for the complete life cycles and pro-duction chains.
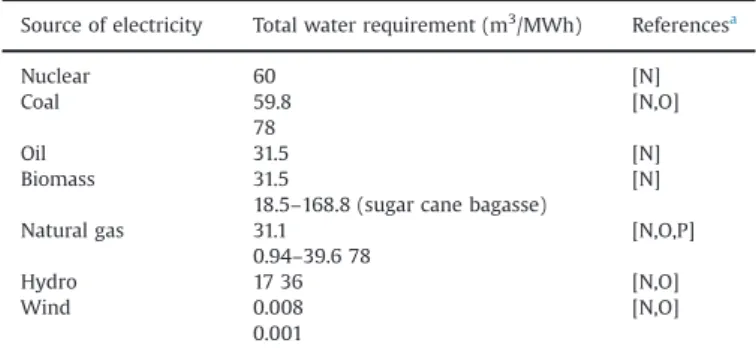
The water consumption is another consensual issue regarding
sustainability. Generating electricity requires considerable
amounts of water throughout its production chain and life cycle. Water can be consumed or circulated (used and returned to the environment). Fossil fuels, biomass, and nuclear power require water as coolant in their thermal cycles during electricity gen-eration. Biomass also requires water for growing the crops. Hy-dropower loses water through evaporation from the reservoirs, which depends on their size and local temperature. Hydro, wind, nuclear and other energy sources require water indirectly during their construction. The associated variable to this criterion is the
water consumption by projects (Evans et al., 2009;Lamarsh and
Baratta, 2001).
Regarding the social dimension, the society considers good health as an important indicator for welfare. Among the concerns of modern society we can point out diseases caused by the normal operation of industrial facilities which emit pollutants to the en-vironment. Emission of gases to the environment by fossil fuels and biomass plants may cause respiratory diseases to individuals living in their vicinity. Radiation and radioactive contaminants coming out of nuclear power plants cause great concern to the public. The public is concerned with the consequences of potential accidents, especially regarding nuclear power plants. To represent Table 3
Articulated questions for defining the domain of issues and impact assessments.
Domain: selection of issues and impact assessments
Sustainability focus What is to be sustained?The environment, the social wellbeing related to the domain of the power generation sector, and the reliability of electricity generation.
Issues and selected criteria What are the important themes or criteria?The issues or themes considered are those related to the main interest of the Brazilian society regarding social and environmental issues (seeSection 3.2.3for justifications):
●climate change due to CO2emission and deforestation in the Amazon rain forest, ●immobilized area,
●loss of biodiversity (mainly in the Amazon rain forest), ●use of natural resources,
●water consumption,
●morbidity and fatalities due to pollution, ●normal operation and accidents, ●reliability of electricity supply and, ●energy efficiency.
Impact spatial focus What is the spatial focus of the impacts?We consider only national impacts because local and regional impacts are treated in the environ-mental impact assessments required by IBAMA and other environenviron-mental agencies.
Impact temporal focus What is the temporal focus of the impacts?The generational focus should be continuous over time periods of 5 years in order to allow frequent revisions of objectives, criteria and sustainability visions of different stakeholders over time.
Critical limits for impacts Are there critical limits for the several impacts?For the current assessment, there are no critical limits to the impacts.
Table 4
Criteria and design variable or parameters adopted in this work.
Criterion Design variable or parameter
1. Climate change CO2emission (kgCO2/MWh) 2. Immobilized area and
biodiversity
Immobilized area (m2year/MWh)
3. Use and process of fuel resources
Mass of fuel used to generate electricity (kg/ MWh)
4. Water consumption Water consumption (m3/MWh) 5. Morbidity due to
pollution
Expected human morbidity due to pollution (morbidity/MWh)
6. Reliability of energy generation
Defined as the product between the capacity factor and the availability of power generation plants
7. Energy efficiency Energy efficiency
such social concerns, we choose as associated parameter the ex-pected population morbidity caused by the power generation
project during normal operation (Lamarsh and Baratta, 2001;
Markandya and Wilkinson, 2007).
For nuclear power the accidents have also other consequences,
namely the fear of radiation, social and political conflicts, and the
possibility that part of the surrounding population of a nuclear power plant be relocated to avoid contamination with
radio-activity materials and radiation (Lamarsh and Baratta, 2001;
Ce-saretti, 2010). These concerns are not considered in this work. The energy generation reliability can be inferred from
avail-ability and capacity factor data (Chatzimouratidis and Pilavachi,
2009;IAEA, 2002). Availability is the amount of time that a power plant is able to generate electricity over a certain period. A power plant stops generating electricity due to repairs, weather condi-tions, fuel loading, etc. Capacity factor is the amount electricity it generates in a period divided by its full power generation. These two parameters should not be confused. One addresses operation time and the other generation of electricity, which may not be the
maximum rated power of the plant (Chatzimouratidis and
Pila-vachi, 2009;IAEA, 2002).
To generate full power continuously a power plant should be
available and generate full power. Thus we define the energy
generation reliability as the product between capacity factor and
availability with its value ranging from 0 to 1.Table B6in Appendix
B present data about capacity factor and availability.
3.3. Selection of appropriate methods
Table 5presents the set of articulated questions used to select appropriate methods for the assessment. Since the set of criteria involve variables of different disciplines (biophysical, technical and socioeconomic), we cannot restrict the analyses to biophysical or monetary methods. We choose a method based on indicators coupled with multicriteria analyses to be able to consider the set
of criteria listed inTable 3. In principle, the multicriteria analyses
method maintain the value perspective of different issues and themes. We can monitor impacts to avoid trespassing critical va-lues. Thus, the whole method may have a strong sustainability perspective and be less reductionist.
To account for impacts of different variables or parameters on the power generation sector we estimate technical indicators
based on–input-output analyses whichfits well with multicriteria
analyses (Singh et al., 2010;Triantaphyllou, 2000;Hazelrigg, 2012;
Cesaretti, 2010;Metcalf, 2006). Let ΔSikbe the amount of impact
on society or environment associated with the ith criterion that
arises from the kth power plant project for generating a given
amount of electricity
Δ
E. We define ik
σ as the technical indicator
that infers the amount of theithtype of impact caused by thekth
project per unit of generated electricity, i.e.,
S
E. 1
ik i k
σ = Δ
Δ ( )
The technical indicators i
k
σ have units of impact per given
amount of generated electricity. For example, for greenhouse gas
emissions, the unit is (kgCO2/MWh). The technical indicators vary
with the amount of electricity generated and must account for the
complete life cycle of the process (Singh et al., 2010). If there is
generation of electricity alongside with other products and ser-vices, the impacts should be divided among all products accord-ingly. The technical indicators provide a multidisciplinary
ap-proach in which the impact of each criterion can be quantified and
allowing a strong sustainability perspective for the analysis. In order to be transparent to stakeholders we chose the weight
sum model to carry out the multicriteria analysis (Singh et al.,
2010; Hazelrigg, 2012), which is a simple and straightforward method to construct composite indicators based on weights for the different criteria. The stakeholders, who have previously par-ticipated in the choice of the several criteria, could also participate
in the definition of their importance weights.
3.4. Weight assignments
The scheme employed to coordinate the assignment is based
on the hierarchy tree shown inFig. 3(Chatzimouratidis and
Pila-vachi, 2009). We divided the sustainability priorities of the Bra-zilian stakeholders in environmental (ecocentric) and social and technical (anthropocentric) dimensions. According to what was
discussed inSection 3.2.3and summarized inTable 3, in this work
we consider that Brazilian stakeholders would assign a higher priority to environmental and biophysical issues than to social and technical issues. Thus, we assigned to the environmental dimen-sion a weight of 60%, and to social and technical dimendimen-sion, 40%. Regarding the environmental dimension, we consider that climate,
Table 5
Articulated questions for defining the methods for the assessment.
Domain: aggregation and interpretation
Sustainability target Is a sustainability target necessary?It is necessary to reduce impacts but not to reach a specific sus-tainability target. It is necessary to determine the least damaging alternatives of power generation in a given time. As problems are solved, new ones arise and require that the set of criteria be changed. Views on sustainability and values What views of sustainability should be emphasized?While we desire to implement a perspective of strong
sustainability, this work admits a partly substitutional view in which the various capitals and impacts are interchangeable until a critical level is reached for each one. Thus we accept a weak perspective of sustainability, but avoid trespassing critical limits on individual resources and environmental damages. To maintain a value perspective, individual variables or criteria under assessment should be con-tinuously estimated and communicated to all stakeholders.
Aggregation of information from different disciplines (nor-malizations and weightings)
How should information from different disciplines contribute to the assessment?The information is treated in two manners. First, in a multidisciplinary approach, the individual contribution of each criterion is considered. This would permit a strong perspective of sustainability, which most stakeholders consider very beneficial. Second, in a simple interdisciplinary approach, the variables or criteria are composed in one indicator, which must be socially accepted, in order to admit some tradeoffs amongst different impacts (weak perspective of sustainability).
immobilized area and biodiversity, and use of water be equally important and use of fuel resources less important. We assigned
30% weight to each of thefirst 3 issues and 10% to the last issue
from the environmental dimension. Regarding the social dimen-sion, we assigned a 50% weight to the morbidity, 30% to the energy
generation reliability and 20% to the energy efficiency. The final
weight assigned to each criterion is shown in red inFig. 3.
This weight distribution reflects how the authors of this work
read the opinions of the stakeholders presented inFig. 2, but it is
not unique and there is no correct form to do that (Hazelrigg,
2012). These assignments attempt to describe the points of view of
the Brazilian stakeholders and be socially acceptable. Since a
sta-keholder’s opinion change over time, as old problems are solved
and new ones arise, we expect that a revision of the weight dis-tribution occur periodically in 3 or 5 years. We may expect that they can be more easily chosen as systematic sustainability as-sessments are continuously conducted and provide useful feed-back for future decisions.
3.5. Multicriteria analysis coupled with composite indicators
3.5.1. Normalization of technical indicator for different power gen-eration projects
To evaluate the composite impact of a power generation project on sustainability we use the weight sum model for multi-criteria
decision analysis (Singh et al., 2010;La Rovere et al., 2010;
Ha-zelrigg, 2012; Triantaphyllou, 2000). To do that we scale the technical indicators for each impact to the mean value for all
projects so that they become dimensionless (Singh et al., 2010).
The scaled or normalized impact indicator ( ik
η ) is defined as
2 i
k ik
i
η σ
σ =
( )
where i K k
K ik 1
1
σ = ∑= σ is the mean value of theithindicator for all
power generation projects, andKis the number of different power
generation projects. The mean of the normalized indicator for the
ithcriterion or impact among all projects is unity.
3.5.2. Indicators for specific projects and for the power generation sector
The composite indicator for the impact of a specific project on
sustainability is defined as (Singh et al., 2010)
w
3 k
i I
i i k
1
∑
η = η
( ) =
where thewiis a weight arbitrated according to the relevance of
theithimpact, andIis the total number of criteria considered. The
assigned values for the weights (wi's), as was mentioned, are often
crucial for the results and are disputed by stakeholders who
de-fend their preferences (Singh et al., 2010). Eq. (3) relates the
composite indicator of the kth power plant to several project
parameters that define the different i
k
η . With constant normalized
indicators, Eq. (3) is a linear combination of every individual
impact.
The product(wi iηk)of Eq.(3)provides the relative importance of
theithcriterion relative to the composite indicator of thekthpower
plant project. It also provides a simple interdisciplinary approach in which the criteria are composed in one indicator in order to
admit tradeoffs amongst different impacts (see Table 5 –
ag-gregation of information).
To ascertain how much a specific project damages the
sus-tainability of the power generation sector, an indicator for the sustainability state of the whole power generation sector must be recognized. In principle, this indicator can be represented by the sum of the indicators of all plants weighted by the electricity each one generates
E
E 4
s k K k
k
k K
k 1
1
η
η
=∑
∑ ( )
=
=
whereEkis the electricity generated by the kthpower plant per
year.
The decision to add new capacity to the electric system should favor projects that minimize the power generation sector
in-dicator. The contribution toηsof each new addition would have to
be evaluated. The composite indicator for each project ( k
η) would
be compared with the current value of the indicator for the power
generation sector in the country (ηs). The projects with lower
in-dicators would be the preferred candidates for adding capacity to the generation sector.
3.5.3. Data and approximation
To obtain the impact indicator for a specific project, k
η, is
ne-cessary to collect data from individual new projects, and to obtain
the power generation sector indicator for Brazil,ηs, it is necessary
to collect data about all existing power plants in the country. Since such data are not available, in this work we use average estimates of the normalized indicators from different energy sources and assume that these average values are good estimates. Thus it will
be impossible to compare specific projects but only typical
re-presentatives of each technology. The sector indicator becomes.
g
5 s
j J
j j
1
∑
η = η
( ) =
wheregjis the share of the jth energy source in the electricity
matrix andJis the number of different energy sources. Both Eqs.
(4) and (5) yield similar estimates for the sustainability level for
electricity generation provided that the impact indicator for a
ty-pical plant of thejthenergy source, ηj, is the mean of all impact
indicators for specific projects of each energy source, k
η.
4. Results and discussions
The view of sustainability we adopt in this work is partly substitutional in which the various capitals and impacts are terchangeable but the method we chose, coupling composite in-dicators with multicriteria analyses, allows conducting the as-sessment under the perspectives of strong and weak sustainability. InSection 4.1we present and discuss results about each criterion
individually (strong perspective), and inSection 4.2 we present
and discuss the results combining all impacts according to the
weight distribution ofFig. 3(weak perspective). InSection 4.3we
detail the impacts and contributions of different projects of ca-pacity addition in the country.
Fig. 3.Hierarchy tree for weight assignment.
4.1. Results regarding a strong sustainability perspective
4.1.1. Estimating technical indicators for typical power generation plants of different energy sources, ij
σ
In Table 6we present the estimated technical indicators for
power generation plants based on the literature data inAppendix
B. The data exhibited large variations caused by uncertainties,
different approaches for data collection and treatment, and dif-ferent design characteristics in the projects. To clarify these var-iations, below the mean values of all data we display the max-imum and minmax-imum values. These mean values are denoted the average-design results and are taken as the representative values for a typical power plant for each energy source. Therefore, we assume that the variations in the estimated technical indicators cover all possible values that they can have for power plants with different designs. Considerations about how each technical in-dicator was obtained are given below.
Coal and natural gas emission data include different schemes
for cogeneration. Hydro, wind and nuclear power emit CO2
in-directly during construction. Biomass emission depends on the type of biomass and the complete production chain used to
gen-erate the electricity. Nuclear power emits CO2during both
con-struction and decommissioning (Goldemberg and Lucon, 2008;
IPCC, 2007;Gagnon et al., 2002;ELETROBRAS, 2000). Hydropower
plants also emit CO2equivalents due to methane gas generated in
the reservoir; methane has a global warming potential 23 times
greater than that of CO2 (Goldemberg and Lucon, 2008). On
average, Brazilian hydroelectric plants emit 356.9 kg/day km2 of
CO2and 18.3 kg/day km2of methane (ELETROBRAS, 2000).
The transformed areas for the several energy sources are
pre-sented inAppendix B. Table B5 presents the occupation and
re-covery time utilized to determine the immobilization time. The numbers quoted represent the means of several literature values except those for nuclear and hydroelectric power technologies,
which were estimated in this work (Appendix C).
The technical indicator for the use and processing of natural resources was restricted to fuel consumption, and is expressed as kg of fuel material utilized per energy generated (kg/MWh). For biomass, the mean value represents data from sugar cane bagasse since this crop is important for generating electricity through co-generation in Brazil. Regarding water consumption of different energy sources, data about it are usually presented in the units of
the technical indicator as shown inTable B4.
The morbidity data, usually related to respiratory diseases, were
taken fromMarkandya and Wilkinson (2007). Fossil fuels and biomass
cause morbidity mainly due to air pollution, nuclear power generates morbidity due to a variety of common causes in mining, chemical processes and power generation, but with very small magnitude. Hydropower and wind power cause no measurable morbidity.
The energy supply reliability was obtained from the product between the availability and capacity factor. The availability data
were obtained from IAEA (2002), and the capacity factor and
thermal efficiency data, from several literature compiled by
Ce-saretti (2010). InTable 6, the technical indicators are associated to
impacts. We define the impact indicators of energy generation
unreliability and energy inefficiency to represent these criteria.
Energy supply unreliability is defined as (1– energy supply
re-liability) and energy inefficiency as (1–energy efficiency).
4.1.2. Discussion about technical indicators for typical power plants
–strong sustainability perspective
4.1.2.1. Climate changes. The results displayed inTable 6regarding
CO2emission are as expected; the fossil fuels emit more CO2
di-rectly, while biomass, hydropower, nuclear and wind power emit less and do so indirectly, i.e., throughout their life cycle. Well-de-signed coal and natural gas power plants can emit as little as poorly designed power plants utilizing biomass, hydro and nuclear technologies. For instance, in Brazil, a hydropower plant built in the Amazon region may emit much more methane than one with similar capacity built in the arid Brazilian Northeast.
4.1.2.2. Immobilized land area. Biomass and hydro power plants present the greatest technical indicator for immobilized area, while fossil fuels exhibit the lowest. For biomass, the result is expected due to the large areas required for crops. However, bio-mass resources may be used to produce electricity, heat, ethanol or other products concurrently; therefore, its impact should be di-vided among these products, as discussed before. The recovery
time for large hydroelectric reservoirs is difficult to estimate. Once
built and integrated into the environment and the economic life of a community, they will likely not be emptied after the power plant
is decommissioned. The 100-year recovery time has been verified
for small hydroelectric plants built in the early 20th century in Brazil. The Brazilian hydroelectric plants have a low technical in-dicator for immobilized area because the plant capacities are usually high.
Nuclear power requires a small area for plant operation, fuel cycle facilities and nuclear waste storage, but the time required to keep the waste stored is long. The recovery time is long based on today's technology, but may be decreased over time via
innova-tions in the nuclearfield using the transmutation technology in
fourth generation nuclear reactors (NEA, 2006). Even with these
long immobilization times, thefinal mean immobilized area
pre-sented inTable 6for a typical nuclear power plant is comparable
to hydropower.
4.1.2.3. Use of fuel resources and water consumption. The technical indicator for using resources in this assessment is restricted to fuel Table 6
Technical indicators ( ij
σ) obtained for typical power plants using different energy sources and their respective variations. The indexirepresents the criteria andjrepresents the sources.
Technology j
1
σ (kgCeq/MWh) σ2j(m2year/MWh) σ3j(kg/MWh) σ4j(m3/MWh) σ5j(morbidity/
TWh)
j
6
σ (supply unreliability) σ7j(energy
inefficiency)
Biomass 50 (15–800) 21,320 (504–88,000) 1000 (952–4651) 32 (18–169) 43 (10–170) 0.43 (0.37–0.52) 0.65 (0.62–0.75) Coal 1100 (190–1300) 33 (5–140) 334 (334–654) 69 (60–78) 225 (60–900) 0.32 (0.19–0.58) 0.64 (0.54–0.67 Wind power 20 (4–100) 1129 (31–3750) 0 (–) 0.005 (0.001–0.008) – 0.89 (0.23–0.94) 0 (0–0) Natural gas 500 (250–234) 11 (–) 287 (–) 35.3 (1–78) 30 (5–120) 0.28 (0.14–0.41) 0.49 (0.40–0.64)
Hydropower 31 (0–410) 186 (2–2280) 0 (–) 26.5 (17–36) – 0.75 0.71–0.79) 0 (0–0)
Nuclear 18 (2–437) 346 (300–500) 0.02 (0.0003–0.02) 60 (–) 0.22 (–) 0.19 (0.15–0.28) 0.67 (0.66–0.70) Oil 847 (520–1160) 11 (–) 250 (250–355) 31.5 (–) 161 (40–650) 0.47 (0.22–0.91) 0.63 (0.60–0.70)
Legend:σ1j–C equivalent;σ2j–immobilized area; σ3j–use and process of natural resources;
j
4
σ –use of water;σ5j–morbidity due to pollution; σ6j–energy supply
unreliability; j
7
utilization. Under this circumstance, wind and hydropower are considered to have zero technical indicators for resource use. Nuclear power has a very low technical indicator due to the high energy density. Fossil fuel power plants present an intermediate technical indicator. Biomass has the highest technical indicator, with large variations depending on the crop used, but its impact can be mitigated if it is involved in a multiple-production scheme. If we considered complete life cycle and production chains for this criterion, the results for hydropower and wind power would be different. Building hydropower and wind power plants requires large quantities of construction materials, metals and polymeric materials.
Biomass consumes the most water during its life cycle, fol-lowed by coal and nuclear power. The water consumption of bio-mass and natural gas plants depends on the conditions of the power generation process. For instance, natural gas
combined-cycle power plants with high thermal efficiency yield lower
technical indicators. The water consumption of hydropower occurs during its construction, and wind power requires virtually no water for electricity generation compared to the other alternatives.
4.1.2.4. Morbidity. The data regarding morbidity inTable 6vary for the technologies based on fuel combustion due to differences in the sophistication of the systems used to control emissions. Re-spiratory diseases are the primary source of morbidity, and fossil fuel power plants present high technical indicators. Biomass and natural gas have intermediate morbidity technical indicators. Nu-clear, hydro- and wind power technologies present very low morbidity indicators.
It seems natural to the public that hydro and wind power plants do not cause morbidity to nearby individuals. For nuclear power, the public perceives the risk of potential radiation diseases, in the present or future, although the actual technical indicator is very low.
4.1.2.5. Energy supply unreliability and energy inefficiency. The technologies with higher energy unreliability are wind power and hydropower while those with lower unreliability are nuclear and
coal-fired power plants. On the other hand, hydropower and wind
power are the ones with lower energy inefficiency.
4.2. Results regarding a weak sustainability perspective
4.2.1. Composite indicators for typical projects and the country
With the data from Table 6, the normalized average-design
indicators for the effects of typical power generation projects for
all energy sources ( i
j
η ) were obtained through Eq.(2). The
com-posite indicators for the impact of typical projects for each source
j
η
( )were obtained using Eq. (3) and the weight distributions of
Fig. 3. Fig. 4 displays the composite indicator for typical power
plants of different energy sources. Despite the great difficulty to
achieve consensus about criteria and weights it is very unlikely
that 2 or 3 of the criteria listed inTable 4would be absent of any
sustainability analysis regarding the Brazilian power generation
sector (Goldemberg and Lucon, 2008; Veiga, 2006; Zijp et al.,
2015; Morrison-Saunders et al., 2014; Gasparatos and Scolobig, 2012;Obersteiner et al., 2010;Singh et al., 2010;Evans et al., 2009;
Curran et al., 2005). The distribution of importance weights is rather uniform with values between 6% and 20% with 3 criteria with 18% and one with 20%. When we consider many different criteria, the relative importance of each one tends to be low unless
one specific is disproportionately emphasized.Fig. 4 shows that
natural gas, hydropower, nuclear power, and wind power are the alternatives with lower damage to the sustainability state of the power generation sector presenting composite indicators below
1.000.
Fig. 4 presents also the possible variations in the composite indicators obtained from the literature data for different energy sources. Fossil fuels and biomass present large variation which means their composite indicators can change according their en-vironmental footprint caused by different designs, construction methods, materials and operation conditions. Were the results for
η
j obtained for a specific project it would provide informationabout the actual environment footprint of that project. In princi-ple, it could differentiate the impact on sustainability of projects of similar technology and energy source but built with different en-vironmental footprint.
The biomass and natural gas power plants produce electricity, heat, ethanol or other products. The life cycle impact for their complete production chains should be divided among the
pro-ducts. To account for that,Fig. 5presents the composite indicator
for the biomass and natural gas power plants relative to the im-pact assigned to power generation. In this case, well designed and operated plants with multiple products may provide composite indicators below 0.500.
The power generated in Brazil from biomass is primarily based on sugar cane bagasse derived from sugar and ethanol production. Given the multiple production conditions, we assigned a 15% share to electricity generation regarding the total impact generated by the biomass processes.
Table 7presents the composite indicators for the power gen-eration sector for Brazil in 2010 and 2016, as well as for the world
in 2010. These data were obtained using Eq.(5). The shares of each
Fig. 4.Composite indicator and corresponding variations for different energy sources.
Fig. 5.Composite indicator for natural gas and biomass power. Plants as a function of the impact share assigned to electricity generation.
technology in the electricity grid for Brazil and worldwide,gj, are
presented in Table 1. Table 7 shows that the ηs indicator can
capture the deterioration of the power generation sector sustain-ability changing its value from 0.529 in 2010 to 0.612 in 2016.
Table 7reveals that the indicator for the power generation sector
(ηs) for Brazil in 2010 is 41% of that for the world because the
installed capacity in Brazil is 76.2% hydropower, while in the world it is 66.2% fossil fuels. This evidences the high level of sustain-ability of the Brazilian power generation sector.
Hydropower plants have composite indicators below the in-dicator for the power generation sector in Brazil, 0.529. The best alternatives for diversifying the power generation matrix in Brazil is to consider plants based on wind power and nuclear power, with composite indicator around 0.650, and natural gas power plants with multiple products. Natural gas power plants without such schemes have high composite indicators, around 0.880.
4.3. Discussion about different projects of capacity addition
The approach of constructing composite indicators allows more consistent comparison and evaluation of different power genera-tion alternatives with respect to the chosen set of sustainability
criteria.Table 8presents the relative importance of theithcriterion
(wi ij
η) for the typicaljthenergy source. These results identify which
parameters are important for lowering the composite indicator for
different energy sources. The smaller the product (wi ij
η ), the lower
the composite indicator will be. The relative importance (wi ij
η) is smaller for hydropower and nuclear power projects followed by
wind and natural gas power projects. Coal and oil energy sources
presentfigures for the relative importance as high as 0.859 and
0.659 while biomass presents a very high figure for the
im-mobilized area criterion despite the damage assignment of 15%. The important impacts regarding hydropower are energy sup-ply unreliability, use of water, immobilized area over time, and greenhouse gas emission from reservoirs in the Amazon region. The very controversial impact (immobilized area over time) is ranked third by this analysis. Although the importance assigned to immobilized area be 18%, its relative importance is very low. But we should observe two points regarding this result. First, that it
depends on the scaling procedure defined by Eq. (2), which means
that a different normalization procedure may change the relative position of the different criteria. Second, immobilized area due to large reservoirs in the Amazon region means a loss of important rain forest biodiversity. If the Brazilian society decides that the
critical values of deforestation is being trespassed there (see
Ta-ble 5– views on sustainability and values), this criterion would
move to thefirst position inTable 8. It would simply rule out new
projects of electricity generation in the Amazon region.
For nuclear power, use of water use is the main contributors to the composite indicator, followed by the immobilized area over
time to store radioactive waste and energy inefficiency. Angra 3 is
a 1400 MW pressurized water reactor that is being built in the Rio de Janeiro state near the Atlantic Ocean. The water consumed for cooling is not an important issue there because the ocean provides an almost inexhaustible water source but it could be important in other regions like the Northeast. The public view regarding the safety of nuclear power, radioactive waste and possible radiation exposure are the critical issues regarding nuclear power. A clear decision regarding recycling of the spent fuels aiming at removing transuranium materials from long-term storage would reduce this
impact indicator (seeTable B5in Appendix B).
The important impacts of wind power generation to the sus-tainability of the power generation sector is the immobilized area over time followed by energy supply unreliability. The possible important damage to sustainability due to use of natural resources was not considered in this assessment.
New natural gas projects should strive to reduce the equivalent
CO2emissions in its complete production chain, the consumption
of water, and morbidity. Natural gas technology facilitates the commercial multi-production of electricity with other services and products via co-generation or combined cycle systems, decreasing emission and water and natural resource use per unit of generated
electricity (Cardona and Piacentino, 2005).Fig. 5reveals that, for
obtaining a composite indicator lower than 0.500, the impact as-signment must fall below 60% Thus emphasizing co-generation, natural gas power plants become very competitive regarding sustainability. It can be considered an option more interesting than biomass because it can bear higher impact shares for electricity generation in multi-production systems.
Biomass facilitates the combination of the commercial
pro-duction of electricity and other services or products (Grisi et al.,
2012). Fig. 5 reveals that for obtaining composite indicators for biomass power plants below 0.500, impact assignments for the
electricity sector must be below 10%. Specifically, if we consider
the production of ethanol, sugar and heat alongside electricity generated from biomass, these projects will have composite in-dicators below 0.50, making them competitive with regard to sustainability.
For coal-, fuel oil-, and diesel-fired power plants we expect
large effects on the climate but this sustainability assessment re-vealed also the relevance of morbidity and use of water. These factors are particularly important because morbidity of the public and workers is much more frequent in the Brazilian energy in-dustry than in developed countries.
Table 7
Power generation sector indicators (ηs) for the world (2010) and Brazil (2010 and 2016)a.
World 2010 Brazil 2010 Brazil 2016
1.304 0.529 0.612
aFor biomass it was considered a 15% share of the total impact.
Table 8
Main impacts and their relative importanceafor different energy sources (w i iηj)b.
Technology Design variables related to the main impacts
Relative importance (wi ij
η )
Hydro Supply unreliability 0.189
Use of water 0.132
Area-year 0.066
Nuclear Use of water 0.213
Energy inefficiency 0.122
Area-year 0.122
Wind Area-year 0.398
Supply unreliability 0.225
Ceq emission 0.016
Natural gas Ceqemission 0.389
Use of water 0.175
Morbidity 0.091
Biomass (15% impact assessment)a
Area-year 1.127
Use of resources 0.034
Use of water 0.023
Coal Ceqemission 0.856
Morbidity 0.686
Use of water 0.343
Oil Ceqemission 0.659
Morbidity 0.491
Use of water 0.156
aThese data must be carefully considered for cases of multiple product
pro-jects.
5. Conclusions and policy implications
The common expectation of sustainability decline of the power
generation sector in Brazil is confirmed by this sustainability
as-sessment based on multi-criteria decision approach coupled with composite indicators. To accommodate legitimate opinions of stakeholders we strived to identify the object, scope, sustainability perspective, and limitations of the assessment. The main criteria considered in the assessment were climate change, immobilized area, use and process of fuel resources, water consumption, mor-bidity due to pollution, reliability of energy generation and energy
efficiency. Despite being susceptible to criticisms due to
integra-tion of complex multidimensional interacintegra-tions in one indicator, it allowed consistent comparisons among different options of capa-city addition and evidenced their consequences. For example, the results show that during 2010 and 2016 the sustainability state of the power generation sector in Brazil deteriorated: the composite impact indicator increased from 0.529 to 0.612 in six years while the current world indicator was 1.304.
Coal- and oil-fired power projects presented higher impact
indicators while hydro, nuclear and wind, the lowest. Nuclear power can avoid rapid deterioration especially for generating base load capacity in the coming years. Natural gas and biomass power projects presented intermediate impact indicators but become much more competitive relative to the sustainability indicator when they are considered as part of a multi-production system. They can reduce impact on sustainability if their power generation projects are built with lower environment footprint and include multi-production of ethanol, sugar and heat together with elec-tricity from biomass, or the co-generation of heat and combined cycles to generate electricity from natural gas.
Hydropower and wind power present high impacts for the criterion of energy generation unreliability. This indicates that for improving the sector's energy generation reliability we must in-crease the share of thermal power plants.
The approach allows a revaluation of beliefs and opinions of
decision makers and stakeholders, and suggests new specific
po-licies for capacity addition. Natural gas projects have lower impact on sustainability than biomass projects if they are designed with combined cycles or other multi-production systems. Nuclear power presents a very low composite indicator and is a good candidate to meet baseload requirements of Brazil's power gen-eration sector.
Environmentalists and other groups perceive wind power and natural gas as good candidates to improve the sustainability of the power generation sector. However, improving its sustainability
seems difficult because new projects must present a composite
impact indicator below 0.529, which is only possible with hydro-power plants. To diversify the hydro-power generation matrix and maintain the sustainability state of the power sector around 0.650 we identify few alternatives: nuclear power, wind power and
natural gas power plants with multiple products (co-generation and combined cycle systems). Such conclusions are not straight-forward because they are based on seven different criteria and
admit tradeoffs amongst different impacts and benefits, for
in-stance, environmental impacts versus energy generation
reliability.
The results of this work suggest that Brazilian decision makers should adopt assessments of sustainability as a means to help decision-making about capacity addition. It provides a consistent appreciation of decision consequences, and may help reviewing opinions and restrictions of different stakeholders.
Acknowledgments
The authors wish to thank Capes (Coordenação de Aperfei-çoamento de Pessoal de Nível Superior) for the research grant provided for this study. The authors want also to acknowledge the invaluable contributions of the reviewers regarding sustainability issues and energy policy in Brazil.
Appendix A. Identification of institutions
ANEEL (National Agency of Electric Energy)–Regulate andsu-pervise the electric power industry from generation to commercialization.
EPE (Energy Research Company)–Conduct prospective studiesfor short, medium and long term planning of the energy sector; conduct with CCEE auctions for new power generation projects.
IBAMA (National Agency for Environmental Protection) –Im-plement national environmental policies and conduct environ-mental licensing.
ONS (National Operator of the Electric System)–Coordinate andcontrol the operation of generation and transmission of elec-tricity in the national interconnected system.
CCEE (Chamber of Electricity Trade) – Implement rules andprocedures for energy trade; conduct auctions for purchase and sale of energy under delegation of ANEEL.
Appendix B. Data collected in the literature
This appendix presents the data collected from the literature to obtain the technical indicators for different energy sources. The reference sources are indicated in each table. The tables present
the maximum and minimum figures obtained for technical
in-dicators when more than one reference source was available. SeeTable B1–B6.
Table B1
Technical indicators for the emission of CO2equivalents for different energy sourcesa.
Source of electricity CO2eq (kg/MWh)
References [A]b [B] [C] [D] [E] [F] [G] [H]
Biomass – – 36–100 10–800 15–50 37–116 116 37–166
Coal 1255 1078 760–280 900–1150 190–1100 860–1290 1290 800–1300
Wind – – 4–24 9–100 10–20 11–75 75 11–75
Natural gas – 512 360–800 400–500 250-500 460–1234 1234 460–1230
Hydro 6.55 25.2 0–36 2–50 100 16–410 410 2–410
Nuclear 8.59 2.77 2–20 15–50 40 2.0–437 30 9–100
Oil 746 847 520–1160 780–880 – 689–890 990 690–870
aComplete life cycle.
bA (Baldasano et al., 1999); B (Lee et al., 2004); C (Weisser, 2007); D (Gagnon et al., 2002); E (IPCC, ,2007); F (Goldemberg and Lucon, 2008); G (IAEA, 1997;Rashad and
Hammad, 2000); and H (Holdren and Smith, 2000).