Sara Filipa Rato Bispo
Analysis of glycosylation
heterogeneity in antibody production
by
Pichia pastoris
Lisboa
Analysis of glycosylation
heterogeneity in antibody production
by
Pichia pastoris
Sara Filipa Rato Bispo
Dissertação apresentada na Faculdade de Ciências e Tecnologia da
Universidade Nova de Lisboa para obtenção do grau de Mestre em
Biotecnologia.
Tese orientada por: Professor Doutor Rui Oliveira
Lisboa
2009
A
CKNOWLEDGMENTSEm primeiro lugar queria agradecer à minha família em especial aos meus pais pelo carinho e toda a compreensão, aos meus avós e ao meu querido irmão por todo o apoio.
Queria agradecer ao Prof. Rui Oliveira pela orientação, à Ana Ferreira pela ajuda e apoio, ao João Dias, e a todos da Unidade Piloto do Instituto de Biologia Experimental e Tecnológica.
A todos os meus amigos e em especial à Ana Catarina por viver comigo todos os momentos, bons e maus.
Ao meu namorado e amigo, Marco, por partilhar a minha vida sempre com uma palavra de motivação e encorajamento.
Pichia pastoris and to assess O-glycosylation heterogeneity theoretically and experimentally. All possible glycoforms (glycans that are attached to proteins) attached to this antibody were calculated and a simple mathematical model was developed in MATLAB to predict glycoforms heterogeneity.
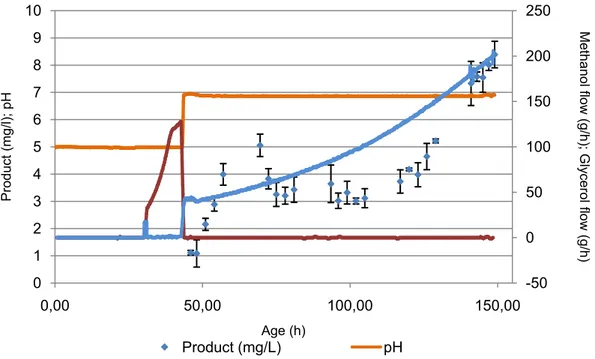
The production of Anti-(ED-B) scFv by Pichia pastoris was made in a 50 L fed-batch fermenter. The maximum product concentration obtained at approximately 100 hours of operation was 8,4mg/L.
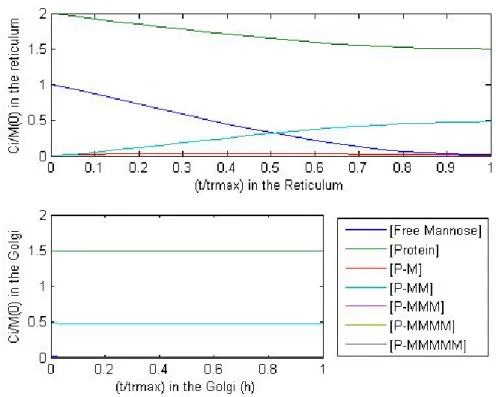
The Anti-(ED-B) scFv has no sequence of N-linked glycosylation and for the sequence of O-linked glycosylation there are 56 possible spots. Two mathematical models were developed in MATLAB: a deterministic and a stochastic model. Both models predict a given glycoforms distribution under the premise that the Endoplasmatic Reticulumenzymes and Golgi enzymes (O-Mannosyltranferase, α -1,2-Mannosyltransferase and β-1,2-Mannosyltransferase) are active. The models predict when the ratio of protein concentration per initial mannose concentration is low the prevalent glycoforms are protein with two mannoses. While when the ratio of protein concentration per initial mannose concentration is very low, the prevalent glycoforms are protein with five mannoses. For high number of mannose molecules at the beginning of the glycosylation process there is a convergence of results predicted by the deterministic and stochastic models. However, both models diverge when the number of mannose molecules is very low. In this situation, the stochastic predictions are more consistent with the true nature of the system than the deterministic ones.
Despite of a theoretical O-linked glycoforms distribution, experimental test by Glycoprotein Detection Kit showed that the anti-(ED-B) scFv produced by Pichia
pastoris is not glycosylated at the tested culture conditions.
The posttranslational modifications that lead to the formation of monomers or dimers are not related to glycosylation but probably to the folding process.
In future studies it would be interesting to study if the occurrence of O-glycosylation and its heterogeneity can be controlled by reactor operation parameters such as Temperature, pH and methanol feeding rate. It is known that such operational parameters have an important impact on the conformation of the scFv.
Universidade Nova de Lisboa – Faculdade de Ciências e Tecnologia Analysis of glycosylation heterogeneity in antibody production by Pichia pastoris
R
ESUMOOs objectivos desta tese de mestrado são produzir um fragmento de anticorpo na levedura Pichia pastoris e avaliar teoricamente e experimentalmente a heterogeneidade da O-glicosilação. Todas as possíveis glicoformas (glicanos que estão ligados às proteínas) que estão ligadas ao anticorpo foram calculadas e desenvolveu-se em MATLAB modelos matemáticos simples para prever a heterogeneidade das glicoformas.
A produção do scFv Anti-(ED-B) na Pichia pastoris foi efectuada num fermentador fed-batch de 50 L. A concentração máxima de produto obtida a aproximadamente 100h foi de 8,4mg/L.
O Anti-(ED-B) scFv não possui sequência para N-glicosilação e para a O-glicosilação existem 56 sítios possíveis. Foram desenvolvidos dois modelos matemáticos em MATLAB: o determinístico e o estocástico. Ambos os modelos prevêem uma distribuição de glicoformas sob a premissa que as enzimas do Retículo Endoplasmático e do Golgi (O-Mannosyltranferase, α-1,2-Mannosyltransferase and
β-1,2-Mannosyltransferase) estão activas. Os modelos estimam que quando o rácio da concentração de proteína por concentração de manose inicial é baixo, a glicoforma predominante é proteína com uma manose. Enquanto que quando o rácio da concentração de proteína por concentração de manose é ainda menor, a glicoforma predominante é proteína com cinco manoses. Para números elevados de moléculas manose no inicio do processo de glicosilação existe uma convergência dos resultados previstos segundo os modelos determinístico e estocástico. Contudo, ambos os modelos divergem quando o número de moléculas manose é muito baixo. Neste contexto, o modelo estocástico é mais coerente com a verdadeira natureza do sistema que o modelo determinístico.
Apesar da distribuição teórica das glicoformas O-linked, o kit laboratorial de detecção de glicoproteínas indica que o anti-(ED-B) scFv produzido pela Pichia
pastoris não é glicosilado, nas condições da cultura efectuada.
As modificações pós-traducionais que levam à formação dos monómeros ou dímeros não estão relacionadas com a glicosilação mas estão provavelmente ligadas com o processo de folding.
Universidade Nova de Lisboa – Faculdade de Ciências e Tecnologia Analysis of glycosylation heterogeneity in antibody production by Pichia pastoris
A
BBREVIATION1,2-ManT α-1,2-Mannosyltransferase 1,6-ManT α-1,6-Mannosyltransferase A Stochiometric matrix
ADP Adenosine-5’-diphosphate
Age Time in hours since the inoculum was transferred into the pilot fermenter
Asn Asparagine ATP Adenosine-5'-triphosphate BCA Bicinchoninic acid
BSA Bovine serum albumin
Ci Concentration of the several compounds
CP Protein concentration
CM Mannose concentration
CPM Concentration of protein with one mannose
CPM2 Concentration of protein with two mannoses CPM3 Concentration of protein with three mannoses CPM4 Concentration of protein with four mannoses CPM5 Concentration of protein with five mannoses CHCA α-ciano-4-hydroxycinaminic acid
Dol-P Dolichol phosphate E.R. Endoplasmic reticulum E.R. α-Man E.R. α-mannosidase ED-B Extra domain B
ELISA Enzyme-Linked Immunosorbent Assay EndoF Endoglycosidase F
EndoH Endoglycosidase H
ERAD ER-associated protein degradation Gal Galactose
GDP Guanosine-5'-diphosphate
Glc Glucose
Glc I α-glucosidase I Glc II α-glucosidase II GlcNac N-acetylglucosamine
Man Mannose
MALDI Matrix-assisted laser desorption/ionization
MS Mass spectrometry
MUT Methanol UTilization
Neu5Ac N-Acetylneuraminic acid Neu5Ac N-Acetylneuraminic acid OD Optical density
OPD o-Phenylenediamine dihydrochloride OST N-Oligosaccharyl transferase
P Protein non-glycosylated
PAS Periodic Acid-Schiff PBS Phosphate buffered saline PM1 Protein with one mannose
PM2 Protein with two mannoses
PM3 Protein with three mannoses
PM4 Protein with four mannoses
PM5 Protein with five mannoses
PNGase Peptide N-Glycosidase F Q Feeding rate (g/h)
Q0, Gly Initial feeding rate (g/h) RNA Ribonucleic acid ri Kinetic constant
scFv Single-chain antibody of variable fragment
SDS-PAGE SodiumDdodecyl Sulfate PolyAcrylamide Gel Electrophoresis Ser, S Serine
SRP Signal recognition particle tr Residence time
Thr, T Threonine
TOF Time-of-flight
UDP Uridine diphosphate
μ1 / μ2 Desired specific growth rate
VH Variable heavy domain
VL Variable light domain
Universidade Nova de Lisboa – Faculdade de Ciências e Tecnologia Analysis of glycosylation heterogeneity in antibody production by Pichia pastoris
L
IST OF CONTENTSAbstract ... I
Resumo ... II
Abbreviation ... IV
List of figures ... VIII
List of tables ... XI
1. Introduction ... 1
1.1. Protein of interest ... 1
1.2. Expression system ... 2
1.3. Fermentation ... 3
1.4. Glycosylation ... 4
1.4.1. Processing of N‐linked Oligosaccharide ... 7
1.4.2. Processing of O‐linked Oligosaccharide ... 10
2. Materials and Methods ... 12
2.1. Culture Mediums ... 12
2.2. Fermentation ... 12
2.3. Biomass determination ... 14
2.4. ELISA‐assay (for one plate) ... 14
2.5. Purification ... 15
2.6. BCA Protein Assay Kit ... 16
2.7. MALDI ... 17
2.8. Bioinformatic methods ... 18
2.8.1. Peptide Cutter ... 18
2.8.2. Peptide Mass ... 19
2.8.3. GlycoMod ... 19
2.9. Glycosylation mathematical models ... 20
2.10. Glycoprotein Detection Kit ... 23
3. Results ... 25
3.1. Fermentation ... 25
3.2. BCA Protein Assay kit ... 27
3.3. MALDI analysis ... 28
3.4. Bioinformatic methods ... 31
4.1. Fermentation ... 49
4.2. Proteins Assay Kit ... 51
4.3. MALDI and Bioinformatic methods ... 52
4.4. Glycosylation mathematical models ... 55
4.5. Glycoprotein Detection Kit ... 57
5. Conclusion ... 59
6. References ... 61
7. Annex ... I
Annex A ... I
Annex B ‐ ELISA Technique ... II
Annex C ... V
Annex D ... VI
Annex E ... VIII
Annex F ... IX
Annex G – Method for release of O‐linked glycans... X
Annex H – Glycosylation mathematical models code ... XI
Universidade Nova de Lisboa – Faculdade de Ciências e Tecnologia Analysis of glycosylation heterogeneity in antibody production by Pichia pastoris
L
IST OF FIGURESFigure 1.1 – Representation of the pPIC9K vector (Invitrogen®). The gene of the target foreign protein is placed in the multiple cloning site. ... 3 Figure 1.2 ‐ Model for Co‐translational targeting (Corsi, et al., 1996). ... 6 Figure 1.3 – Model for Post translational targeting (Rapoport, 2007). ... 7 Figure 1.4 – Model of dolichol pathway of N‐linked protein glycosylation in Saccharomyces cerevisiae (Weerapana, et al., 2006) ... 7 Figure 1.5 – Pathway of N‐glycosylation in E.R. of Saccharomyces cerevisae. OST – N‐ Oligosaccharyl transferase; Glc I ‐ α‐glucosidase I; Glc II α‐glucosidase II; ER α‐Man ‐ ER α‐ mannosidase. Adapted from (Herscovics, 1999). ... 9 Figure 1.6 ‐ Pathway of N‐glycosylation in Golgi of Pichia pastoris. 1,2‐ManT ‐ α‐1,2‐ Mannosyltransferase; 1,6‐ManT ‐ α‐1,6‐Mannosyltransferase. Adapted from (Hamilton, et al., 2007) ... 10 Figure 1.7 – Pathway of O‐glycosylation in E.R. and Golgi of Saccharomyces cerevisiae
(Herscovics, et al., 1993) ... 11 Figure 1.8 – Structure of O‐glycans from Pichia pastoris (Goto, 2007) ... 11 Figure 2.1 – Glycosylation model in P pastoris: analogy with a Plug Flow Reactor (PFR) system
... 21 Figure 3.1 – Fermentation variables over time. It should be noticed that the temperature and the airflow rate are overlapped. ... 25 Figure 3.2 – Carbon sources feeding, glycerol and methanol; pO2 and agitation over
fermentation time. ... 25 Figure 3.3 – Feeding rates of carbon sources, glycerol and methanol; ph and product concentration over time. ... 26 Figure 3.4 ‐ Results of the biomass determination with OD (595nm) and wet weight and product concentration with ELISA assay (Annex B), over fermentation time. ... 26 Figure 3.5 – Calibration curve for BCA Protein Assay Kit with BSA as standard protein (data in Annex A). ... 27 Figure 3.6 – MALDI spectrum of intact protein. Zoom in of the major peaks in Annex C. ... 28 Figure 3.7 – MALDI spectrum of the protein cleaved by trypsin. List of the peaks of this spectrum in Annex D, Table 7.5. ... 29 Figure 3.8 – MALDI spectrum of the protein cleaved by trypsin and PNGase F. List of the peaks of this spectrum in Annex D, Table 7.6Table 7.5. ... 30 Figure 3.9 – Aminoacid sequence of AP039. ... 31 Figure 3.10 – Deterministic model results with a ratio of CP/CM0 of 0,3; and 100 mannose
molecules at the entrance of PFR. ... 32 Figure 3.11 – Deterministic model results with a ratio of CP/CM0 of 0,8; and 100 mannose
molecules at the entrance of PFR. ... 33 Figure 3.12 – Zoom in the graphic of Golgi of Figure 3.11. ... 34 Figure 3.13 ‐ Deterministic model results with a ratio of CP/CM0 of 2; and 100 mannose
mannose molecules at the entrance of PFR. ... 37 Figure 3.17 – Stochastic model results with a ratio of CP/CM0 of 0,8 and 100 mannose molecules
at the entrance of PFR. ... 38 Figure 3.18 – Histograms of the stochastic model results with a ratio of CP/CM0 of 0,8 and 100
mannose molecules at the entrance of PFR. ... 38 Figure 3.19 – Stochastic model results with a ratio of CP/CM0 of 2 and 100 mannose molecules
at the entrance of PFR. ... 39 Figure 3.20 – Histograms of the stochastic model results with a ratio of CP/CM0 of 2 and 100
mannose molecules at the entrance of PFR. ... 40 Figure 3.21 – Deterministic model results with a ratio of CP/CM0 of 0,3; and 5000 mannose
molecules at the entrance of PFR. ... 41 Figure 3.22 – Stochastic model results with a ratio of CP/CM0 of 0,3 and 5000 mannose
molecules at the entrance of PFR. ... 42 Figure 3.23 – Deterministic model results with a ratio of CP/CM0 of 0,2 and 30 mannose
molecules at the entrance of PFR. ... 43 Figure 3.24 ‐– Stochastic model results with a ratio of CP/CM0 of 0,2 and 30 mannose molecules
at the entrance of PFR. ... 44 Figure 3.25 – Histograms of the stochastic model results with a ratio of CP/CM0 of 0,2 and 30
mannose molecules at the entrance of PFR. ... 44 Figure 3.26 ‐ Deterministic model results with a ratio of CP/CM0 of 0,4 and 30 mannose
molecules at the entrance of PFR. ... 45 Figure 3.27 – Stochastic model results with a ratio of CP/CM0 of 0,4 and 30 mannose molecules
at the entrance of PFR. ... 46 Figure 3.28 – Histograms of the stochastic model results with a ratio of CP/CM0 of 0,4 and 30
mannose molecules at the entrance of PFR. ... 47 Figure 3.29 – Picture of the Gel with the glycoprotein detection kit. The wells G, H and I are the HPR (Positive standard) with 3µg, 6µg and 12µg respectively. ... 48 Figure 3.30 ‐ Picture of the Gel with the glycoprotein detection kit and the Simple blue. The wells A, B and C are BSA (Negative control) with 3µg, 6µg and 12µg respectively; D, E and F are scFv with 5,91µg, 11,82µg and 23,64µg respectively; and G, H and I are the HPR (Positive standard) with 3µg, 6µg and 12µg respectively. ... 48 Figure 4.1 – Zoom of the Figure 3.2. Carbon sources feeding, glycerol and methanol; pO2 and
agitation between 20h‐60h of fermentation. In this figure is also represented the three distant phases of the fermentation. ... 50 Figure 7.1 – Calibration curve for this ELISA plate. ... II Figure 7.2 – The concentrations of the product over time. ... IV Figure 7.3 – Zoom in of the first peak of MALDI spectrum of intact protein. ... V Figure 7.4 – Zoom in of the second peak of MALDI spectrum of intact protein. ... V Figure 7.5 – Zoom of in the third peak of MALDI spectrum of intact protein. ... V Figure 7.6 – Schematic representation of the structure of scFv dimmers. VL – variable light
Universidade Nova de Lisboa – Faculdade de Ciências e Tecnologia Analysis of glycosylation heterogeneity in antibody production by Pichia pastoris
4Centrifugal Filter with their dilution factor. ... 27 Table 3.2 ‐ List of the peptide sequence and their masses (from PeptideCutter and PeptideMass). ... 31 Table 3.3 – Determination of possible glycoforms by GlycoMod. ... 32 Table 3.4 – Composition out of the Golgi in a deterministic model with a ratio of CP/CM0 of 0,3;
and 100 mannose molecules at the entrance of PFR. ... 33
Table 3.5 - Composition out of the Golgi in a deterministic model with a ratio of CP/CM0
of 0,8 ; and 100 mannose molecules at the entrance of PFR. ... 34 Table 3.6 – Composition out of the Golgi in a deterministic model with a ratio of CP/CM0 of 2
and 100 mannose molecules at the entrance of PFR. ... 36 Table 3.7 – Composition out of the Golgi in a stochastic model with a ratio of CP/CM0 of 0,3 and
100 mannose molecules at the entrance of PFR. ... 37 Table 3.8 – Composition out of the Golgi in a stochastic model with a ratio of CP/CM0 of 0,8 and
100 mannose molecules at the entrance of PFR. ... 39 Table 3.9 – Composition out of the Golgi in a stochastic model with a ratio of CP/CM0 of 2 and
100 mannose molecules at the entrance of PFR. ... 40 Table 3.10 – Composition out of the Golgi in a deterministic model with a ratio of CP/CM0
CPCM0 of 0,3 and 5000 mannose molecules at the entrance of PFR. ... 41 Table 3.11 – Composition out of the Golgi in a stochastic model with a ratio of CP/CM0 of 0,3
and 5000 mannose molecules at the entrance of PFR. ... 42 Table 3.12 ‐ Composition out of the Golgi in a deterministic model with a ratio of CP/CM0 of 0,2
and 30 mannose molecules at the entrance of PFR. ... 43 Table 3.13 – Composition out of the Golgi in a stochastic model with a ratio of CP/CM0 of 0,2
and 30 mannose molecules at the entrance of PFR. ... 45 Table 3.14 – Composition out of the Golgi in a deterministic model with a ratio of CP/CM0 of 0,4
and 30 mannose molecules at the entrance of PFR. ... 46 Table 3.15 – Composition out of the Golgi in a stochastic model with a ratio of CP/CM0 of 0,4
Universidade Nova de Lisboa – Faculdade de Ciências e Tecnologia Analysis of glycosylation heterogeneity in antibody production by Pichia pastoris
The aim of this study is to produce an antibody fragment in Pichia pastoris, applying the knowledge of metabolic modeling (Jahic, et al., 2002) (this isn’t the principal aim so the data isn’t provided); to find out the possible glycoforms (glycans that are attached to proteins) attached to this antibody and to develop some technique to detect and quantify the glycoforms (Morelle, et al., 2005), since the glycosylation can affect the properties of the proteins (Leibiger, et al., 1999 ); and to begin some programs to visualize the distribution of glycofoms in the proteins (Shelikoff, et al., 1996; Hossler, et al., 2006). It is important to find techniques that are able to manipulate the production of proteins with correct glycosylation, for that to happen it is necessary to know correctly how the glycoforms are produced and have this information in the metabolic network (Gonzalez, et al., 2001; Umaña, et al., 1997).
The introduction begins to explain the protein itself, a brief explanation of the production process and ends with description of glycosylation in Pichia pastoris, since this information is hard to find and it is very important to know, case in future, this information is going to be use in metabolic modeling.
1.1. Protein of interest
In the last decades, many monoclonal antibodies were studied with the purpose of therapeutic applications, in particular cancer treatments.
The protein of interest in this study is Anti-ED-B Fibronectin antibody fragment.
The fibronectin is a universal cell-adhesion molecule which has an alternative splicing. This splice variants is ED-B fibronectin. This molecule is undetectable in normal adult tissue, although it exhibits great expression in fetal and tumor tissues. This protein is also associated with tissue remodeling during a wound healing and with neovasculature solid tumor (like invasive ductal carcinoma, aggressive brain tumor and ocular angiogenesis) (Berndorff, et al., 2006; Philogen®). During angiogenesis the ED-B fibronectin is accessible from the blood stream – so these properties make it a perfect marker for angiogenesis (Berndorff, et al., 2005).
Universidade Nova de Lisboa – Faculdade de Ciências e Tecnologia Analysis of glycosylation heterogeneity in antibody production by Pichia pastoris
identify and accumulate into the tumor and be eliminated from the blood stream, not causing toxicity to healthy tissues (Berndorff, et al., 2005). That molecule can be a single-chain antibody of variable fragment (scFv) and in our case of study is the anti-ED-B fibronectin antibody fragment – anti-anti-ED-B scFV.
The purpose of develop this antigen is to fuse him to a cytokine (a signaling molecule). This aggregate will target the ED-B fibronectin which are at the tumor site – therefore it localizes efficiently the tumor. If the cytokine has some properties to treat or to keep apart the tumor from the rest of the healthy cells, the aggregate accomplish two different and very important tasks (Philogen®).
1.2. Expression system
The production of recombinant proteins has been studied in prokaryotic and eukaryotic expression systems.
The production of eukaryotic proteins in bacteria has problems due to instability or lack of biological activity; and, in some cases, bacterial compounds can cause several toxicity reactions in humans and in animals, despite the careful purification methods.
If the aim is for medical use, the recombinant proteins must be identical to the natural proteins in all its proprieties. For this to occur, it is necessary that the expression systems are able to accomplish all of the post-translational modifications; some examples are the correct disulfide bonds and the glycosylation process.
The Pichia pastoris expression system is a very popular system because it has
a number of advantages in comparison with other yeast systems: the expression vector is highly efficient and tightly regulated; it produces large amounts of protein; and, normally, it secretes very few proteins (including proteolytic enzymes with the ability to degrade product), which it is an advantage for the purification process (Glick, et al., 2003).
Pichia pastoris is a methylotrophic yeast; it is regulated by the promoter of the
methanol inducible gene that encodes for alcohol oxidase – the first enzyme of the methanol pathway.
Figure 1.1 – Representation of the pPIC9K vector (Invitrogen®). The gene of the target foreign protein is placed in the multiple cloning site.
The regulation is provided by AOX gene – at transcriptional level – when methanol is present in the medium, it triggers the transcription of the foreign gene. In the absence of methanol, the expression of that gene is completely turned off. This promoter enables large-scale production of high amounts of recombinant protein, since it’s a strong promoter that responds rapidly to the presence/absence of methanol in medium (Glick, et al., 2003).
1.3. Fermentation
Optimal cultivation strategies for the production of heterologous protein in
Pichia pastoris have been developed by many researchers (e.g. Cunha, et al., 2004,
Damasceno, et al., 2004, Hellwig, et al., 2001, Cos, et al., 2006, d’Anjou, et al., 2000). Most of these studies aim at maximizing product titer at the end of the cultivation. There are no works in the literature that study the effect of cultivation conditions on glycosylation patterns in P. pastoris.
In a typical high cell density MUT P. pastoris strain two different carbon sources are utilized, namely glycerol and methanol.
Universidade Nova de Lisboa – Faculdade de Ciências e Tecnologia Analysis of glycosylation heterogeneity in antibody production by Pichia pastoris
As stated previously (1.2. Expression system), the expression of scFv is regulated by the alcohol oxidase promoter. Thus the presence of methanol triggers the production of the protein. However, the feeding of methanol is not straightforward since the methanol is both an inhibitor and an inducer substrate and at the same time could be inhibitory for the cellular growth (methanol concentration 65g/L). The decision of the methanol feeding strategy in the post-induction phase is thus a critical point in MUT P.
pastoris cultures (Cunha, et al., 2004; d’Anjou, et al., 2000).
In the transition between the glycerol phase to the methanol phase there is a short moment in time with both methanol and glycerol present in the medium. A small injection of methanol (~1 g/l) is fed before the end of the glycerol exponential feeding. This procedure has the purpose to stimulate the synthesis of alcohol oxidase and consequently accelerate the adaption to methanol feeding in the second stage.
For maximizing the production of both cellular growth and protein production other parameters like temperature, pH, oxygen levels and agitation need to be considered. The conditions of all of these parameters and the feeding of the carbon source can shape the synthesis, processing, secretion of the protein and the cellular growth; and change some specific characteristics of the protein produced (Cos, et al., 2006; Cunha, et al., 2004). One still open issue is to understand the controllability of glycosylation patterns by manipulating such operational parameters.
1.4. Glycosylation
Pichia pastoris combines the simple cellular maintenance like the lower
organisms, such as bacteria, with the posttranslational processing machinery of eukaryotes (Cos, et al., 2006).
Glycosylation is one modification that can occur in protein biosynthesis, after or during the translation. Others modifications that occur are:
- Formation of disulfide bonds; - Proper folding;
- Specific proteolytic cleavages;
- Assembly into multimeric proteins (Lodish, et al., 1999).
Before developing this topic, it is important to mention that glycosylation in
mechanisms are general in yeast; or if it they are particular of the one or the other species.
The polypeptides chain that have to walkthrough the secretory pathway begin their path in the Endoplasmic reticulum (E.R.), pass in Golgi apparatus, form a vacuole or a lysosome and the final step is crossing the plasma membrane to the extracellular medium (Corsi, et al., 1996).
When the polypeptides are being translated they have an E.R. signal sequence normally localized in N-terminus. This sequence is typically formed by one or more positively charged amino acids followed by continuous sequence of 6-12 hydrophobic residues (Lodish, et al., 1999).
The translocation, crossing through E.R. membrane, has two possible pathways in yeast, including Pichia pastoris. The first one is Co-translational targeting: at the same time the polypeptide is being translated, it is also being transferred for E.R. lumen; the second one is Post-translational: first the polypeptide is translated and only after that it is transferred to E.R. lumen. It appears that the latter pathway is more frequently used (by a larger fraction of intracellular proteins) because the process of translation doesn’t always happen close to the E.R. (Corsi, et al., 1996; Rapoport, 2007).
Co-translational targeting
Universidade Nova de Lisboa – Faculdade de Ciências e Tecnologia Analysis of glycosylation heterogeneity in antibody production by Pichia pastoris
Figure 1.2 - Model for Co-translational targeting (Corsi, et al., 1996).
Post translational targeting
After translation the polypeptide chain is protected by cytosolic chaperones. The chaperones are proteins which help the polypeptide chain to remain unfolded and prevent the attack of proteases.
Figure 1.3 – Model for Post translational targeting (Rapoport, 2007).
1.4.1. Processing of N-linked Oligosaccharide
Assembly and Transfer of N-linked Oligosaccharide precursor
Before the N-linked Oligosaccharide is transferred to the protein that enters the E.R., this molecule needs to be synthesized.
Figure 1.4 – Model of dolichol pathway of N-linked protein glycosylation in Saccharomyces cerevisiae (Weerapana, et al., 2006)
In higher eukaryotic systems the dolichol pathway is highly conserved (Figure 1.4): the glycan is transferred into asparagine site chain (Glc3Man9GlcNac2β1,N-Asn)
within Asn-X-Ser/Thr sequence (where X is any aminoacid except proline) (Kukuruzinska, et al., 1998; Helenius, et al., 2004; Weerapana, et al., 2006).
Universidade Nova de Lisboa – Faculdade de Ciências e Tecnologia Analysis of glycosylation heterogeneity in antibody production by Pichia pastoris
of UDP-Man and UDP-GlcNac in the cytosol. After that, the heptasaccharide is flipped into the E.R. lumen with the membrane-spanning flippase (Rft1p). This enzyme is bi-directional and ATP-independent.
The remaining steps are performed with mannosyltransferase which transfers mannose from Dol-P-Man and glucosyltransferase which transfers glucose from Dol-P-Glc (Weerapana, et al., 2006). The limitations in these steps are the formation of Dol-P-Man and Dol-P-Glc in the E.R. at the cytosolic site and their flip to the E.R. lumen (Burda, et al., 1999).
It is important to refer that the dolichol phosphate (Dol-P) is recycled, in all steps of this procedure.
Once the precursor is formed, it will be transferred to the protein by the N- Oligosaccharyl transferase complex (OST). This complex is a multimeric, membrane associated enzyme, with an active site disposed into ER lumen.
In E.R., after the transfer of N-linked oligosaccharides, these glycans are trimmed – Figure 1.5 (Bretthauer, et al., 1999; Kukuruzinska, et al., 1987; Vervecken,
et al., 2004). The three glucose residues are removed by α-glucosidase I for the first
glucose residue, and α-glucosidase II for the next two glucose residues. The
α-1,2-linked mannose is trimmed by E.R. α-mannosidase. So at this point, the protein has the N-linked Man8GlcNAc2 and it is prepared to follow the path for the Golgi
Figure 1.5 – Pathway of N-glycosylation in E.R. of Saccharomyces cerevisae. OST – N-Oligosaccharyl transferase; Glc I - α-glucosidase I; Glc II α-glucosidase II; ER α-Man - ER α -mannosidase. Adapted from (Herscovics, 1999).
Passing from ER to Golgi apparatus
If the protein has the correct fold, it is transported to the Golgi apparatus; otherwise it goes to the ER-associated protein degradation (ERAD) pathway. The folded-glycoprotein is transported to Golgi in a vesicle (Lee, et al., 2004).
It is important to refer that the Golgi apparatus in Pichia pastoris has three to five separate Golgi stacks, each of them adjacent to ER. In this respect, P. pastoris is very similar to mammalian Golgi, unlike Saccharomyces cerevisiae which has a disperse Golgi (Mogelsvang, et al., 2003, Rossanese, et al., 1999).
Transformation in Golgi apparatus
It is in this step where Pichia pastoris differs from mammal cells. In mammal cells the Man8GlcNAc2 glycans are trimmed to Man5GlcNAc2 and then more
monosaccharides are added (like Gal, GlcNAc, and Neu5Ac).
In yeast, the Man8GlcNAc2 glycans aren’t trimmed but usually elongated further,
hype chara activ ManT 1.6). pasto (Bret Figur Mann 2007 relati or th that i phos forma cytos
al., 1
subs subs
al., 1
An
ermannosyl acterization
In Pichia
ve are: α-1,2 T), which
No α
-1,3-oris doesn’t
tthauer, et a
re 1.6 - Pa nosyltransfer
)
1.4.2. P
The bio ively simple reonine (Th As in N-in the Golgi
In E.R., sphate-man ation of Do sol (this lim
993). The first sequent ma sequent ma 993). Un nalysis of gly
glycans c n of the glyc
a pastoris G
2-Mannosyl transfer α -Mannose li t have or d
al., 1999).
athway of N rase; 1,6-Ma
Processing
osynthesis e. The O-lin hr, T) of the
-glycosylatio
i.
the first ma nose protei l-P-Man in itation is ve
t and secon annoses ar
nnose resid
niversidade ycosylation h
could be o coproteins.
Golgi, the on
transferase
α-1,2-Manno inkages are oesn’t utiliz
N-glycosylatio anT - α-1,6-M
of O-linke
of O-glyco ked oligosa
polypeptide on, the syn
annose resi in mannosy E.R. at cyto ery similar to
nd mannos re transferr dues are tra
Nova de Lis heterogeneit
one of the
nly enzyme e (1,2-ManT ose and α e observed ze α-1,3-Ma
on in Golgi Mannosyltran
d Oligosac
osylation in accharide ch
e chain. nthesis of O
idue is tran yltyransferas
osolic site – o the limitat
se residues ed in the ansferred d
sboa – Facu ty in antibod
restriction
es for glycos T) and α-1,6
α-1,6-Mann
in Pichia pa
annosyltrans
i of Pichia nsferase. Ad
ccharide
compariso hain can be
O-glycans b
sferred from se). This pr – the lack o
tion in N-gly
are transfe
Golgi (Figu
directly from
ldade de Ciê dy production
ns for com
sylation pro 6-Mannosylt nose, respe
astoris, this
sferase in t
pastoris. 1 dapted from
on with N-e attachN-ed t
egins in the
m Dol-P-Ma rocess has of availabilit ycosylation
erred in the ure 1.7). T m GDP-Man
ências e Tec n by Pichia p
mplete mole
ocessing tha transferase ectively (F meaning th the glycosy
,2-ManT - (Hamilton,
-glycosylatio o serine (Se
e E.R. and
an (with dol a limitation ty of manno ) (Herscovi
e E.R. whil The second n (Herscovic cnologia pastoris ecular at are e (1,6-Figure hat P.
ylation
α -1,2-et al.,
on is er, S) after ichol-step: ose in cs, et
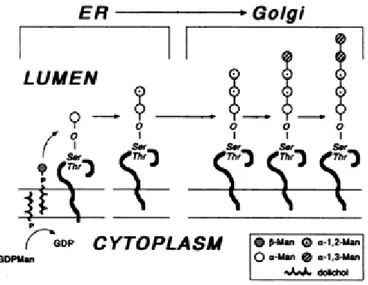
Figure 1.7 – Pathway of O-glycosylation in E.R. and Golgi of Saccharomyces cerevisiae (Herscovics, et al., 1993)
In yeast, and in particularly in Pichia pastoris, the structures of O-linked Oligosaccharides can have a maximum of five mannoses, represented in Figure 1.8 (Goto, 2007).The enzymes involved are O-mannosyltranferase for the first mannose, α -1,2-Mannosyltransferase for the second and third mannoses and β -1,2-Mannosyltransferase for the fourth and fifth mannoses.
Figure 1.8 – Structure of O-glycans from Pichia pastoris (Goto, 2007)
.
. .
. .
. .
Universidade Nova de Lisboa – Faculdade de Ciências e Tecnologia Analysis of glycosylation heterogeneity in antibody production by Pichia pastoris
2. Materials and Methods
2.1. Culture Mediums
For the pre-inoculum and inoculum: H3PO4 (85%) 26,7ml; CaSO4 0,93 g/L;
K2SO4 18,2 g/L; MgSO4.7H2O 14,9 g/L; KOH 4,13 g/L; C3H5(OH)3 40 g/L plus the
solution of trace metals.
The solution of Trace metals: CuSO4.5H2O 6 g/L; NaI 0,08 g/L; MnSO4.H2O 3
g/L; Na2MoO4.2H2O 0,2 g/L; H3BO3 0,2 g/L; CoCl2 0,5 g/L; ZnSO4 20 g/L; FeSO4.7H2O
65 g/L; biotin 0,2 g/L; H2SO4 5 ml.
The medium for the fermentation is the same than the inoculum except that it doesn’t contain the solution of Trace metal and contains an antifoam, SAG 471, 0,2 g/L.
2.2. Fermentation
A 125ml T-flask with 40ml of BSM medium was inoculated with one cryovial from Pichia pastoris cell bank and incubated for 72 to 90 hours at 30ºC with agitation of 150rpm. A 2L flask with 750ml of BSM medium was inoculated with 10ml of the pre-inoculum – this shake flask culture had the duration of 72 hours at 30ºC with agitation of 150rpm. The resulting inoculum was finally transferred to the pilot fermenter with 15L of BSM medium – starting volume. The fermentation was conducted up to a maximum of 30L working volume in a pilot 50L fermenter (50L Laboratory Pilot Fermenter Type LP351, Bioengineering AG, Wald, Switzerland).
As described in the introduction, the fermentation had three phases with the control parameters changing from phase to phase.
The airflow rate was kept constant during all three phases, at 30 l/min.
The temperature during phase I and phase II are constant at 30ºC; in phase III until 50h follow the Equation 2.1, after 50h temperature is constant at 30ºC.
0,1973 20,0319 Equation 2.1
0,008 6,8218 Equation 2.2
with Age – time in hours since the inoculum was transferred into the pilot fermenter .
The agitation during phase I and II is constant at 300 rpm while in phase III it is manipulated between 300 to 1000 rpm to maintain pO2 at a constant setpoint.
The pO2 is also controlled by methanol feeding manipulation during the phase
III after the reactor reaches the maximum oxygen transfer capacity (i.e. after the stirrer speed reaches 1000 rpm). The pO2 set-point was set to 20% during this period.
The glycerol batch phase (phase I) takes approximately 30h to complete, after incubation. The beginning of phase II is signaled by the agitation rate, when it reaches the 440 rpm threshold value, which corresponds to a biomass of approximately 20 g/l. The duration of the glycerol fed-batch (phase II) was 12,5h. At the beginning of phase II, a small pulse of methanol (15g) was fed to the reactor to “promote” induction. This premature methanol feeding has the goal of facilitation the transition between glycerol and methanol phases.
The phase II used the following glycerol feeding formula
, . Equation 2.3
with feeding rate (g/h); , initial feeding rate, 30 g/h; desired sspecific growth rate, 0,16 h-1 for the initial 8,5h of this phase; and, for the last 4h, desired sspecific growth rate, 0,025 h-1.
The duration of phase III, i.e. the methanol fed-batch phase, was approximately 100h. The methanol feeding was established by several optimizations in MATLABTM (details are not shown here since this optimization is not within the scope of this thesis). The result was the following methanol feeding formula
42,6036 0,0871 0,0042 , Equation 2.4
Universidade Nova de Lisboa – Faculdade de Ciências e Tecnologia Analysis of glycosylation heterogeneity in antibody production by Pichia pastoris
All feeding streams (ammonium hydroxide for pH control, glycerol; and methanol) were weighted on-line using three weight scales with on-line data acquisition.
The UBICON, Universal Bio-Process Control System (Electronic System Design, Hanover, Germany), was used for data acquisition and process control, implementing all the control loops previously mentioned.
2.3. Biomass determination
The OD (optical density) of the broth was measured at 600nm and the samples were made in duplicate.
The wet cell weight (WCW) was determined by centrifugation of 13g of the fermentation broth at 15000 rpm for 10 minutes at 4ºC, and, also, the samples were made in duplicate.
2.4. ELISA-assay (for one plate)
The ELISA – Enzyme-Linked Immunosorbent Assay – is a technique for measuring the concentration of antibodies and antigens (Immunodectection Milipore®). The product concentration was obtained by this method.
There are several variations of ELISA that can be used for antibody assays:
- Direct ELISA: first the antigen is attached by passive adsorption to the well.
After washing, enzyme-labeled antibodies are added and incubated for a period of time. After washing, the substrate that will provide color is added. The color appears and the reaction is stopped.
- Indirect ELISA: first antibodies react with the antigen and are attached by
passive adsorption to the well. After washing, an anti-species antiserum labeled with enzyme are added and incubated for a period of time. After washing, the substrate that will provide color is added. The color appears and the reaction is stopped. This assay is widely used in diagnosis.
- Sandwich’s ELISA: this assay is also divided into Direct Sandwich ELISA
In this work the assay applied was Sandwich Direct ELISA. The wells are coated with a purified antibody that will attach only the target protein. Then, an antibody linked with labeled molecule (the horseradish peroxidase – HRP) will attach the target protein. After that a substrate is added that is oxidized by HRP and will produce a color that will be analyzed by a spectrophotometer.
This method was performed using 96-well microplates (VWR). Add 100µl of protein A (50ul of protein A with 1g/L in 10ml of PBS (10mM pH7,4, Calbiochem)) in each well, incubate overnight at 4ºC with moist environment or for one hour at 37ºC; wash three times with Tween-PBS (pH 7,4 ,Calbiochem) and dry; add 200µl of blocking solution (Tween-PBS with 5%(w/v) skim milk (Merck)) in each well and incubate for one hour at 37ºC with moist environment; wash three times with Tween-PBS and dry. In the next step standard (purified scFv) – positive control, PBS – negative control, and samples were applied after dilution with skim milk and duplicate – incubate for 1 hour at room temperature; wash three times with Tween-PBS. Incubate the plate with 100µl Anti-human IgG-HRP (Sigma) (20µl in 10ml of blocking solution) in each well and incubate for 30 minutes at 37ºC, wash three times with Tween-PBS. Add 100µl of coloring solution (OPD peroxidase, 1 tablet in 20ml of water,Sigma), protect form light during this process. The reaction was stopped with 50µl of Sulfuric acid (2,25N, Merck). The absorbance was measured at 450-490nm using a microplate reader (Izasa). The concentration was calculated by linear regression.
2.5. Purification
The purification of the antibody fragment was done by two-steps chromatography: first affinity chromatography with protein A as a capture step; then a size-exclusion chromatography as second step to separate the monomer and dimmer forms.
Universidade Nova de Lisboa – Faculdade de Ciências e Tecnologia Analysis of glycosylation heterogeneity in antibody production by Pichia pastoris
becomes week, the residues are charged and there is repulsion between protein A and the antibody (Bailon, et al., 2000).
The size-exclusion chromatography is a liquid chromatography that provides separation of macromolecules by molecular size. The column has a packing material of porous particles which form the stationary phase. The liquid mobile phase begins to pass through the column, the smaller macromolecules are able to penetrate into the pores of the stationary phase and the larger macromolecules can’t penetrate into the pores so they flow more rapidly. In the end, there are two distant chromatographic bands with two different molecular sizes (Wu, 2004).
Fermentation broth supernatant, collected by centrifugation at 13,000g for 15 min, after pH adjustment to 7.4 with 1 M NaOH, was loaded at a linear velocity of 300 cm h-1 onto a Streamline 50 column (50 mm diameter, Amersham Biosciences, Piscataway, NJ) filled with 300 mL of Protein A. The column was equilibrated with PBS, 10% glycerol at pH 7.4. The loaded column was then washed with the same buffer until a stable baseline was obtained and eluted with 0.1 M citrate, 10% glycerol at pH 3.5 at 150 cm h-1 followed by immediate neutralization with 1 M Tris base. Eluate (10 mL) at a concentration of approximately 1.5 mg mL-1 was then loaded onto a gel filtration HiLoad Superdex 75 26/60 column (Amersham Biosciences) and equilibrated with PBS and 10% glycerol at pH 7.4. (Cunha, et al., 2004)
2.6. BCA Protein Assay Kit
This is a colorimetric detection assay for quantification of total protein after purification.
This method is based on reduction of Cu2+ to Cu+ by protein in an alkaline medium with a selective colorimetric detection of the cuprous cation (Cu+).
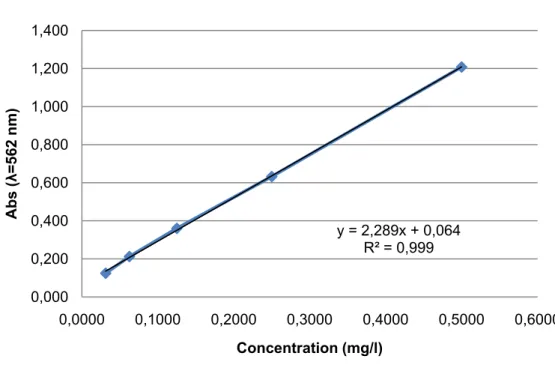
The protein identification is made by the transition of a colorless solution to an intense purple color with an absorbance maximum at 562nm. It was used a kit for this assay with the protein concentration range 20-2000µg/ml and with BSA (bovine serum albumin) as a reference protein.
The BSA was the reference protein and the dilution curve consisted of eight points in duplicate with the concentration between 0,1 – 2 mg/ml. The scFv was also made in duplicate and the concentration was calculated by linear regression.
2.7. MALDI
The MALDI technique is a mass spectrometer technique to identify, verify and quantify proteins isolated from natural sources or recombinant proteins, metabolites, oligonucleotides, drugs, peptides, polymers, and organic compounds. Because of the large amount of compounds, this technique is applied in many sectors, like pharmaceuticals analysis, environmental analysis and biomolecular characterization (Hillenkamp et al., 2007).
Very briefly, the MALDI spectyrometer works as follows. The samples are mixed with the matriz and dried on a plate and this plate is put inside of the spectrometer. Inside of the spectrometer, there are three main components: the ion source that will ionize the molecules of the sample; the mass analyzer, which separates the ions based in the ratio mass/charge (m/z), and that can be Time-of-flight (TOF), quadruple or an ion trap; and the detector, which registers the ions that arrive and measure the ratio (m/z). Finally a computer registers and processes the data providing the mass spectrum (AguardLab; Young).
The MALDI technique has several advantages over other mass spectrometry techniques, it can analyze intact biomolecules and synthetic polymers; it can analyze a large variety of compounds, with masses over 300kDa; it can be relatively tolerant to buffers and salts; it has high sensitivity and is fast (AguardLab).
Substitution of the glycerol and concentration of the sample
Universidade Nova de Lisboa – Faculdade de Ciências e Tecnologia Analysis of glycosylation heterogeneity in antibody production by Pichia pastoris
10 µl of the received protein solution were reduced, alkylated and digested in-solution by trypsin in the presence of 1M urea (final volume 80 µl). 10 µl tryptic and PGNase F digests were desalted, concentrated and eluted using a R2 micro-column (RP-C18 equivalent). Peptides were eluted directly onto a MALDI plate with α -ciano-4-hidroxycinamic acid (CHCA) (5 mg/ml) in 50% acetonitrile, 5% formic acid. Mass spectra of the peptide mixtures were acquired in the positive reflectron MS and MS/MS modes using a MALDI-TOF/TOF MS (4800plus MALDI TOF/TOF analyzer). The acquired MS and MS/MS spectra were analyzed in combined mode using Mascot search engine and NCBI database without taxonomic restrictions with a peptide mass tolerance of 50 ppm1.
2.8. Bioinformatic methods
These methods are all available in http://www.expasy.org/tools/ (Gasteiger, et al., 2005) with an HTML interface.
2.8.1. Peptide Cutter
This tool predicts cleavage sites caused by several proteases or chemicals for a given protein sequence.
The protein sequence has to be entered in the form of Swiss-Prot / TrEMBL accession number (UniProtKB); or a sequence in FASTA format (sequence of one-letter aminoacid code).
Once the protein sequence is coded, it is possible to select one or multiple enzymes or chemicals provided in the list.
It is possible to display the final map of cleavage sites in different ways: a table of sites ordered alphabetically by enzyme or chemical name; or a table of sites ordered alphabetically by aminoacid number. In the latter way, it is possible to choose the exact time of cut that the enzyme or chemical do or a range of cleavages (Gasteiger, et al., 2005).
1 Data provided/obtained by the Mass Spectrometry Laboratory, Analytical Services Unit, Instituto de Tecnologia
2.8.2. Peptide Mass
The Peptide Mass tool has the purpose to help in peptide-mapping experiments, and help with the interpretation of mass-spectrometry data.
The first step is entering the protein sequence. The protein sequence can be coded in the same forms accepted by the PeptideCutter.
Then it is possible to choose several modifications that can be performed to the protein; the adduct that was used in the experiment; and if the mass is displayed by average or monoisotopic.
Next it is possible to choose the enzyme used for protein cleavage, if there are missed cleavages and the range of the peptide mass to consider (Gasteiger, et al., 2005).
Protein sequence of AP39 was introduced, it was selected: the peptide masses are [M+H]+ and monoisotopic; the enzyme Trypsin; allow for 3 missed cleavages.
2.8.3. GlycoMod
The GlycoMod tool finds all possible composition of glycan structures from the experimentally determined mass.
The first step is entering the peaks list of experimental masses (either average or monoisotopic measured masses) and the mass tolerance in Dalton or ppm.
The second step is choosing the ion mode and the adducts that were used during the MALDI experiment.
Universidade Nova de Lisboa – Faculdade de Ciências e Tecnologia Analysis of glycosylation heterogeneity in antibody production by Pichia pastoris
The fourth input is the protein sequence with the cleavage enzyme and the possible modifications that the protein can have.
The last input is the monosaccharide residue (if known). It is possible to choose the monosaccharides that exist in each case, and if they are underivatised, permethylated or peracetylated (Gasteiger et al., 2005).
Experimental masses and protein sequence of AP39 were introduced. It was selected: the peptide masses – monoisotopic; the ion mode and adducts – [M+H]+; the enzyme Trypsin, allow for 3 missed cleavages; form of O-linked oligosaccharides – Glycopeptides (only those containing S or T will be used); monosaccharide residues are underivatised; and it was chosen Hexose Man (selected as yes) and all the others were eliminated (selected as no).
2.9. Glycosylation mathematical models
Figur
with
re 2.1 – Glyc
The mat , , , , , , The mat osylation mo terial balanc , , , . A terial balanc
odel in P pas ces of each
, ,
‐1 ‐1 ‐1 ‐1 0 0
1 ‐1 0 0 1 ‐1
0 0 1
0 0 0
0 0 0
ces can be t
storis: analog
compound
, A =
1 ‐1 ‐1
0 0 0
0 0 0
1 0 0
1 ‐1 0
0 1 ‐1
0 0 1
transformed
gy with a Plug
in the PFR
Equation
a stoichiome
d into a dim
Equation
Equation
Equation Equation
g Flow Reac
R are n 2.5 etric matrix Equation 2.6 mensionless n 2.7 n 2.8 n 2.9 n 2.10
ctor (PFR) sy
(see below
6
form as fol
ystem
w) and
Universidade Nova de Lisboa – Faculdade de Ciências e Tecnologia Analysis of glycosylation heterogeneity in antibody production by Pichia pastoris
In the equations below superscript * is omitted for simplicity. All the results shown in this thesis used the dimensionless from of material balances
Applying Equation. 2.6 to the ER results:
1 1
1 0
1 1
0 1
Equation 2.11
Applying Equation. 2.6 to the Golgi results:
Equation 2.12
The model above assumes that the glycosylation of O-linked glycans is a deterministic reaction process, i. e. there is no randomness involved. However for very low mannose concentrations it is likely that the reaction of a mannose molecule with several alternative molecules of P, PM1, PM2, PM3, PM4 and PM5 is a random event
and thus a stochastic model formulation is required. This requirement is further reinforced by the strong possibility of mannose being the limiting factor for glycosylation.
The Tau leaping method (Gillespie, 2005) was adopted for stochastic
simulation. According to this method, the number of times that a reaction j occurs in a time interval , is given by the Poisson distribution,
, ,
,
concentration. In stochastic simulation the total number of molecules is determinant for the probability of a reaction to occur. Thus rj is here multiplied by the total number of
mannose molecules, NMAN,0, in order to calculate the number of mannose molecules
that react per unit residence time.
Once the number of times reactions occur is evaluated for j=1,…,5, using a Poisson random number generator according to Equation. 2.13 and Equation 2.14 (the
poissrnd MATLAB function was adopted), then the concentrations of compounds at
time are evaluated as
. Equation 2.15
with
, , , , , , , , , Equation 2.16
Both mathematical models have the same initial conditions: concentrations at the entrance of the PFR ( ⁄ 1, ⁄ varied, ⁄ ⁄
⁄ ⁄ ⁄ 0). For the stochastic model, it is necessary to define the total number of mannose molecules at the entrance of the PFR, NMAN,0,
which was varied to assess the effect of total number of molecules in the glycosylation dynamics (MATLAB code in Annex H)
2.10. Glycoprotein Detection Kit
The glycoprotein detection kit is a simple and easy system to detect glycoproteins on a SDS-PAGE or a Western blotting membrane. This kit is based on the modification of Periodic Acid-Schiff (PAS) method. First there is a reaction involving the oxidation of carbohydrates by Periodic acid, which oxidizes 1,2-glycol groups to aldehydes; and the second step is the staining with Schiff’s reagent, the aldehydes react with this reagent to form a magenta or pink colored band (Moller et al., 1996; Yan
et al., 2008; Deepak et al., 2003 ). In order to this method to be reliable it is necessary
several micrograms of proteins for the detection (Moller, et al., 1996).
Universidade Nova de Lisboa – Faculdade de Ciências e Tecnologia Analysis of glycosylation heterogeneity in antibody production by Pichia pastoris
buffer (was used 2x concentrate – 0,08M Tris-HCl, ph 6,8 (Merck); 2% (w/v) SDS (Merck); 0,1M DDT (Calbiochem); 10% (v/v) glycerol (Vaz Pereira); 0,001% Bromophenol blue (Sigma)) where the respective protein was dissolved and was denaturated at 100ºC for 3 min. The running buffer was MES 20x (Invitrogen). The gel was loaded and run at 200V (constant) for approximately 45min.
Next it was applied the glycoprotein detection kit according to the manufacturer’s instructions as follows: first immerge the gel in the fixing solution (50% (v/v) methanol) gently agitate for one hour; wash with pure water, gently agitate for twenty minutes, repeat the process; immerge the gel in Oxidation solution (this solution was provided by the kit) gently agitate for one hour; repeat the process of washing; immerge the gel in Staining solution (provided by the kit), gently agitate for 1-2 hours or until bands turn to magenta; replace this solution for the Reduction solution, gently agitate for two hours; wash with pure water, repeat two or three times.
After these steps, the glycoprotein was completely colored and the gel was scanned. The gel was colored with 20 ml of SimpleBlueTM (Invitrogen) for 1 hour at room temperature, for identifying other proteins in the gel. The gel was scanned one more time after this staining.
Figure 3.1 – Fermentation variables over time. It should be noticed that the temperature and the airflow rate are overlapped.
Figure 3.2 – Carbon sources feeding, glycerol and methanol; pO2 and agitation over fermentation time. 0 200 400 600 800 1000 1200 0,0 20,0 40,0 60,0 80,0 100,0 120,0 140,0
0,00 50,00 100,00 150,00
Pressure (mbar); Agitation (rpm) T e mp. (ºC); Air flow (l/min); pO2 (%) Age (h)
Temp (ºC) Air (l/min) pO2 (%) Agitation (rpm) Pressure (mbar)
0 200 400 600 800 1000 1200 0,0 20,0 40,0 60,0 80,0 100,0 120,0 140,0 160,0 180,0 200,0
0,00 50,00 100,00 150,00
Agitation (rpm) pO2 (%) : Q gly (g/h) ; Q Met (g/h) Age (h)
Universidade Nova de Lisboa – Faculdade de Ciências e Tecnologia Analysis of glycosylation heterogeneity in antibody production by Pichia pastoris
Figure 3.3 – Feeding rates of carbon sources, glycerol and methanol; ph and product concentration over time.
Figure 3.4 - Results of the biomass determination with OD (595nm) and wet weight and product concentration with ELISA assay (Annex B), over fermentation time.
-50 0 50 100 150 200 250 0 1 2 3 4 5 6 7 8 9 10
0,00 50,00 100,00 150,00
Methanol flow (g/h); Gly c erol flow (g/h) Product (mg/l); pH Age (h)
Product (mg/L) pH
0,00 50,00 100,00 150,00 200,00 250,00 300,00 350,00 400,00 450,00 0 1 2 3 4 5 6 7 8 9 10
0,00 50,00 100,00 150,00
We t We ig h t (g /L ); OD595nm Product (mg/l) Age (h)
Figure 3.5 – Calibration curve for BCA Protein Assay Kit with BSA as standard protein (data in Annex A).
Table 3.1 – Concentrations of the product after purification and after using the Amicon Ultra-4Centrifugal Filter with their dilution factor.
Product after purification Product after concentration and substitution of glycerol Dilution
factor
Absorvance average
Concentration (mg/ml)
Absorvance average
Concentration (mg/ml)
2 2,4100 1,9912 2,3760 1,9615
4 1,5820 2,5354 1,9370 3,1558
8 0,9445 2,8428 1,1480 3,5540
16 0,5630 3,0189 0,6990 3,9695
32 0,3545 3,1230 0,4460 4,4022
64 0,2325 2,8350 0,2810 4,1910
128 0,1500 1,0567 0,1770 2,5665
256 0,1155 -1,7451 0,1280 -0,3471
y = 2,289x + 0,064 R² = 0,999
0,000 0,200 0,400 0,600 0,800 1,000 1,200
0,0000 0,1000 0,2000 0,3000 0,4000 0,5000 0,6000
Abs (
λ
=562 nm)
Universidade Nova de Lisboa – Faculdade de Ciências e Tecnologia Analysis of glycosylation heterogeneity in antibody production by Pichia pastoris
3.3. MALDI analysis
Figure 3.6 – MALDI spectrum of intact protein2. Zoom in of the major peaks in Annex C.
2
Data provided/obtained by the Mass Spectrometry Laboratory, Analytical Services Unit, Instituto de Tecnologia Química e Biológica, Universidade Nova de Lisboa.
9952.0 25080.4 40208.8 55337.2 70465.6 85594.0 8681.1
0 10 20 30 40 50 60 70 80 90
100 25736.1543
25497.8021
51186.0859
12914.7451
13426.4697
78118.1250 55351.6563
68291.5781 39194.4688
17125.8711 43189.9063
12380.4082
32752.7773 23657.4121
18171.6113
Mass (m/z)
%
Intensity
Figure 3.7 – MALDI spectrum of the protein digested by trypsin3. List of the peaks of this spectrum in Annex D, Table 7.5.
3
Data provided/obtained by the Mass Spectrometry Laboratory, Analytical Services Unit, Instituto de Tecnologia Química e Biológica, Universidade Nova de Lisboa”.
781.00 1427.2 2073.4 2719.6 3365.8 4012 10 20 30 40 50 60 70 80 90 2423. 1 59 7 2127 .9 21 4 1632 .7 731 10 85 .6 06 8 13 5 2. 6 96 3 2 4 80 .1 77 5 1 8 95 .9832 2032 .8 616 2184 .9 336 11 42 .6 22 6 1938. 9 92 3 2018 .8 613 2537. 1 85 3 2294 .0 269 16 89 .7 93 7 2 0 79 .8960 13 68 .6 89 7 1877 .9 757 2 3 52 .0 82 3 21 70 .9 31 4 26 0 9. 1 82 1 3 5 90 .5310 % Intensity
Universidade Nova de Lisboa – Faculdade de Ciências e Tecnologia Analysis of glycosylation heterogeneity in antibody production by Pichia pastoris
Figure 3.8 – MALDI spectrum of the protein cleaved by trypsin and PNGase F4. List of the peaks of this spectrum in Annex D, Table 7.6Table 7.5.
4
Data provided/obtained by the Mass Spectrometry Laboratory, Analytical Services Unit, Instituto de Tecnologia Química e Biológica, Universidade Nova de Lisboa”.
773.00 1420.8 2068.6 2716.4 3364.2 4012 10 20 30 40 50 60 70 80 90 100 19 7 5 .914 4 2466 .2502 2423 .24 1 2 1939 .0571 20 1 8 .92 0 0 1128 .6378 2480 .2612 18 96. 0 45 7 25 2 3 .2649 1632 .81 7 0 16 7 5 .8236 1352 .73 0 6 21 2 7 .9 89 7 10 8 5 .6312 11 42. 6 53 9 20 7 9 .9775 1953 .0664 18 7 8 .0 38 3 2185 .0059 1507 .6932 11 8 5 .6 61 7 13 9 5 .7 43 2 20 0 1 .90 5 5 25 80. 3 05 9 24 4 9 .2512 2337 .1438 2294 .0942 1305 .7228 1550 .70 9 1 2493 .24 7 3 1706 .95 8 9 975. 5 17 8 23 9 5 .2 06 8 14 5 2 .7 62 9 12 4 1 .1 47 2 13 4 7 .7 31 2 18 1 7 .9 14 1 93 2 .5 1 59 26 6 4 .27 3 7 22 2 8 .04 7 6 17 4 9 .96 5 0 16 5 8 .76 5 1 35 8 9 .74 9 0 % Intensity
Figure 3.9 – Aminoacid sequence of AP039.
3.4. Bioinformatic methods
Table 3.2 - List of the peptide sequence and their masses (from PeptideCutter and PeptideMass).
Mass
(m/z) Position Peptide sequence
6177,8821 88-148 AEDTAVYYCAKPFPYFDYWGQGTLVTVSSGDGSSGGSGGA STGEIVLTQSPGTLSLSPGER
2423,2102 155-176 ASQSVSSSFLAWYQQKPGQAPR 2294,0823 44-65 GLEWVSSISGSSGTTYYADSVK 2070,9412 20-38 LSCAASGFTFSSFSMSWVR 1918.8640 209-224 LEPEDFAVYYCQQTGR 1896,0185 1-19 EVQLLESGGGLVQPGGSLR 1632,7864 193-208 FSGSGSGTDFTLTISR 1352,6991 77-87 NTLYLQMNSLR 1085,5989 177-185 LLIYYASSR 1045.5676 225-234 IPPTFGQGTK 729,3889 186-192 ATGIPDR 650,3290 149-154 ATLSCR 623,3511 68-72 FTISR 500,2827 39-43 QAPGK 462,2074 73-76 DNSK
70 80 90 100 110 120
ADSVKGRFTI SRDNSKNTLY LQMNSLRAED TAVYYCAKPF PYFDYWGQGT LVTVSSGDGS
130 140 150 160 170 180
SGGSGGASTG EIVLTQSPGT LSLSPGERAT LSCRASQSVS SSFLAWYQQK PGQAPRLLIY
190 200 210 220 230 240
Universidade Nova de Lisboa – Faculdade de Ciências e Tecnologia Analysis of glycosylation heterogeneity in antibody production by Pichia pastoris
Table 3.3 – Determination of possible glycoforms by GlycoMod.
Position Sequence Experimental
mass (m/z)
Glycoform mass (m/z)
∆mass (Dalton)
Peptide
mass Structure
77-87 NTLYLQMNSLR 2001,9053 648,211 0,995 1351,692 (Man)4 177-185 LLIYYASSR 1409,7137 324,106 0,009 1084,592 (Man)2 177-186 LLIYYASSR 1895,9832 810,264 0,121 1084,592 (Man)5 209-224 LEPEDFAVYYCQQTGR 2079,9773 162,053 -0,939 1917,857 (Man)1 209-225 LEPEDFAVYYCQQTGR 2566,283 648,211 -0,791 1917,857 (Man)4 225-235 IPPTFGQGTK 1368,6901 324,106 -0,983 1044,56 (Man)2
68-76 FTISRDNSK (1 missed
cleavage) 1877,9755 810,264 0,164 1877,812 (Man)5 66-76 GRFTISRDNSK (2 missed
cleavage) 2089,9597 810,264 -0,974 1279,663 (Man)5 66-76 GRFTISRDNSK (2 missed
cleavage) 1927,9136 648,211 -0,967 1279,663 (Man)4 225-238 IPPTFGQGTKVEIK (1
missed cleavage) 2001,9053 486,158 0,89 1513,85 (Man)3 225-243 IPPTFGQGTKVEIKGGGCA
(2 missed cleavage) 2184,9336 324,106 0,859 1858,961 (Man)2
3.5. Glycosylation mathematical models
P0
CM⁄CM0 0 0
CP⁄CM0 0 0
CPM1⁄CM0 0 0
CPM2⁄CM0 0,13 42,65
CPM3⁄CM0 0,045 14,94
CPM4⁄CM0 0,026 8,83
CPM5⁄CM0 0,10 33,58
Universidade Nova de Lisboa – Faculdade de Ciências e Tecnologia Analysis of glycosylation heterogeneity in antibody production by Pichia pastoris
Figure 3.12 – Zoom in the graphic of Golgi of Figure 3.11.
Table 3.5 - Composition out of the Golgi in a deterministic model with a ratio of CP⁄CM0of 0,8 ; and 100 mannose molecules at the entrance of PFR.
Outlow Percentage of CP0
CM⁄CM0 0 0,000012
CP⁄CM0 0,30 37,83
CPM1⁄CM0 0,012 1,44
CPM2⁄CM0 0,47 59,22
CPM3⁄CM0 0,0084 1,05
CPM4⁄CM0 0,0025 0,32
Figure 3.13 - Deterministic model results with a ratio of CP⁄CM0 of 2; and 100 mannose molecules at the entrance of PFR.
Universidade Nova de Lisboa – Faculdade de Ciências e Tecnologia Analysis of glycosylation heterogeneity in antibody production by Pichia pastoris
Table 3.6 – Composition out of the Golgi in a deterministic model with a ratio of CP⁄CM0 of 2 and 100 mannose molecules at the entrance of PFR.
Outlow Percentage of CP0 CM⁄CM0 0 0
CP⁄CM0 1,50 75,05
CPM1⁄CM0 0,013 0,63
CPM2⁄CM0 0,48 23,79
CPM3⁄CM0 0,0076 0,38
CPM4⁄CM0 0,0022 0,11
CPM5⁄CM0 0,00083 0,043
Figure 3.16 – Histograms of the stochastic model results with a ratio of CP⁄CM0 of 0,3 and 100 mannose molecules at the entrance of PFR.
Table 3.7 – Composition out of the Golgi in a stochastic model with a ratio of CP⁄CM0 of 0,3 and 100 mannose molecules at the entrance of PFR.
Mean Standard deviation Percentage of CP0
CM⁄CM0 0 0 0
CP⁄CM0 0 0 0
CPM1⁄CM0 0 0 0
CPM2⁄CM0 0,14 0,042 45,20
CPM3⁄CM0 0,078 0,043 25,90
CPM4⁄CM0 0,043 0,025 14,17
Universidade Nova de Lisboa – Faculdade de Ciências e Tecnologia Analysis of glycosylation heterogeneity in antibody production by Pichia pastoris
Figure 3.17 – Stochastic model results with a ratio of CP⁄CM0 of 0,8 and 100 mannose molecules at the entrance of PFR.