The Open Bioinformatics Journal, 2018, 11, 61-88 61
1875-0362/18 2018 Bentham Open
The Open Bioinformatics Journal
Content list available at: www.benthamopen.com/TOBIOIJ/DOI: 10.2174/1875036201811010061 RESEARCH ARTICLE
Android Library for Recognition of Activities of Daily Living:
Implementation Considerations, Challenges, and Solutions
Ivan Miguel Pires
1,2,3,*, Maria Canavarro Teixeira
4,5, Nuno Pombo
1, Nuno M. Garcia
1, Francisco
Flórez-Revuelta
6, Susanna Spinsante
7, Rossitza Goleva
8and Eftim Zdravevski
9 1Instituto de Telecomunicações, Universidade da Beira Interior, Covilhã, Portugal2Altran portugal, Lisbon, Portugal 3
ALLab - Assisted Living Computing and Telecommunications Laboratory, Computing Science Department, Universidade da Beira Interior, Covilhã, Portugal
4
UTC de Recursos Naturais e Desenvolvimento Sustentável, Polytechnique Institute of Castelo Branco, Castelo Branco, Portugal
5
CERNAS - Research Centre for Natural Resources, Environment and Society, Polytechnique Institute of Castelo Branco, Castelo Branco, Portugal
6Department of Computer Technology, Universidad de Alicante, Alicante, Spain 7Department of Information Engineering, Marche Polytechnic University, Ancona, Italy 8Department of Informatics, New Bulgarian University, Sofia, Bulgaria
9Faculty of Computer Science and Engineering, University Ss Cyril and Methodius, Skopje, Macedonia
Received: February 6, 2018 Revised: April 12, 2018 Accepted: April 30, 2018
Abstract:
Background:
Off-the-shelf-mobile devices have several sensors available onboard that may be used for the recognition of Activities of Daily Living (ADL) and the environments where they are performed. This research is focused on the development of Ambient Assisted Living (AAL) systems, using mobile devices for the acquisition of the different types of data related to the physical and physiological conditions of the subjects and the environments. Mobile devices with the Android Operating Systems are the least expensive and exhibit the biggest market while providing a variety of models and onboard sensors.
Objective:
This paper describes the implementation considerations, challenges and solutions about a framework for the recognition of ADL and the environments, provided as an Android library. The framework is a function of the number of sensors available in different mobile devices and utilizes a variety of activity recognition algorithms to provide a rapid feedback to the user.
Methods:
The Android library includes data fusion, data processing, features engineering and classification methods. The sensors that may be used are the accelerometer, the gyroscope, the magnetometer, the Global Positioning System (GPS) receiver and the microphone. The data processing includes the application of data cleaning methods and the extraction of features, which are used with Deep Neural Networks (DNN) for the classification of ADL and environment. Throughout this work, the limitations of the mobile devices were explored and their effects have been minimized.
* Address correspondence to this author at the Computer Science Department, Universidade da Beira Interior, Rua Marquês d’Ávila e Bolama, 6201-001 Covilhã, Portugal; Tel: +351 966379785; E-mail: [email protected]
Results:
The implementation of the Android library reported an overall accuracy between 58.02% and 89.15%, depending on the number of sensors used and the number of ADL and environments recognized. Compared with the results available in the literature, the performance of the library reported a mean improvement of 2.93%, and they do not differ at the maximum found in prior work, that based on the Student’s t-test.
Conclusion:
This study proves that ADL like walking, going upstairs and downstairs, running, watching TV, driving, sleeping and standing activities, and the bedroom, cooking/kitchen, gym, classroom, hall, living room, bar, library and street environments may be recognized with the sensors available in off-the-shelf mobile devices. Finally, these results may act as a preliminary research for the development of a personal digital life coach with a multi-sensor mobile device commonly used daily.
Keywords: Activities of daily living, Sensors, Mobile devices, Pattern recognition, Data fusion, Android library, Artificial neural
networks, Recognition.
1. INTRODUCTION 1.1. Background
Mobile devices like smartphones commonly used in daily life can be classified as multi-sensor devices [1], because they host several sensors, e.g., accelerometer, gyroscope, magnetometer, microphone, Global Positioning System (GPS) receiver and camera, that allow the acquisition of different types of data, including some of the physical and physiological data pertaining to the user, thus allowing for the recognition of the Activities of Daily Living (ADL) [2, 3].
The development of Ambient Assisted Living (AAL) systems has many challenges [4 - 8], such as timely and accurate recognition of ADL [9, 10], designing architectures that are applicable for Enhanced Living Environments [11, 12], providing reliable systems and integration with other systems [13]. ADL recognition is also important to design a personal digital life coach [14]. The development of these systems is specially important to support the autonomy of older users, patients with chronic diseases and users that may have some type of disability [15, 16]. However, these systems may be useful for everyone, including athletes and young users, as the proposed framework can be integrated into a tool for the monitoring and training of lifestyles [14].
1.2. Motivation
The recognition of ADL and the environment where the subject is at a given moment is widely important for the creation of systems aimed at several purposes, such as the personal coaching, the health monitoring, the lifestyle monitoring and others. Nowadays, such recognition is commonly performed by complex and expensive systems with high power processing and memory capabilities [4 - 6, 11 - 13], but it could be performed with commonly used equipment based on local processing techniques, in order to provide a feedback related to the ADL performed and environment frequented in almost real-time.
Our motivation is to solve this problem with the development of an Android library that performs the recognition of ADL and the associated environments, using only the data acquired from the sensors available onboard off-the-shelf mobile devices (i.e., smartphones), and local processing. We selected the Android platform for the development of the library, because this is the most used open platform available in the market [17], and the architecture of an Android library for the recognition of ADL and environments has been already proposed in [18 - 20].
The use of the off-the-shelf mobile devices for this purpose requires the development of lightweight processing techniques. In fact, despite recent developments and improvements, these devices usually have several limitations, including reduced processing capabilities, low capacity batteries and small internal storage space.
However, based on previous studies [21 - 25], we confirm that the use of the sensors available in off-the-shelf mobile devices may fuel the development of ADL recognition systems, having the potential to improve the quality of life of its users. With this study, we present a real-time mobile application that reliably identifies ADLs, the environment and location, providing feedback to the user. The recognition of the ADL featuring the subject’s movement is based on the data acquired from the motion and/or magnetic sensors (i.e., accelerometer, gyroscope and magnetometer), but the recognition of the environment is based on acoustic data acquired from the microphone. In order
to support the better recognition of an ADL when the user is standing still, the fusion of the features extracted from the data acquired from motion and magnetic sensors with the environment previously recognized and the features extracted from the data acquired from the GPS receiver is performed.
1.3. Prior Work
To date, and based on the literature, there are several studies using different subsets of sensors available on smartphones. Yet, studies reporting methods that rely on a larger set of sensors available in off-the-shelf mobile devices for the recognition of ADL and their environments were not found. For the purpose of comparison with this research, we analyzed 36 studies available in the literature that use Artificial Neural Networks (ANN) for the recognition of ADL and environments. The implementation of ANN with mobile devices is widely studied and several frameworks have been developed. In this case, other types of methods have been already used in the literature, including the neural networks and the ensemble learning methods [26], but the ensemble learning methods often include a combination of methods (thus requiring higher computational resources) and can be used with larger datasets than the neural networks methods, which will be the case for the datasets available in the storage of mobile devices [27].
The use of the ANN, with variants, to recognize different types of ADL involving the subject’s movements, is quite well documented in the literature. Several works, as the following discussion shows, addressed this method, providing different accuracy performance on different datasets. There are several studies using only the accelerometer sensor, where the authors of [28] recognized the walking and standing activities using Multilayer Perceptron (MLP) with a reported accuracy around 95%. Bayat et al. [29] implemented the MLP method using features extracted from the accelerometer data for the recognition of running, walking, dancing, going upstairs and going downstairs, reporting an accuracy of 89.72%. In [30], the authors used the accelerometer data and implemented the MLP method for the recognition of going upstairs, going up on an escalator and walking, reporting an average accuracy of 94%. The study of [31] implemented the MLP method for the recognition of several activities, such as walking, jogging, going upstairs, going downstairs, sitting, standing and lying, reporting a maximum accuracy of 94.44%. The standing, walking and running activities reported a minimum accuracy of 89% using the MLP method [32]. The authors of [33] implemented the MLP method for the comparison of the results obtained with the Sliding-Window-based Hidden Markov Model (SW-HMM), reporting an accuracy always higher than 80% in the recognition of walking, standing, running, going downstairs and going upstairs. MLP method was implemented by the authors of [34] for the recognition of standing, sitting, walking, lying and falling activities, reporting an accuracy higher than 90%. Using the same method, in [35], the authors reported that the recognition of the standing, walking, jogging, jumping, going upstairs, going downstairs and sitting activities has an accuracy higher than 90%. In [36], the walking and standing activities reported a recognition accuracy between 75% and 98% using the MLP method. The MLP method was used by the authors of [37] for the recognition of standing, walking, going upstairs, going downstairs and running activities, reporting an accuracy of 92%. Cycling, standing, walking, jogging, driving and running are other activities recognized by the authors of [38] with the MLP method, reporting an accuracy between 57.53% and 97.58%. In [39], the MLP method was used for the recognition of walking, going upstairs, going downstairs, standing, sitting and jogging activities, reporting an accuracy around 97%. In order to identify the activities performed during a football game, the authors of [40] used the MLP method with a reported accuracy higher than 95%. In [41], the walking, going upstairs, jogging, going downstairs, standing and sitting activities were recognized with the MLP method, which reported an accuracy of 97.7%. The study [42] presented the implementation of the MLP method for the recognition of walking, jogging, going upstairs, going downstairs, sitting and standing activities, reported an average accuracy of 82.3%. In [43], the MLP method was used for the recognition of cycling, running, sitting, standing and walking with a minimum reported accuracy of 61%. In addition to the use of the MLP method with the accelerometer data as input, other methods are growing, such as DNN and Probabilistic Neural Networks (PNN) methods. DNN method was used by the authors of [44] for the recognition of walking, running, standing, sitting, lying, going upstairs and going downstairs activities with a reported accuracy between 77% and 99%. PNN method was used by the authors of [45] for the recognition of walking, jogging, cycling, going upstairs and going downstairs activities, reporting results with an average accuracy of 98%.
Following the studies that fuse the data acquired from the accelerometer and the gyroscope sensors, the authors of [46] used the MLP method for the recognition of standing, walking, running, sitting, lying, cycling, driving, cleaning, cooking, taking medication, sweeping, washing hands and watering plants activities, reporting an average accuracy of 65.44%. The MLP method was used in [47] for the recognition of walking, jumping, running, going downstairs and going upstairs, reporting an average accuracy of 84.53%. For the recognition of falling activities, the authors of [48] implemented the MLP method and reported an accuracy of 85.87%. The walking, jogging, sitting, going upstairs and
going downstairs were recognized with the use of the MLP method, reporting an average accuracy of 71.25% [49]. In [50], the authors implemented the MLP method for the recognition of movements related to getting up and down from buses, reporting an average accuracy of 86%.
A system that uses Support Vector Machines (SVMs) with tuned parameters and features based on histograms extracted from multiple accelerometers and gyroscopes is proposed in [51]. This is a valid approach because such features are easy to compute. A balanced accuracy over 85% is reported.
An approach based on automatic feature engineering is used in [9] for the recognition of a variety of ADLs, using sensors placed on multiple locations. Depending on the dataset, an accuracy from 90 to 99% is reported. Interestingly, the best accuracy achieved with SVMs, Random Forest and Extra Trees is comparable to the accuracy of much more lightweight approaches like logistic regression and Naïve Bayes. A similar approach was proven to work for jogging detection in [52], even on field conditions when the subject wears accelerometers all the time.
In [53], the accelerometer and gravity sensors’ data were fused and the MLP method used for the recognition of walking, going upstairs, going downstairs, standing and laying activities, reporting an accuracy higher than 90%.
Combining the data acquired from the accelerometer and the GPS receiver, the MLP method handles the recognition of standing, walking, and travelling by car and train, reporting a minimum accuracy of 70% [54].
In [55], the data acquired from the accelerometer, the magnetometer, the gyroscope and the GPS receiver were fused and the MLP method was applied for the recognition of running, walking, sitting, going upstairs, going downstairs and sitting activities, reporting a recognition accuracy higher than 70%.
The acoustic data may be exploited for the recognition of the different environments using ANN. Authors of [56] implemented the MLP method for the recognition of sounds of emergency vehicles, reporting an accuracy around 96.70%. In [57], several sounds have been recognized with the MLP method, such as boll impact, metal impact, wood impact, plastic impact, open/close door, typing, knocking, telephone ringing, grains falling, spray and whistle, reporting an average accuracy in environment recognition of 92.41%. The sounds of sneezing, dog barking, clock ticking, baby crying, crowing rooster, raining, sea waves, fire crackling, helicopter and chainsaw were recognized in [58] using the MLP method and reporting an accuracy around 94.5%. The authors of [59] recognized several sounds, including alarms, birds, clapping, dogs, motorcycles, raining, sea waves and wind, based on the application of the MLP method, and reported an accuracy around 54%. Other ANN methods have been used, such as Feedforward neural networks (FNN), Recurrent Neural Networks (RNN) and DNN methods. The FNN were implemented by the authors of [60] for the recognition of emergency vehicles, car horns, and normal street sounds, reporting an accuracy between 80% and 100%. The authors of [61] implemented DNN and RNN methods for the recognition of the sounds related to baby crying and smoking alarm, reporting an accuracy around 90%. The DNN methods was also used for the recognition of different sounds, including laughing, singing, crying, arguing, sighing, voice and music, reporting accuracies around 80% [62, 63].
The acoustic data may also be used to help in the recognition of some ADL; the authors of [64] recognized the falling events with the MLP method, reporting an accuracy around 93%.
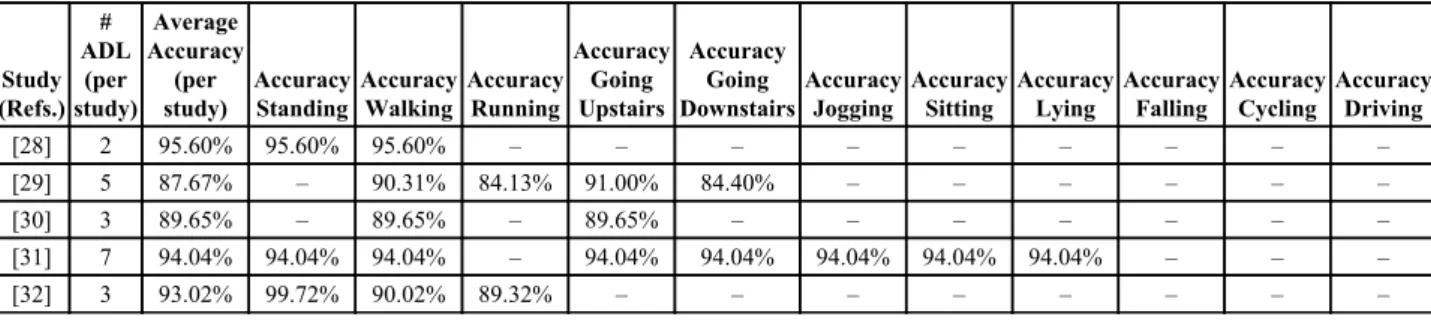
A summary of the literature overview discussed above is provided in Tables 1 to 5, where details regarding the number of ADLs analyzed by each study, and the accuracy obtained on average and on the single type of ADL considered are presented. However, the accuracy values reported by the studies analyzed are not directly comparable as they were obtained from different datasets.
Table 1. Summary of the literature studies related to ADL recognition based on the ANN method. The number of ADL analyzed, the average accuracy and the accuracy-related to each ADL are reported.
Study (Refs.) # ADL (per study) Average Accuracy (per study) Accuracy Standing Accuracy Walking Accuracy Running Accuracy Going Upstairs Accuracy Going Downstairs Accuracy Jogging Accuracy Sitting Accuracy Lying Accuracy Falling Accuracy Cycling Accuracy Driving [28] 2 95.60% 95.60% 95.60% – – – – – – – – – [29] 5 87.67% – 90.31% 84.13% 91.00% 84.40% – – – – – – [30] 3 89.65% – 89.65% – 89.65% – – – – – – – [31] 7 94.04% 94.04% 94.04% – 94.04% 94.04% 94.04% 94.04% 94.04% – – – [32] 3 93.02% 99.72% 90.02% 89.32% – – – – – – – –
Study (Refs.) # ADL (per study) Average Accuracy (per study) Accuracy Standing Accuracy Walking Accuracy Running Accuracy Going Upstairs Accuracy Going Downstairs Accuracy Jogging Accuracy Sitting Accuracy Lying Accuracy Falling Accuracy Cycling Accuracy Driving [33] 5 87.80% 99.00% 82.00% 97.00% 84.00% 77.00% – – – – – – [34] 5 97.33% 100.00% 100.00% – – – – 90.00% 100% 96.67% – – [35] 6 96.80% 99.40% 99.80% – 92.50% 91.50% 99.60% 98.00% – – – – [36] 2 98.00% 98.00% 98.00% – – – – – – – – – [37] 5 93.42% 100.00% 93.60% 100.00% 85.20% 88.30% – – – – – – [38] 6 74.54% 91.29% 86.81% 70.59% – – 26.04% – – – 91.49% 80.99% [39] 6 88.38% 97.70% 96.60% – 73.80% 67.10% 97.60% 97.50% – – – – [44] 7 98.60% 98.60% 98.60% 98.60% 98.60% 98.60% – 98.60% 98.60% – – – [41] 6 80.44% 91.93% 91.68% – 61.47% 44.21% 98.33% 95.04% – – – – [42] 6 82.30% 82.30% 82.30% – 82.30% 82.30% 82.30% 82.30% – – – – [46] 13 65.44% 96.64% 86.95% 92.09% – – – 87.30% 92.35% – 66.54% 86.62% [47] 5 84.53% – 84.53% 84.53% 84.53% 84.53% – – – – – – [48] 1 85.87% – – – – – – – – 85.87% – – [53] 5 76.30% 76.30% 76.30% – 76.30% 76.30% – – 76.30% – – – [49] 5 71.25% – 86.80% – 38.35% 39.60% 91.50% 100% – – – – [43] 5 72.52% 86.40% 61.00% 68.70% – – – 83.80% – – 62.70% – [54] 4 84.38% 83.60% 70.60% – – – – – – – – – [55] 6 85.50% 99.00% 91.00% 80.00% 70.00% 74.00% – 99.00% – – – – [45] 5 89.89% – 100.00% – 88.46% 61.00% 100.00% – – – 100.00% – [64] 1 93.08% – – – – – – – – 93.08% – – [50] 7 86.00% 99.40% 89.50% 98.40% 70.10% 70.90% – – – – – –
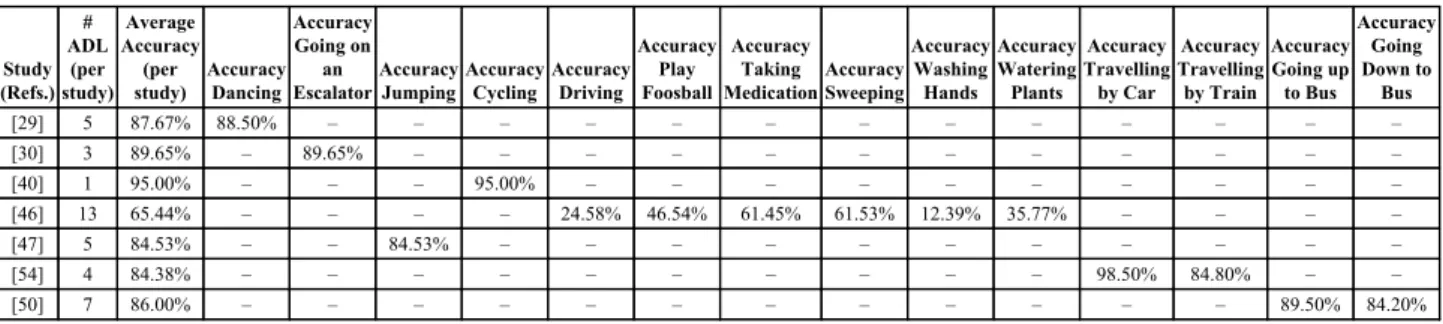
Table 2. Summary of the literature studies related to ADL recognition based on the ANN method. The number of ADL analyzed, the average accuracy and the accuracy-related to each ADL are reported. (cont.).
Study (Refs.) # ADL (per study) Average Accuracy (per
study) AccuracyDancing Accuracy Going on
an
EscalatorAccuracyJumpingAccuracyCycling AccuracyDriving Accuracy
Play Foosball
Accuracy Taking
MedicationAccuracySweeping Accuracy Washing Hands Accuracy Watering Plants Accuracy Travelling by Car Accuracy Travelling by Train Accuracy Going up to Bus Accuracy Going Down to Bus [29] 5 87.67% 88.50% – – – – – – – – – – – – – [30] 3 89.65% – 89.65% – – – – – – – – – – – – [40] 1 95.00% – – – 95.00% – – – – – – – – – – [46] 13 65.44% – – – – 24.58% 46.54% 61.45% 61.53% 12.39% 35.77% – – – – [47] 5 84.53% – – 84.53% – – – – – – – – – – – [54] 4 84.38% – – – – – – – – – – 98.50% 84.80% – – [50] 7 86.00% – – – – – – – – – – – – 89.50% 84.20%
Table 3. Summary of the literature studies related to environment recognition based on the ANN method. The number of environments analyzed, the average accuracy and the accuracy-related to each environment are reported.
Study (Refs.) # Environments (per study) Average Accuracy (per study) Accuracy Emergency Vehicles Accuracy Sneezing Accuracy Dogs Accuracy Clock Ticking Accuracy Baby Crying Accuracy Crowing Rooster Accuracy Raining Accuracy Sea Waves Accuracy Fire Crackling Accuracy Helicopter Accuracy Chainsaw Accuracy Street [56] 1 96.70% 96.70% – – – – – – – – – – – [58] 10 74.50% – 74.50% 74.50% 74.50% 74.50% 74.50% 74.50% 74.50% 74.50% 74.50% 74.50% – [60] 2 58.26% 93.22% – – – – – – – – – – 23.30% [62] 5 88.76% – – – – 88.76% – – – – – – – [61] 2 93.73% – – – – 98.22% – – – – – – – [59] 11 80.02% 80.02% – 80.02% – – – 80.02% 80.02% – – – (Table 1) contd...
Table 4. Summary of the literature studies related to environment recognition based on the ANN method. The number of environments analyzed, the average accuracy and the accuracy-related to each environment are reported. (cont.).
Study (Refs.) # Environments (per study) Average Accuracy (per study) Accuracy Boll Impact Accuracy Metal Impact Accuracy Wood Impact Accuracy Plastic Impact Accuracy Open or Close Door Accuracy Typing Accuracy Knocking Accuracy Phone Ringing Accuracy Grains Falling Accuracy Spray Accuracy Whistle Accuracy Voice Accuracy Music [57] 11 92.41% 100.00% 95.00% 96.50% 100.00% 85.00% 75.00% 90.00% 100.00% 80.00% 95.00% 100.00% – – [63] 4 77.00% – – – – – – – – – – – 62.00% 80.00%
Table 5. Summary of the literature studies related to environment recognition based on the ANN method. The number of environments analyzed, the average accuracy and the accuracy-related to each environment are reported. (cont.).
Study (Refs.) # Environments (per study) Average Accuracy (per study) Accuracy Laughing Accuracy Singing Accuracy Arguing Accuracy Sighing Accuracy Water Accuracy Traffic Accuracy Smoking Alarm Accuracy Birds Accuracy Clapping Accuracy Footsteps Accuracy Motorcycles Accuracy Rivers Accuracy Wind [62] 5 88.76% 88.76% 88.76% 88.76% 88.76% – – – – – – – – – [63] 4 77.00% – – – – 83.00% 83.00% – – – – – – – [61] 2 93.73% – – – – – – 89.23% – – – – – – [59] 11 80.02% – – – – – – 80.02% 80.02% 80.02% 80.02% 80.02% 80.02% 80.02%
Taking into account the set of studies we selected and analyzed from the literature, as listed in Tables 1 to 5 and in the bibliography section of this work, we can conclude that the majority of the studies (51.43%) uses only the accelerometer for the recognition of ADL, and only 9 studies (25.71%) used acoustic data for the recognition of the environments. Nevertheless, 5 studies (14.29%) present methods that fuse the data acquired from the accelerometer and gyroscope sensors. Other combinations are investigated in the literature, such as the fusion of the data acquired from the accelerometer and GPS receiver (2.86%), the fusion of the data acquired from the accelerometer and the gravity sensors (2.86%), and the fusion of the data acquired from the accelerometer, the magnetometer, the gyroscope and the GPS receiver (2.86%).
The number of ADL recognized by each study varies between 1 and 13 but in 96% of the studies that number varies between 1 and 7. In half of that studies, the number of ADL recognized is up to 5 included. In case of the number of environments recognized by each study, they vary between 1 and 11, but its dispersion is enormous. In 62.5% of that studies, the number of environments recognized is up to 5, and the rest (37.5%) are 10 and 11.
Tables 1 to 5 present the mapping between the study analyses and the ADL and environments recognized, including the accuracies reported for further comparison with our study. The accuracies presented are related to each ADL and environment recognition.
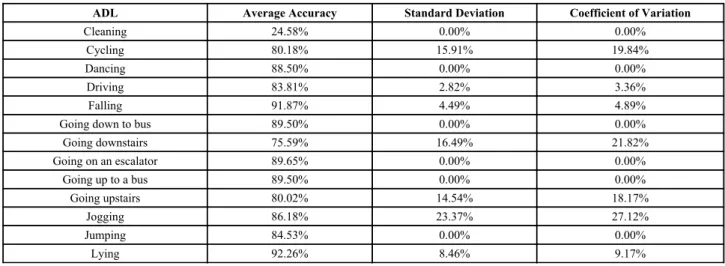
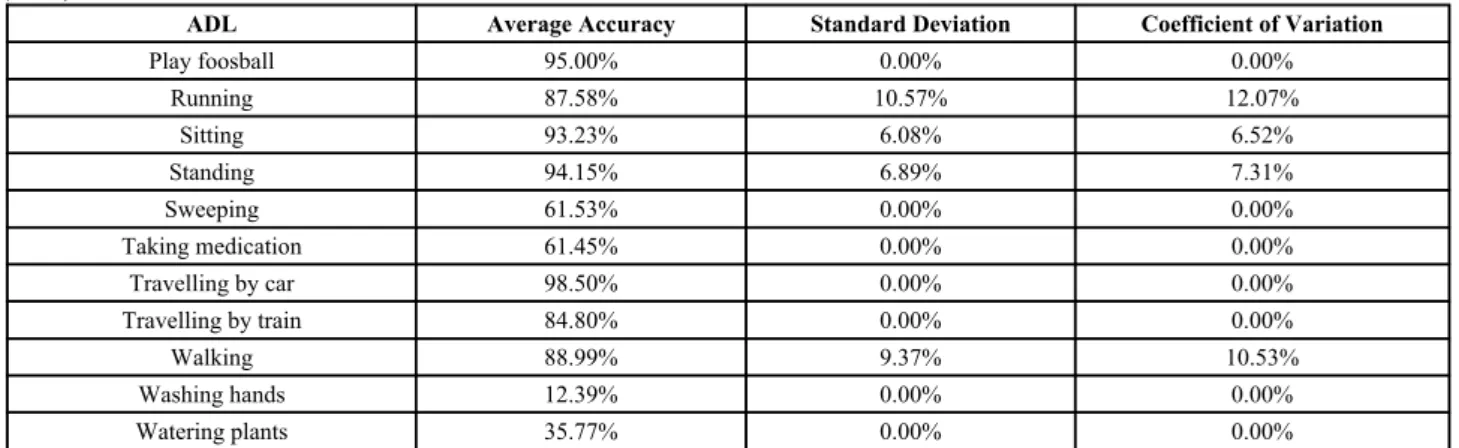
Finally, Tables 6 to 7 summarize the average, standard deviation and the coefficient of variation of the standard deviation of the accuracy for each ADL and environment recognized in the previous work analyzed. The low coefficient of variation of standard deviation values (<30%) permit conclude that both average accuracy of ADL and environments recognized are representative.
Table 6. Average accuracy of the ADL recognized.
ADL Average Accuracy Standard Deviation Coefficient of Variation
Cleaning 24.58% 0.00% 0.00%
Cycling 80.18% 15.91% 19.84%
Dancing 88.50% 0.00% 0.00%
Driving 83.81% 2.82% 3.36%
Falling 91.87% 4.49% 4.89%
Going down to bus 89.50% 0.00% 0.00%
Going downstairs 75.59% 16.49% 21.82% Going on an escalator 89.65% 0.00% 0.00% Going up to a bus 89.50% 0.00% 0.00% Going upstairs 80.02% 14.54% 18.17% Jogging 86.18% 23.37% 27.12% Jumping 84.53% 0.00% 0.00% Lying 92.26% 8.46% 9.17%
ADL Average Accuracy Standard Deviation Coefficient of Variation Play foosball 95.00% 0.00% 0.00% Running 87.58% 10.57% 12.07% Sitting 93.23% 6.08% 6.52% Standing 94.15% 6.89% 7.31% Sweeping 61.53% 0.00% 0.00% Taking medication 61.45% 0.00% 0.00% Travelling by car 98.50% 0.00% 0.00% Travelling by train 84.80% 0.00% 0.00% Walking 88.99% 9.37% 10.53% Washing hands 12.39% 0.00% 0.00% Watering plants 35.77% 0.00% 0.00%
Table 7. Average accuracy of the environments recognized.
Environment Average Accuracy Standard Deviation Coefficient of Variation
Arguing 88.76% 0.00% 0.00% Baby crying 87.16% 9.75% 11.19% Birds 80.02% 0.00% 0.00% Boll impact 100.00% 0.00% 0.00% Chainsaw 74.50% 0.00% 0.00% Clapping 80.02% 0.00% 0.00% Clock ticking 74.50% 0.00% 0.00% Cooking / Kitchen 46.54% 0.00% 0.00% Crowing rooster 74.50% 0.00% 0.00% Dogs 77.26% 0.00% 0.00%
Door opening / closing 85.00% 0.00% 0.00%
Emergency vehicles 89.98% 7.18% 7.98% Fire crackling 74.50% 0.00% 0.00% Footsteps 80.02% 0.00% 0.00% Grains falling 80.00% 0.00% 0.00% Helicopter 74.50% 0.00% 0.00% Knocking 90.00% 0.00% 0.00% Laughing 88.76% 0.00% 0.00% Metal impact 95.00% 0.00% 0.00% Motorcycles 80.02% 0.00% 0.00% Music 80.00% 0.00% 0.00% Plastic impact 100.00% 0.00% 0.00% Raining 77.26% 2.76% 3.57% Rivers 80.02% 0.00% 0.00% Sea waves 77.26% 2.76% 3.57% Sighing 88.76% 0.00% 0.00% Singing 88.76% 0.00% 0.00% Smoking alarm 84.63% 4.61% 5.44% Sneezing 74.50% 0.00% 0.00% Spray 95.00% 0.00% 0.00% Street 23.30% 0.00% 0.00% Telephone ringing 100.00% 0.00% 0.00% Traffic 83.00% 0.00% 0.00% Typing 75.00% 0.00% 0.00% Voice 62.00% 0.00% 0.00% Water 83.00% 0.00% 0.00% Whistle 100.00% 0.00% 0.00% Wind 80.02% 0.00% 0.00% Wood impact 96.50% 0.00% 0.00% (Table 6) contd...
1.4. Purpose of this Study
Based on our previous work [65 - 68], the purpose of this study consists in the development of an Android library that, depending on the number and type of sensors available onboard the mobile device, implements the framework previously designed for the recognition of the ADL and their environments exploiting the major number of sensors available in the mobile device used. The implementation should use lightweight methods in a mobile application in order to give a rapid feedback to the user with the data processing methods implemented locally on the mobile device.
The previous work explored the use of different implementations of ANN, such as MLP with Backpropagation, FNN method with Backpropagation and DNN method with normalized and non-normalized data. The framework implemented in this research is composed of several stages, these being: data acquisition, data processing, data fusion and classification methods. The data acquisition and processing depends on the types of sensors, where for the accelerometer, gyroscope and magnetometer data a low-pass filter is applied; for the acoustic data the Fast Fourier Transform (FFT) for the extraction of the relevant frequencies of the audio signal is applied; and for the location data no filters are applied as the raw data acquired is used for the measurement of the distance travelled [69]. Following the application of the low-pass filter and the FFT to clean the data acquired, some features related to the sensors’ signals were extracted and fused. Finally, the classification methods were applied for the recognition of ADL and environments.
The recognition of ADL and their environments are separated into three stages. These are the recognition of common ADL (i.e., walking, going upstairs, going downstairs, running, standing and watching TV), the recognition of the environments (i.e., bar, classroom, bedroom, gym, hall, kitchen, library, street and living room), and the recognition of ADL without body motion (i.e., sleeping, watching TV and driving). Based on the outcomes of previous works, firstly, for the recognition of the common ADL the method that reported better results was DNN method with normalized data. Secondly, for the recognition of environments, the method that reported better results was FNN method with non-normalized data, but, when compared with the previous results, this method reports a low performance and accuracy during the implementation of the Android library, where the results obtained are better with DNN method with normalized data. Finally, for the recognition of ADL without body motion, the method that reported better accuracy was also DNN method with normalized data. The data used in this study is available in the ALLab MediaWiki [70].
1.5. Structure of this Study
This section presents our motivation and related work for the development of an Android library for the recognition of ADL and their environments. The following sections present the methods used and results obtained with the developed Android library, including their discussion and comparison with research studies available in the literature with a similar purpose.
2. METHODS
2.1. Study Design and Participants
Off-the-shelf mobile devices are equipped with several sensors, e.g., accelerometer, gyroscope, magnetometer, microphone and GPS receiver, which allow the acquisition of several physical and physiological parameters.
This study is focused on the development of an Android library [71, 72] for the processing of the sensors data’ and recognition of ADL and their environments. The mobile device used for the tests of the Android library was a BQ
Aquarius device [73], but the sampling frequency of the sensors’ data acquisition is difficult to measure, because these
devices have several constraints, mostly because as the system operates in a time-sharing manner, it is impossible to assure a steady microprocessor attention to the sensor related processes.
Subjects (15 males and 10 females) aged between 16 and 60 years old were selected for the data acquisition with a mobile application that uses the Android library developed. Independently of the gender, we have selected people with distinct lifestyles, where 10 subjects assessed their living style as mainly active and the other 15 subjects self-assessed their living style as mainly sedentary. During the use of the mobile application, the mobile device is performing other tasks, such as receiving calls, using the Internet connection and using other mobile applications. However, the major part of the time, the mobile device is in the front pocket of the user’s pants for the correct data acquisition.
The developed mobile application acquired the sensors’ data as a background service, acquiring and processing slots of 5 seconds of data. With only 5 seconds of data, the ADL and environments will be recognized. The data acquisition is performed every 5 minutes, and 2000 captures for each ADL (i.e., walking, running, going upstairs, standing/watching TV, going downstairs, driving and sleeping) and environment (i.e., bedroom, bar, classroom, gym, kitchen, living room, hall, street and library), which corresponds to 10000 seconds (approximately, 2.7 hours) for each ADL and environment. During the performance of the experiments, the user should label the ADL and environment acquired because these data were used to train and test the methods for the classification, which are implemented in the Android library.
2.2. Description of the Framework
Following the previous work that explains the architecture and the method with best results in the recognition of ADL and their environments [18 - 20, 65 - 68], the framework implemented is a collection of the methods that, according to the literature, provide the best performance on recognition of ADL and environments, subjected to the available sensors in the mobile device where the framework is executed. Thus, its development is separated into several modules, such as data acquisition, data processing, data fusion and classification methods.
Data acquisition methods are not provided by the Android library, performing only the data processing, data fusion and classification methods. Data acquisition of the accelerometer, gyroscope, magnetometer, microphone and GPS data should be performed with the standard methods of Android platform, using a mobile application. For the remaining modules, the Android library should be a function of the number of sensors available in the mobile device.
Data processing methods implemented in the Android library consist of the data cleaning and feature extraction methods. The data cleaning method used depends on the type of sensors, i.e., for accelerometer, gyroscope and magnetometer data, the low pass filter is applied, and, for the acoustic data, the FFT is applied for the extraction of the relevant frequencies. The feature extraction also depends on the type of sensors, i.e., for accelerometer, gyroscope and magnetometer data, the features extracted are the five greatest distances between the maximum peaks combined with the Average, Standard Deviation, Variance and Median of the maximum peaks, and the Standard Deviation, Average, Maximum, Minimum, Variance and Median of the raw signal. For the acoustic data, the features extracted are the 26 Mel-Frequency Cepstral Coefficients (MFCC) combined with the Standard Deviation, Average, Maximum, Minimum, Variance and Median of the raw signal. Finally, for the location data, the feature extracted is the distance travelled.
After the data fusion of the features extracted from the sensors’ data, the normalization and classification methods are applied in three stages:
Stage 1:
Sensors: accelerometer, gyroscope and/or magnetometer;
Purpose: Recognition of walking, standing, running, going upstairs and going downstairs activities using
DNN method with normalized data.
Stage 2:
Sensors: Microphone;
Purpose: Recognition of bar, bedroom, classroom, gym, hall, kitchen, street, library and watching
TV/living room environments using FNN method with non-normalized data and/or DNN method with normalized data.
Stage 3:
Sensors: accelerometer, gyroscope, magnetometer and/or GPS receiver;
Purpose: Recognition of watching TV, sleeping and driving activities using DNN method with
normalized data.
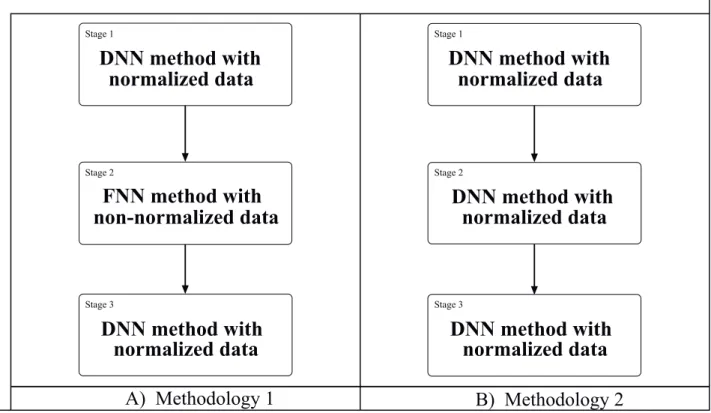
Related to the stage 2, the previous work [65] recommends the use of FNN method with non-normalized data. However, as it will be presented in the following sections, we verified that the accuracies could be improved by combining different methodologies:
Use of FNN method with non-normalized data, and, when the results are not clearly identified, the use DNN 1.
method with normalized data for these cases may perform a better recognition of the environments (Fig. 1A); Use only the DNN method with normalized data (Fig. 1B).
Fig. (1). Schema of the classification stage of the framework for the recognition of ADL and their environments.
The FNN method with non-normalized data was implemented, trained and tested with the Encog framework [74] in a Java desktop application, creating a neural network for further application in the mobile application. The DNN methods with normalized data were implemented, trained and tested with Deeplearning 4j framework [75] in a Java desktop application, creating a neural network for further application in the mobile application. The train of the neural networks needs a significant processing effort, that is performed previously on a desktop computer, using only the method developed in the mobile application. There are several parameters used for the creation and training of the neural network, including the activation function, and the learning rate and momentum values used, which are presented in Table 8. These configurations may influence the speed of the training stage as well as the results obtained with the trained network file.
Table 8. Configurations of the classification methods.
Parameters FNN method with Backpropagation DNN Method
Activation function Sigmoid Sigmoid
Learning rate 0.6 0.1
Momentum 0.4 N/A
Maximum number of training iterations 4 x 10⁶
4 x 10⁶
Number of hidden layers 0 3
Weight function N/A Xavier
Seed value N/A 6
Backpropagation Yes Yes
Regularization N/A L2
2.3. Test of the Method
We created a set of methods to test the correct identification of the ADL and environments using the Android library we developed. For this purpose, we acquired the sensors’ signal with a mobile device related to around 2.7 hours for each ADL and environments, correspondent to 2000 records with a length of 5 seconds, which are labelled in the mobile application in order to allow the measurement of the accuracy of the Android library developed. We
Stage 1
Stage 2
Stage 3
DNN method with
normalized data
non-normalized data
FNN method with
normalized data
DNN method with
Stage 1 Stage 2 Stage 3DNN method with
normalized data
normalized data
DNN method with
normalized data
DNN method with
A) Methodology 1
B) Methodology 2
implemented unit tests to evaluate the previously acquired records, reporting the ADL or environment recognized with each record in order to measure the overall recognition accuracy (percentage) of the Android library as well as the recognition accuracy (percentage) of each ADL and environment with the Android library.
3. RESULTS 3.1. Prototype
The main result of this study consists of the development of an Android library that implemented the framework for the recognition of ADL and their environments. In addition, a mobile application, with a Graphic User Interface presented in Fig. (2), that embeds the Android library developed, was implemented for its validation.
Fig. (2). Design of the interface of the Android application developed. Figures a) and b) present the main screen. Figure c) presents
the calendar with the daily planning. Figure d) presents the form for the creation of a planning record. Figure e) presents a calendar that highlights the days that have ADL and environments recognized. Figure f) presents a list of ADL and environments performed each day.
The main functionality of the mobile application developed consists in the presentation of the current or the last ADL, environment or location recognized (Fig. 2A and B). Based on the calendar, the mobile application has a module to manage the ADL and environments planned (Fig. 2C and D), Finally, the mobile application includes a module to show the list of the ADL and environments recognized by each calendar day (Fig. 2F), including the highlight of the respective calendar days that included the ADL and environments recognized (Fig. 2E).
In the following sections, the validation and results of the Android library embedded in the mobile application will
Dormir Quarto
Localizado no(a) Neste momento esta
ADL Recognation 34% 00:34 em R. Nova 25, 6230-453 Fundao Portugal, Portugal SOBRE NOS
after 30 minutes without sensors data acquisition
A Open Planning Calendar SVMSUNG SVMSUNG SVMSUNG SVMSUNG SVMSUNG SVMSUNG 2017-12-7 ADL Recognation 34% 00:30 2:47:3 Ultimo Registo Estava Desconhecide Localizado no(a) Desconhecide em Tv. das Oliveiras 1. B Open Assessment Calender E Historico 34% 00:34 1 2 3 4 5 6 7 8 9 10 11 12 13 14 15 16 17 18 19 20 21 22 23 24 25 26 27 28 29 30 31 1 2 3 4 5 6 7 27 28 29 30 34% 00:34 1 2 3 4 5 6 7 8 9 10 11 12 13 14 15 16 17 18 19 20 21 22 23 24 25 26 27 28 29 30 31 1 2 3 4 5 6 7 27 28 29 30 Planeamenta Data delnicio Adicionar planeamento Dats de Fim Deacer Eacados Quarto 34% 00:34 Create new Plan C D F Open Daily Assessment 2017-12-7
be shown, proving the reliability of the framework for the recognition of ADL and their environments.
3.2. Requirements
This study consists of the use of the sensors available in consumer mobile devices. Due to the different manufacturers in the market, these devices have a different number of sensors, and the Android library developed should be flexible and adaptable to the number of sensors effectively available, allowing their use with all devices available on the market.
To use our Android library, the mobile device should have a minimum number of sensors (i.e., accelerometer and microphone), but, depending on the number of sensors included in each mobile, the final accuracy of the recognition of ADL and their environments will be different. Thus, if the mobile device includes the GPS receiver, the mobile application will increase the number of ADL correctly recognized. And, if the mobile device has a network connection, the user’s location will be shown in the mobile application.
In conclusion, depending on the number of sensors available in the mobile device, the Android library is able to recognize between 5 and 7 ADL, and 9 environments, as shown in the next section.
3.3. Validation
Once the framework for the recognition of ADL and environments in the Android library was implemented, we tested both the different stages of the framework independently and the overall execution of the framework. For these tests, we took into account the different combinations of sensors possibly available in the mobile devices. These tests were performed with the dataset previously acquired and available at [70].
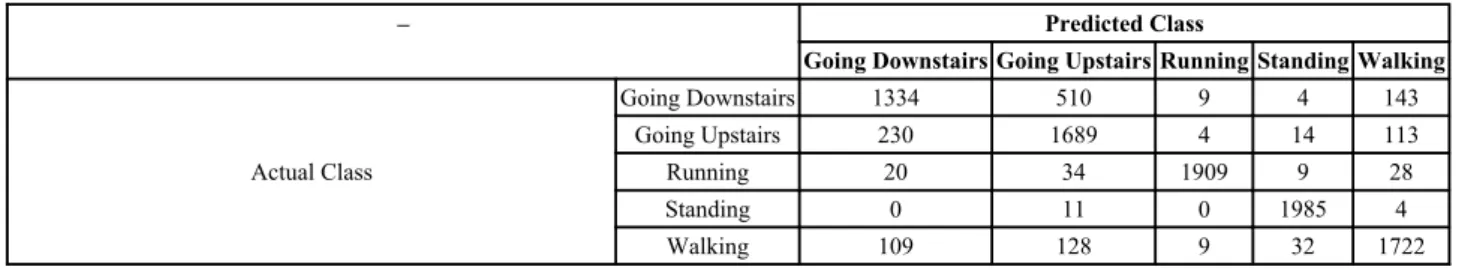
Based on the implementation of stage 1 for the recognition of common ADL (i.e., standing, walking, running, going upstairs and going downstairs) using the DNN method with normalized data, we achieved an average accuracy of 86.39% with the accelerometer sensor (Table 9), 86.49% with the accelerometer and magnetometer sensors (Table 10), and 89.15% with the accelerometer, magnetometer and gyroscope sensors (Table 11).
Table 9. Analysis of the results of stage 1 with the accelerometer sensor.
– Predicted Class
Going Downstairs Going Upstairs Running Standing Walking
Actual Class Going Downstairs 1334 510 9 4 143 Going Upstairs 230 1689 4 14 113 Running 20 34 1909 9 28 Standing 0 11 0 1985 4 Walking 109 128 9 32 1722
Table 10. Analysis of the results of stage 1 with the accelerometer and magnetometer sensors.
– Predicted Class
Going Downstairs Going Upstairs Running Standing Walking
Actual Class Going Downstairs 1359 445 2 13 171 Going Upstairs 214 1631 1 18 136 Running 20 32 1914 26 8 Standing 1 12 0 1984 3 Walking 60 125 1 53 1761
During the implementation of stage 2 for the recognition of environments (i.e., bedroom, bar, classroom, gym, kitchen, watching TV/living room, hall, street and library), we verified that the FNN method with Backpropagation used in the previous study [65], reported confused results. In fact, using the FNN method with Backpropagation, the framework reports an average accuracy of 22.68% in the recognition of the environments, recognizing only 4 out of 9 environments (Table 12). As the results were not good, we created a new method in the framework that first tries the recognition of the environments using an FNN method with Backpropagation, and, when the results are not clearly identified, automatically applies the DNN method with normalized data. This way, we obtained an average accuracy of 30.27% with a slowing down performance of the mobile device, recognizing 8 out of 9 environments (Table 13). Finally, we implemented the DNN method only with normalized data for the recognition of the environments,
increasing the performance of the Android library, and reporting an average accuracy of 45.68% recognizing all the environments (Table 14). In the next analysis related to the recognition of the environments, the results obtained with the DNN only method will be taken into account.
Table 11. Analysis of the results of stage 1 with the accelerometer, magnetometer and gyroscope sensors.
– Predicted Class
Going Downstairs Going Upstairs Running Standing Walking
Actual Class Going Downstairs 1545 325 1 3 126 Going Upstairs 204 1648 1 5 106 Running 5 46 1917 21 11 Standing 0 13 0 1987 0 Walking 19 118 2 43 1818
Table 12. Analysis of the results of stage 2 using FNN method with Backpropagation.
– Predicted Class
Bedroom Bar Class room Gym Hall Kitchen Library Street Watching TV/living room
Actual Class Bedroom 1878 0 0 0 0 1 0 0 121 Bar 823 0 0 0 0 358 443 0 376 Classroom 42 0 0 0 0 363 1389 0 206 Gym 1576 0 0 0 0 67 375 0 212 Hall 335 0 0 0 0 380 598 0 687 Kitchen 41 0 0 0 0 186 1660 0 113 Library 25 0 0 0 0 257 1523 0 195 Street 31 0 0 0 0 635 1068 0 266
Watching TV/living room 436 0 0 0 0 313 756 0 495
Table 13. Analysis of the results of stage 2 using FNN method with Backpropagation and DNN method.
– Predicted Class
Bedroom Bar Classroom Gym Hall Kitchen Library Street Watching TV/living room
Actual Class Bedroom 1878 0 0 0 0 0 0 0 122 Bar 823 188 147 3 0 385 0 0 454 Classroom 42 214 677 47 9 520 27 1 463 Gym 1576 25 104 0 0 75 8 0 212 Hall 335 37 129 5 132 574 12 12 764 Kitchen 41 28 291 4 138 1168 93 3 234 Library 25 19 897 0 0 333 398 3 325 Street 31 30 327 0 80 758 88 370 316
Watching TV/living room 436 300 310 1 3 350 2 0 598
Based on the implementation of stage 3 for the recognition of ADL without body motion (i.e., watching TV, sleeping and driving), the results obtained are always 100%, but these results depend on the results obtained during the previous stages of the framework for the recognition of ADL and their environments, because the outcomes depend on the correct recognition of the environment (stage 2), the correct recognition of the ADL as standing (stage 1) and the correct extraction of the GPS features.
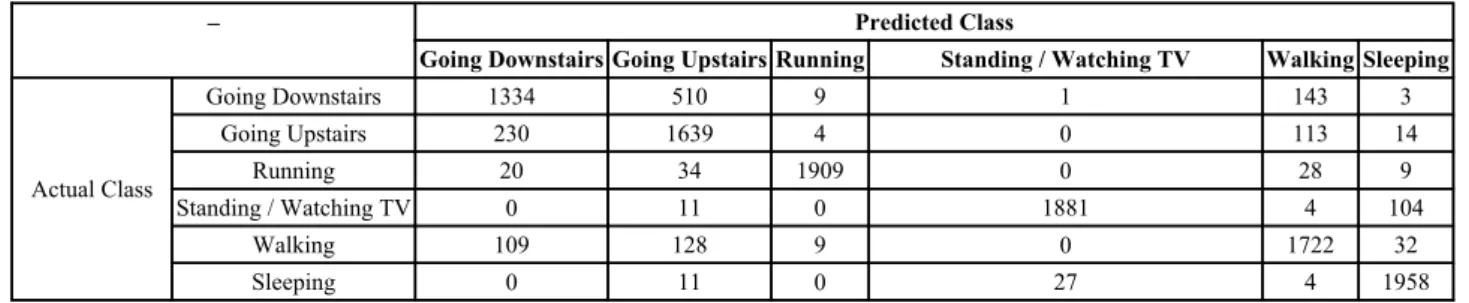
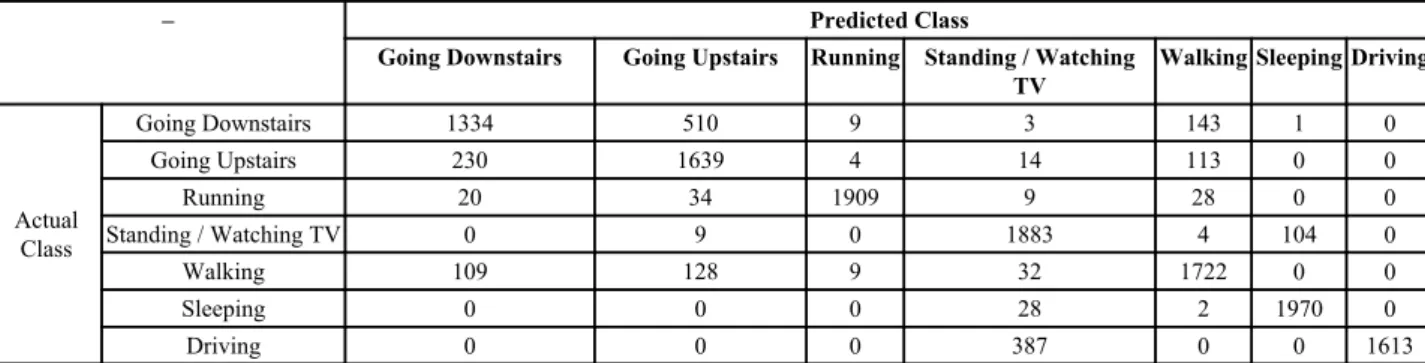
Finally, we tested the overall recognition of the ADL (i.e., walking, running, going upstairs, going downstairs, watching TV, sleeping and driving) with the sequential execution of the three stages using only the DNN method with normalized data, reporting an average accuracy of 58.02% with the use of the accelerometer and the environment recognized (Table 15); 58.34% with the use of the accelerometer, the magnetometer and the environment recognized (Table 16); 60.04% with the use of the accelerometer, the magnetometer, the gyroscope and the environment recognized (Table 17); 67.05% with the use of the accelerometer, the GPS receiver and the environment recognized (Table 18); 67.26% with the use of the accelerometer, the magnetometer, the GPS receiver and the environment recognized (Table
19), and, finally, 69.43% with the use of the accelerometer, the magnetometer, the gyroscope, the GPS receiver and the
environment recognized (Table 20).
Table 14. Analysis of the results of stage 2 using the DNN method.
– Predicted Class
Bedroom Bar Classroom Gym Hall Kitchen Library Street Watching TV/living room
Actual Class Bedroom 1972 1 0 0 3 0 0 0 24 Bar 0 441 204 1217 0 36 0 0 102 Classroom 0 374 759 80 173 174 27 1 412 Gym 0 91 136 1757 0 8 8 0 0 Hall 79 477 139 76 696 248 12 12 261 Kitchen 20 98 345 8 173 1027 95 3 231 Library 0 174 974 0 130 80 398 3 241 Street 3 58 379 7 651 228 89 507 78
Watching TV/living room 105 707 322 134 14 50 2 0 666
Table 15. Analysis of the overall recognition of the ADL with accelerometer and environment recognized.
– Predicted Class
Going Downstairs Going Upstairs Running Standing / Watching TV Walking Sleeping
Actual Class Going Downstairs 1334 510 9 1 143 3 Going Upstairs 230 1639 4 0 113 14 Running 20 34 1909 0 28 9 Standing / Watching TV 0 11 0 1881 4 104 Walking 109 128 9 0 1722 32 Sleeping 0 11 0 27 4 1958
Table 16. Analysis of the overall recognition of the ADL with accelerometer, magnetometer and environment recognized.
– Predicted Class
Going Downstairs Going Upstairs Running Standing / Watching TV Walking Sleeping
Actual Class Going Downstairs 1359 455 2 12 171 1 Going Upstairs 214 1631 1 18 136 0 Running 20 32 1914 26 8 0 Standing / Watching TV 1 12 0 1880 3 104 Walking 60 125 1 53 1761 0 Sleeping 1 12 0 27 3 1957
Table 17. Analysis of the overall recognition of the ADL with accelerometer, magnetometer, gyroscope and environment recognized.
– Predicted Class
Going Downstairs Going Upstairs Running Standing / Watching TV Walking Sleeping
Actual Class Going Downstairs 1545 325 1 3 126 0 Going Upstairs 204 1684 1 5 106 0 Running 5 46 1917 21 11 0 Standing / Watching TV 0 13 0 1883 0 104 Walking 19 118 2 43 1818 0 Sleeping 0 13 0 27 0 1960
Table 18. Analysis of the overall recognition of the ADL with an accelerometer, GPS receiver and environment recognized.
– Predicted Class
Going Downstairs Going Upstairs Running Standing / Watching TV
Walking Sleeping Driving
Actual Class Going Downstairs 1334 510 9 3 143 1 0 Going Upstairs 230 1639 4 14 113 0 0 Running 20 34 1909 9 28 0 0 Standing / Watching TV 0 9 0 1883 4 104 0 Walking 109 128 9 32 1722 0 0 Sleeping 0 0 0 28 2 1970 0 Driving 0 0 0 387 0 0 1613
Table 19. Analysis of the overall recognition of the ADL with an accelerometer, magnetometer, GPS receiver and environment recognized.
– Predicted Class
Going Downstairs Going Upstairs Running Standing / Watching TV
Walking Sleeping Driving
Actual Class Going Downstairs 1359 455 2 12 171 1 0 Going Upstairs 214 1631 1 18 136 0 0 Running 20 32 1914 26 8 0 0 Standing / Watching TV 0 10 0 1885 1 104 0 Walking 60 125 1 52 1761 1 0 Sleeping 0 5 0 28 1 1966 0 Driving 0 0 0 309 0 100 1591
Table 20. Analysis of the overall recognition of the ADL with an accelerometer, magnetometer, gyroscope, GPS receiver and environment recognized.
– Predicted Class
Going Downstairs Going Upstairs Running Standing / Watching TV
Walking Sleeping Driving
Actual Class Going Downstairs 1545 325 1 3 126 0 0 Going Upstairs 204 1684 1 5 106 0 0 Running 5 46 1917 21 11 0 0 Standing / Watching TV 0 9 0 1887 0 104 0 Walking 19 118 2 43 1818 0 0 Sleeping 0 9 0 28 0 1963 0 Driving 0 0 0 309 0 8 1683 4. DISCUSSION 4.1. Main Findings
Based on the partial results obtained in the previous work [65 - 68], we present a summary of the accuracies obtained in each stage of the framework for the recognition of ADL and their environments (Tables 21 to 23), for further comparison with the results obtained with the Android library developed for this study (Tables 24 to 26), which combines the different stages all together.
Table 21. Analysis of the accuracies reported in the studies [65 - 68] using the accelerometer sensor.
Stages Accelerometer Accelerometer
Microphone Accelerometer Microphone GPS Stage 1 85.89% 85.89% 85.89% Stage 2 - 86.50% 86.50% Stage 3 - 100.00% 100.00%
Stages Accelerometer Accelerometer Microphone Accelerometer Microphone GPS Overall 85.89% 90.80% 90.80%
Table 22. Analysis of the accuracies reported in the studies [65 - 68] using the accelerometer and the magnetometer sensors.
Stages Accelerometer Magnetometer Accelerometer Magnetometer Microphone Accelerometer Magnetometer Microphone GPS Stage 1 86.49% 86.49% 86.49% Stage 2 - 86.50% 86.50% Stage 3 - 100.00% 100.00% Overall 86.49% 91.00% 91.00%
Table 23. Analysis of the accuracies reported in the studies [65 - 68] using the accelerometer, the magnetometer and the gyroscope sensors. Stages Accelerometer Magnetometer Gyroscope Accelerometer Magnetometer Gyroscope Microphone Accelerometer Magnetometer Gyroscope Microphone GPS Stage 1 89.51% 89.51% 89.51% Stage 2 - 86.50% 86.50% Stage 3 - 100.00% 100.00% Overall 89.51% 92.00% 92.00%
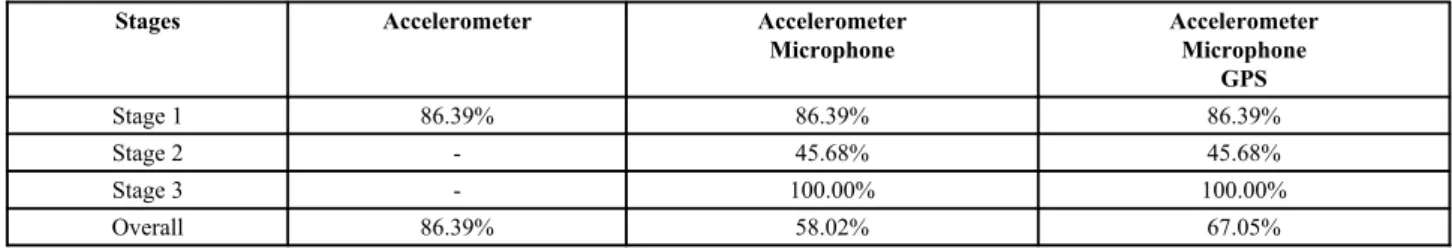
Table 24. Analysis of the accuracies reported by the Android library using the accelerometer sensor.
Stages Accelerometer Accelerometer
Microphone Accelerometer Microphone GPS Stage 1 86.39% 86.39% 86.39% Stage 2 - 45.68% 45.68% Stage 3 - 100.00% 100.00% Overall 86.39% 58.02% 67.05%
Table 25. Analysis of the accuracies reported by the Android library using the accelerometer and the magnetometer sensors.
Stages Accelerometer Magnetometer Accelerometer Magnetometer Microphone Accelerometer Magnetometer Microphone GPS Stage 1 86.49% 86.49% 86.49% Stage 2 - 45.68% 45.68% Stage 3 - 100.00% 100.00% Overall 86.49% 58.34% 67.26%
Table 26. Analysis of the accuracies reported by the Android library using the accelerometer, the magnetometer and the gyroscope sensors. Stages Accelerometer Magnetometer Gyroscope Accelerometer Magnetometer Gyroscope Microphone Accelerometer Magnetometer Gyroscope Microphone GPS Stage 1 89.15% 89.15% 89.15% (Table 21) contd...
Stages Accelerometer Magnetometer Gyroscope Accelerometer Magnetometer Gyroscope Microphone Accelerometer Magnetometer Gyroscope Microphone GPS Stage 2 - 45.68% 45.68% Stage 3 - 100.00% 100.00% Overall 89.15% 60.04% 69.43%
Following the results obtained in the stage 1, related to the recognition of the common ADL, with the implementation of the DNN method with normalized data, we verified that, with the Android library developed, the ADL are recognized with more accuracy (+0.50%) with the accelerometer sensor, with the same accuracy with the joint accelerometer and magnetometer sensors, and with less accuracy (-0.36%) with the accelerometer, magnetometer and gyroscope sensors than the accuracies obtained in the previous work [65 - 68]. Table 27 shows the values of the accuracy (A), the specificity (S), the recall (R) and the precision (P) of the recognition of each ADL as well as the average of these parameters in the Android library developed, verifying that the ADL with highest recognition accuracy is the standing with a precision of 97.11% and a recall of 99.25%, increasing the results in the framework, because it influences the results of stage 3.
Table 27. Recognition of each ADL in stage 1: mean values (%).
ADL Accelerometer Accelerometer Magnetometer Accelerometer Magnetometer Gyroscope A (%) S (%) R (%) P (%) A (%) S (%) R (%) P (%) A (%) S (%) R (%) P (%) Going Downstairs 89.80 95.54 66.70 78.80 90.73 96.31 68.29 82.16 93.15 97.14 77.25 87.14 Going Upstairs 89.61 91.46 82.39 71.21 90.05 92.21 81.55 72.65 91.66 93.60 83.91 76.65 Running 98.88 99.73 95.45 98.86 99.05 99.95 95.70 99.79 99.09 99.95 95.85 99.79 Standing 99.26 99.27 99.25 97.11 98.67 98.53 99.20 94.75 99.11 99.05 99.35 96.50 Walking 94.37 96.42 86.10 85.67 94.42 96.02 88.05 84.70 95.73 96.95 90.90 88.21
Following the results obtained in stage 2, related to the recognition of the environments, we tried to use the same method implemented in the previous works [65 - 68], which is the FNN method with Backpropagation and non-normalized data, but instead of the 86.50% of the recognition accuracy, the Android library reported an accuracy of 22.68% and only 4 environments were recognized. However, due to the capabilities of the mobile devices, the recognition obtained was very low, and we tried to combine the use of the FNN method with Backpropagation and non-normalized data with the use of the DNN method with non-normalized data, which proves that the accuracy obtained increases to 30.27%, recognizing 8 of the 9 proposed environments. As we verified that the use of the DNN method with normalized data increases the recognition accuracy of the environments, we tried to implement only the DNN method with normalized data, reporting an accuracy of 45.68%, recognizing all of 9 environments with better performance, because the execution of the DNN method requires less resources than the execution of the FNN method with Backpropagation. Table 28 shows the values of the accuracy (A), the specificity (S), the recall (R) and the precision (P) of the recognition of each environment as well as the average of these parameters in the Android library developed, verifying that the results with the highest precision were achieved in the street and the bedroom environments and the highest recall value in the recognition of the bedroom environment.
Table 28. Recognition of each environment in stage 2: mean values (%).
Environments Microphone A (%) S (%) R (%) P (%) Bedroom 98.69% 98.71% 98.60% 90.50% Bar 80.08% 87.44% 22.05% 18.22% Classroom 74.74% 80.49% 37.95% 23.30% Gym 86.60% 86.37% 87.85% 53.58% Hall 82.36% 90.37% 34.80% 37.83% Kitchen 86.67% 92.82% 51.35% 55.48% Library 87.16% 98.11% 19.90% 63.07% Street 90.19% 99.86% 25.35% 96.39% (Table 26) contd...
Environments Microphone
A (%) S (%) R (%) P (%)
Watching TV / living room 85.09% 91.57% 33.30% 33.05%
Following the results obtained in stage 3, related to the recognition of the ADL without body motion, with Android library developed, the ADL without body motion is recognized with 100% of recognition accuracy, which is the same accuracy reported by the previous works [65 - 68]. Tables 29 and 30 show the values of the accuracy (A), the specificity (S), the recall (R) and the precision (P) of the recognition of each ADL without body motion as well as the average of these parameters in the Android library developed, verifying that the values of the accuracy, recall, specificity and precision are always 100%.
Table 29. Statistical analysis of the recognition of each ADL in stage 3.
ADL Accelerometer Microphone Accelerometer Magnetometer Microphone Accelerometer Magnetometer Gyroscope Microphone A (%) S (%) R (%) P (%) A (%) S (%) R (%) P (%) A (%) S (%) R (%) P (%) Watching TV / Standing 100 100 100 100 100 100 100 100 100 100 100 100 Sleeping 100 100 100 100 100 100 100 100 100 100 100 100 Driving - - -
-Table 30. Statistical analysis of the recognition of each ADL in stage 3 (cont.).
ADL Accelerometer Microphone GPS Accelerometer Magnetometer Microphone GPS Accelerometer Magnetometer Gyroscope Microphone GPS A (%) S (%) R (%) P (%) A (%) S (%) R (%) P (%) A (%) S (%) R (%) P (%) Watching TV / Standing 100 100 100 100 100 100 100 100 100 100 100 100 Sleeping 100 100 100 100 100 100 100 100 100 100 100 100 Driving 100 100 100 100 100 100 100 100 100 100 100 100
Following the overall results obtained by the framework in the previous works [65 - 68], for the measurement of the overall accuracy, we took in account that when the ADL was recognized as an activity without motion, it was always correctly classified. Thus, using the same dataset for the tests, in the Android library, we tested the flow of the framework for the recognition of ADL, reporting accuracies between 58.02% and 86.49% with the accelerometer sensor, between 58.34% and 86.49% with the accelerometer and magnetometer sensors and between 60.04% and 89.15%, depending on the number of ADL recognized that varies between 5 and 7 ADL. Tables 31 and 32 show the values of the accuracy (A), the specificity (S), the recall (R) and the precision (P) of the recognition of each ADL as well as the average of these parameters in the Android library developed, verifying in general the results obtained reported highest precision and specificity, where the lower accuracies were reported for the going upstairs and downstairs activities.
Table 31. Statistical analysis of the recognition of each ADL in the framework.
ADL Accelerometer Microphone Accelerometer Magnetometer Microphone Accelerometer Magnetometer Gyroscope Microphone A (%) S (%) R (%) P (%) A (%) S (%) R (%) P (%) A (%) S (%) R (%) P (%) Going Downstairs 91.46 96.41 66.70 78.80 92.19 97.04 67.95 82.11 94.31 97.72 77.25 87.14 Going Upstairs 91.21 93.06 81.95 70.25 91.63 93.64 81.55 71.95 93.08 94.85 84.20 76.58 Running 99.06 99.78 95.45 98.86 99.25 99.96 95.70 99.79 99.28 99.96 95.85 99.79 Standing 98.79 99.72 94.05 98.53 97.87 98.64 94.00 93.25 98.20 99.01 94.15 95.01 Walking 95.25 97.08 86.10 85.50 95.33 96.79 88.05 84.58 96.46 97.57 90.90 88.21 Sleeping 98.30 98.38 97.90 92.36 98.77 98.95 97.85 94.91 98.80 98.96 98.00 94.96 (Table 28) contd...
ADL Accelerometer Microphone Accelerometer Magnetometer Microphone Accelerometer Magnetometer Gyroscope Microphone A (%) S (%) R (%) P (%) A (%) S (%) R (%) P (%) A (%) S (%) R (%) P (%) Driving - - -
-Table 32. Statistical analysis of the recognition of each ADL in the framework (cont.).
ADL Accelerometer Microphone GPS Accelerometer Magnetometer Microphone GPS Accelerometer Magnetometer Gyroscope Microphone GPS A (%) S (%) R (%) P (%) A (%) S (%) R (%) P (%) A (%) S (%) R (%) P (%) Going Downstairs 92.68 97.01 66.70 78.80 93.32 97.55 67.95 82.21 95.12 98.10 77.25 87.14 Going Upstairs 92.56 94.33 81.95 70.65 92.89 94.78 81.55 72.23 94.12 95.78 84.20 76.86 Running 99.19 99.82 95.45 98.86 99.36 99.97 95.70 99.79 99.38 99.97 95.85 99.79 Standing 95.79 96.06 94.15 79.92 96.00 96.29 94.25 80.90 96.27 96.59 94.35 82.19 Walking 95.94 97.58 86.10 85.59 96.03 97.36 88.05 84.74 96.96 97.98 90.90 88.21 Sleeping 99.03 99.13 98.38 94.54 98.29 98.28 98.30 90.52 98.94 99.07 98.15 94.60 Driving 97.24 100.00 80.65 100.00 97.08 100.00 79.55 100.00 97.74 100.00 84.15 100.00
One of the possible causes of the variability of the results between the previous work and the Android library developed may be the restrictions in hardware and software verified in the mobile devices, that will be analyzed in the next section.
4.2. Limitations
Due to the software and hardware limitations of the mobile devices, their use for the recognition of ADL and environments has several challenges, which are evidenced in several studies [76 - 81]. These are:
The use of several types of connection (e.g., Wi-Fi and Bluetooth) decreases the usable battery time; During the processing of the sensors’ data, the performance of the mobile device may decrease;
Due to the execution of several tasks at the same time and the reduced resources of these devices, the frequency of the data acquisition is not constant over the time;
The placement of the mobile device is one of the most important problems because it is very important for the acquisition of valid data, where there are no studies providing the absolute optimal position that can be good for any type of recognition one wants to perform because it depends on the purpose of the study;
If the processing of the sensors’ data is performed at a remote server, a permanent data connection should be available; this will also contribute to further decrease the usable battery time;
The number of sensors available in the consumer mobile devices is different by hardware version and manufacturers, but the developed methods should be a function of the number of sensors available on these devices; moreover, different manufacturers may report different error margins and even different output value ranges;
Regarding the use of multiple devices, the security, privacy and resilience of the data exchanged over the different types of network connections should be taken into account for the correct use of the mobile systems. For the minimization of the effects of the aforementioned limitations, several strategies are proposed in our study, these are:
These research studies may only use the sensors available in consumer mobile devices, reducing the constraints with the connection to external sensors and the battery lifetime;
The use of lightweight methods may reduce the problems with the reduced power processing of these devices; Another possible solution is to enable and disable the acquisition of the sensors’ data over the time because it is not necessary to have a continuous real-time sensor data acquisition in order to recognize the ADL and their environments;
The creation of methods adapted to the different sets of sensors available in the consumer mobile devices
increases the availability of the methods for a large group of people;
The use of local data processing reduces the time to give feedback to the user, but it also reduces the problems with the security and privacy of the personal data, despite increasing the computation burden of the device.
4.3. Comparison with Prior Work
Based on the previous research studies available in the literature, Table 33 presents the comparison between the minimum, maximum and average of the accuracy achieved and the results reported by the Android library developed. The results that are comparable are highlighted in Table 33, verifying that the highest improvement was verified in the running activity, when we compared our results whit the average accuracy achieved in prior work. For that activity, the minimum and the maximum accuracy founded are 68,70% and 100% respectively, returned a positive (27,15%) and negative improvement (-4.15%).
Fig. (3). Comparison between the minimum, maximum and average of the accuracies obtained in the literature review with the
common ADL and environments recognized by the Android library developed.
Table 33. Comparison between the minimum, maximum and average of the accuracies obtained in the literature review and the accuracy of our results in the recognition of the selected ADL and environments.
–
ADL / Environments: Minimum Accuracy (Min) Maximum Accuracy (Max) Average Accuracy (Avg) Our Results (OR) Improvements OR - Min OR - Max OR - Avg
Environments Bedroom N/A 98.60% +98.60% +98.60% +98.60%
Cooking/kitchen 46.54% 46.54% 46.54% 51.35% 4.81% +4.81% +4.81%
Gym N/A 87.85% +87.85% +87.85% +87.85%
Classroom N/A 37.95% +37.95% +37.95% +37.95%
Hall N/A 34.80% +34.80% +34.80% +34.80%
Watching TV/living room N/A 33.30% +33.30% +33.30% +33.30%
Bar N/A 22.05% +22.05% +22.05% +22.05% Library N/A 19.90% +19.90% +19.90% +19.90% Street 23,30% 23,30% 23.30% 25.35% +2.05% +2.05% +2.05% 100% 90% 80% 70% 60% 50% 40% 30% 20% Cooking /kit chen Street Running Going ups tair s W alking Going downs tair s Driving Standing Environments ADL Minimum Accuracy Maximun Accuracy Average Accuracy Our Results