978-1-5386-5326-5/18/$31.00 ©2018 IEEE
A Methodology for Assessing the Impact of the
Inter-annual Variability of Wave Energy Resource on
Elec-trical Energy Conversion
Nuno AmaroCentro de Investigação em Energia REN – State Grid, S.A.
Lisbon, Portugal [email protected]
Carlos Agostinho
Centre of Technology and Systems UNINOVA
Caparica, Portugal [email protected]
Rui Amaral Lopes Centre of Technology and Systems
UNINOVA Caparica, Portugal [email protected]
Francisco Abreu
Faculdade de Ciências e Tecnologia – Universidade Nova de Lisboa
Caparica, Portugal [email protected]
João Murta Pina
Centre of Technology and Systems UNINOVA
Caparica, Portugal [email protected]
David Torrado
Faculdade de Ciências e Tecnologia – Universidade Nova de Lisboa
Caparica, Portugal [email protected]
Abstract—This paper presents a methodology to assess the wave energy potential and the impact of inter-annual variability of the resource in overall energy production. This methodology was developed in the scope of a running H2020 project named Big-DataOcean, which aims to create a data repository and service marketplace for the maritime sector. The methodology is applied considering data from two different locations in the Portuguese coast for the years of 2016 and 2017. Additionally, two wave energy converters are also used to verify the impact of inter-annual vari-ability in the energy production through well-established KPI’s.
Keywords—BigDataOcean, wave energy, wave assessment
I. INTRODUCTION
The energy sector has been facing deep changes in the last few decades. Most of these changes are derived from the fact that this sector is responsible for a large share of the global CO2
and other pollutants emissions, which results on planet environ-ment degradation. To reduce their carbon footprint, as well as their energy dependence, most countries have been focusing on the exploitation of renewable energy sources to produce electric energy. Theoretically, oceans alone can have a significant role in fulfilling the world needs for electrical energy by using four dif-ferent renewable energy sources: wave, tidal, thermal gradient and salinity gradient [1][2].
Wave energy has gained a lot of attention from the scientific community and from policymakers over the last years and mul-tiple technologies for wave energy converters (WEC) are already under development, in different maturity stages, from concept to pre-commercial status [3][4]. However, this industry still faces many different challenges, mostly related to survivability and economic viability of projects. One first step to contributing to the overcome of such challenges is to have a fast, costless and accurate assessment of wave energy potential, which is the most important factor for the correct choice of a location to deploy a wave farm. Additionally, although waves have been reported as having a high availability and predictability when compared to wind, there is still a significant seasonal, but also inter-annual variability of the resource [5][6]. In this paper, we aim to study
and verify the impact of the seasonal and inter-annual variability of the wave energy resource on the produced electric power and energy. Resource assessment studies cannot be based on average wave characteristics. This would not consider extreme wave conditions that might endanger the WEC survivability. Thus, large datasets are required and data processing represents a sig-nificant effort.
To perform this study, a methodology has been developed under the scope of BigDataOcean project [7], and is used to ver-ify the effects of seasonal and inter-annual variability of waves in the electrical energy conversion. To validate the methodology, two consecutive years were selected – 2016 and 2017 – using data from two different locations in the Portuguese West coast for resource characterization. The methodology allows assessing the effect of variability of the resource on the output of different WECs. Two are selected in this paper, but the methodology is easily extended to other WEC technologies, locations or time pe-riods under analysis, due to the big data capabilities of the Big-DataOcean platform.
This paper is organized as follows: section II briefly de-scribes the BigDataOcean project and the wave power pilot where the current methodology is validated; section III presents the developed methodology; in section IV the case study used in the pilot is presented. Discussion of results and conclusions are drawn in Section V.
II. THE BIGDATAOCEAN PROJECT
BigDataOcean (www.bigdataocean.eu/) is an H2020 funded project that aims to capitalize on existing modern technological breakthroughs in the areas of the Big Data driven economy to revolutionize the way maritime-related industries work. Mari-time-related industries, more traditional or not, are facing a chal-lenge related with the plethora of different data sources, not yet being able to capitalize on their potential [8].
Nearly three quarters of our planet is covered by water and it is largely accepted that the marine areas withhold a large eco-nomic potential. Nevertheless, the large majority of them remain
unexplored and it is not easy to know where to start [9]. Since ancient times the sea effectively satisfied nutritional needs and provides an efficient transportation infrastructure. However, only more recently it is becoming recognized as an important source of energy, especially through waves and tides. Indeed, relevant studies evince that “blue economy”, although difficult to monetize, is clearly a significant and strategic industry for the European Union and has the potential to grow even further [10]. BigDataOcean aims at building and rolling out a completely new value chain of interrelated data streams coming from di-verse sectors, languages and residing on cross-technology inno-vations being delivered in different formats in order to create a curated, semantically enhanced, interlinked and multilingual re-pository for maritime big data. Different stakeholders will be able enhance their activities, developing new solutions through a multi-segment platform that will combine data of different ve-locity, variety and volume under an inter-linked, trusted, multi-lingual engine [11]. At technical level BigDataOcean is working towards the greatest repository for maritime data to enable big data scenarios; At business level, it is providing a collaborative but also flexible environment with the tools and business logic capabilities to support decisions based on data, and; At scientific level it is automating many of the reasoning processes.
To validate the project results and assure a continuous utili-zation of the developed big data platform, four different pilots / use cases are currently being designed. One of them envisages to run services on top a created database including all necessary data needed to perform quick and accurate assessment of wave energy potential, fastening the process of performing the differ-ent studies that ultimately lead to the choice of an exact location to place a wave farm. The methodology developed in the scope of BigDataOcean is thus presented in this paper.
III. METHODOLOGY
The methodology followed in this work, which is applied in one of the pilots of BigDataOcean, is straightforward, meaning that the effort and technical-scientific skills required to its users are minimum. It involves:
• Data selection and collection (and, eventually, pre-pro-cessing) from available data sources, concerning two consecutive years.
• Assessment of the wave resource, by calculation of av-erage energy/power values within reference periods (day/month/year).
• Extraction of key performance indicators allowing com-paring wave resource (primary energy) in two distinct years.
• Selection of test WEC technologies.
• Determination of the energy production from WECs in the considered years.
• Extraction of key performance indicators for electrical energy conversion and its inter-annual variability. The main steps and methods in the previous list, that are per-formed by the BDO platform, are described in the next subsec-tions.
A. Resource Assessment: The Occurrence Matrix
The energy flux from deep water waves may be expressed as the power per length of wave crest, such as in [12]–[14]:
(
)
2 2[
]
0 10 3 0 2 0 , kW/m 64 10 0.49 , m m e m e g P H T H T H T ρ π − = × = (1)where ρ is the density of sea water (1,030 kg/m3), g is the
accel-eration of gravity (9.8 m/s2), Hm0 is the significant wave height
(m) and Te is the energy period (s). Hourly average values of Hm0
and Te are used, and thus power is numerically equivalent to
available energy per hour.
Equation (1) is applied for calculating average energy/power values within reference periods previously mentioned. An occur-rence matrix, Fref, which describes the probability of each state,
given by a specific
(
Hm0,T pair, is typically used. In that ma-e)
trix rows thus represent the discretized heights and columns the discretized periods. Each element of Fref, corresponding to the
probability of a given sea state in the test location, is approxi-mated by the frequency of occurrences of that state in the se-lected sample, i.e. for a given instance of
(
Hm0,T , its fre-e)
quency is just the quotient between the number of occurrences of that specific pair in the sample (e.g. number of hours in which that state was observed) and the total number of measurements (e.g. number of hours of a month or a year).The occurrence ma-trix allows determining the energy available in the wave resource in a given reference period (e.g. one month or one year), through
[
kWh/m ,]
ref h = ⋅ ⋅ wave REF E P F (2)where Ewave is the matrix whose elements represent the energy
of a given sea state in the reference period in hours, href, and P is
the matrix composed of the average power of each of those states, as calculated by (1).
The total primary energy available in the wave resource in the reference period corresponding to href, Eres, is obtained
sum-ming all the elements in Ewave,
(
,)
[
kWh/m .]
res m n
E =
Ewave m n (3)B. WEC Output Estimation: The Power Matrix
The amount of energy that can be extracted by a wave energy converter depends not only on the amount of (primary) energy available in the waves as well as on the efficiency of the con-verter throughout all the operation conditions. WECs are com-plex systems, composed of several intermediate conversion stages (absorption, transmission, generation and conditioning [15]), with different control loops and strategies, and are classi-fied according to their operation principle; location relatively to the shoreline, which determines water depth; power take-off sys-tem used to convert wave energy into electrical energy; and ge-ometry and orientation (a review of converters can be found e.g. in references [16], [3]). Despite this complexity and variety, WECs are typically analyzed by means of their wave-to-wire models, which describe all the conversion from wave to grid (wire) [15]. These models include all the dynamics and control
strategies of the distinct stages [16], and allow computing power matrices of the converters, i.e. matrices that provide the output power of the system for each sea state
(
Hm0,T . Therefore, if e)
PWEC is the power matrix of the converter, then the matrix ofconverted electrical energy for each sea state, EWEC, is simply
determined by
[
kWh/m .]
ref h
=
WEC WEC ref
E P F (4)
The total energy converted in the reference period corre-sponding to href, Econv, is given by the sum of all elements in E,
(
,)
[
kWh/m .]
conv m n
E =
E m n (5)C. Key Performance Indicators
The Key Performance Indicators (KPIs) selected for charac-terizing the inter-annual variability of both the resource and the electrical energy conversion (i.e. the output of distinct WECs) are:
• Mean absolute percentage deviation among monthly en-ergy available/converted, MAPD, given by
12 1 100% 12 j i k k j k k E E MAPD E = − = ⋅
(6) where j kE is the energy in month k and year j and i k
E is the same for year i. In this work the reference year, j, is 2016, where i is 2017.
• Standard deviation of the absolute differences among monthly energy available/converted, which is
2 12 1 12 j i k k j k k E E MAPD E SD = − − =
(7) As usual, while MAPD will provide a measure of the meandeviation from each month to the same in the previous year, SD represents the dispersion of that deviation.
To characterize the WECs performance, three KPIs have also been selected, namely:
• Capacity factor, CF, which is the ratio of the monthly converted energy by a WEC, Econv, to the energy that
would have been produced if the operation was at rated power, 100% 24 conv rat d E CF P N = ⋅ ⋅ ⋅ , (8)
where Nd is the number of days of the envisaged month.
• Cut-off duration, hco, corresponding to the number of
hours that a WEC is down due to power in the waves ex-ceeding its maximum operating power.
• Specific annual yield, ya, which is the ratio of the energy
converted in a year to the rated power of a WEC,
[
kWh/kW]
conv a rat E y P = . (9)IV. CASE STUDY
The methodology described in this paper was applied to data from two consecutive years (2016 and 2017) for two locations of the Portuguese West coast. Data were obtained from a numer-ical model for wave forecasting (WaveWatch III) instantiated to the Portuguese coast. The chosen model is already validated and used worldwide. Nonetheless, the two selected locations also have buoys that measure wave characteristics, which further im-proves the reliability of the model and its results.
A. Sites location
The two selected locations are placed south of an offshore renewable pilot zone, which is a public concession given by the Portuguese government to ENONDAS. The pilot zone is ad-dressed under the commercial name Oceanplug [17]. This pilot zone extends for a total of 320 km2. The near placement of the
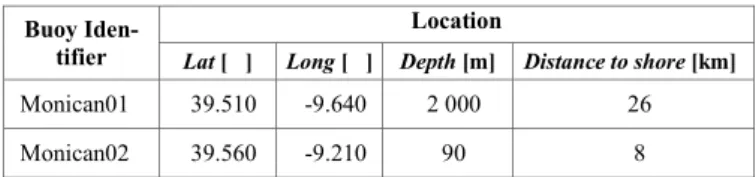
two buoys, when compared to the location of the pilot zone and sea characteristics of the area, allow an extrapolation of results to the whole pilot zone. One-hour resolution timeseries were se-lected from the operational modelling charts Web interface of the Marine, Environment and Technology Center (MARETEC) [18]. This interface allows obtaining forecasts based on the mod-els operated by this research center, as well as accessing opera-tional data from several meteorological stations and monitoring buoys. In this work, data from the numerical model correspond-ing to the locations of two buoys was selected. These character-istics are described in Table I.
TABLE I. SELECTED LOCATION CHARACTERISTICS
Buoy Iden-tifier
Location
Lat [ ] Long [ ] Depth [m] Distance to shore [km]
Monican01 39.510 -9.640 2 000 26
Monican02 39.560 -9.210 90 8
The assessment of resource availability was performed for both selected locations and during the two selected years. Fig. 1 and Fig. 2 depict the occurrence matrices Fref at Monican01 and
Monican02 respectively, for the year 2016. Taking into consid-eration the nearby location, sea states present similar character-istics at both buoys. This is an important result to allow an ex-trapolation for other nearby locations, such as the area inside the pilot zone.
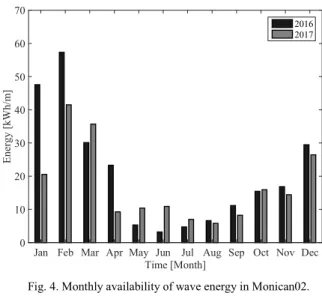
During the two selected years, sea states at the two selected locations demonstrated a significant variability as depicted in Fig. 3 and in Fig. 4 for Monican01 and Monican02, respectively. Collected results show that the annual wave energy resource pre-sents a variation of 18% from 2016 to 2017 (decreasing from an average of 249 MWh/m·month in 2016 to 205 MWh/ m·month in 2017). However, as depicted in Fig. 3, this decrease is not constant over the year. For instance, in January, from 2016 to 2017, the wave energy resource was reduced to less than 50%, while in July it increased by more than 100%.
Using (6) and (7), MAPD=49% and SD=56% are ob-tained for the wave resource at Monican01. This is similar to Monican02. The existing variability is translated in considerable differences on the wave power availability. As presented in Fig. 5, the power duration curve (number of hours above a spe-cific power) is considerably modified from 2016 to 2017, espe-cially for lower power values. The results depicted in this figure are related to Monican01, but Monican02 presents similar re-sults.
Fig. 1. Occurrence matrix for 2016: Monican01 location.
Fig. 2. Occurrence matrix for 2016: Monican02 location.
Fig. 3. Monthly availability of wave energy in Monican01.
Fig. 4. Monthly availability of wave energy in Monican02.
Fig. 5. Power availability vs hours (in percentage of a year): Monican01. B. Selected WECs
In the last subsection, the resource assessment study per-formed for the two considered years demonstrated a non-negli-gible inter-annual variability of the available wave energy, which may lead to different power and energy outputs of WECs. To verify the effect of this wave variability, two different WECs were considered and their behavior was analyzed using the de-veloped methodology. The analysis performed includes the ver-ification of cut-off periods, due to high-energy sea states, which may compromise the WEC. This analysis also allows providing inputs to verify survivability conditions of the converters.
The first selected WEC to verify the location adequacy is Pelamis [19]. This is a well-known WEC device and the main reason for this choice was the fact that the power matrix of the WEC is well known and spread in the literature. Although this WEC does not longer exist due to company bankruptcy in 2014, it is still a valid choice to prove the methodology presented in this paper, particularly because the device operated for more than 15,000 hours [20]. The Pelamis is an attenuator-type WEC and can produce a maximum power of 750 kW. Its power matrix is depicted in Fig. 6.
Time [Month]
Jan Feb Mar Apr May Jun Jul Aug Sep Oct Nov Dec
E ne rgy [kW h/ m ] 0 10 20 30 40 50 60 70 2016 2017 Time [Month]
Jan Feb Mar Apr May Jun Jul Aug Sep Oct Nov Dec
E ne rgy [kW h/ m ] 0 10 20 30 40 50 60 70 2016 2017 Power [kW/m] 0 25 50 75 100 125 150 175 200 A m ount of H ours [%] 0 10 20 30 40 50 60 70 80 90 100 2016 2017
Fig. 6. Pelamis power matrix.
The second WEC selected to demonstrate the implemented methodology is a recent concept named CECO [21]. This WEC is projected to operate in shallower waters (from 30 m to 50 m). Although the data considered here corresponds to a depth of 200 m, results are to be extrapolated to the Portuguese pilot zone. This zone comprises different depths between 30 m and 90 m, thus making this a feasible device to be installed. The CECO device operates using an attenuation principle and the consid-ered power matrix used, depicted in Fig. 7 was obtained from [21], corresponding to an operation in a depth of 50 m.
Fig. 7. CECO power matrix [21].
C. Performance Assessment of the WECs
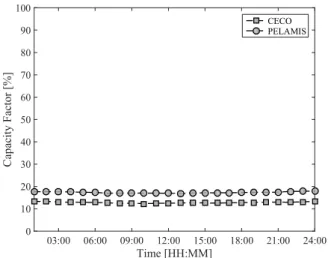
As referred in Section III, a set of three KPIs was used to assess the selected WECs’ operation. Table II summarizes the collected results for these indicators, which are detailed through-out this section. The capacity factor, CF, whose results are ex-pressed in terms of annual average, decreases from 2016 to 2017 for both WECs, reflecting a lower primary energy resource availability in the second year. These results reflect the infor-mation previously reported in Subsection IV.A. Fig. 8 depicts the results obtained for 2017 and Monican01 location but differ-ent combination of year and buoy would conduct to similar find-ings. Additionally, Fig. 8 also presents the monthly average CF (thicker curve), which shows higher values during winter months, reflecting, again, the information already presented in Subsection IV.A.
When comparing both WECs in Fig. 9, Pelamis related CF values are always higher than those registered for CECO, except when the primary energy resource is excessively high. In these cases, the Pelamis power output is set equal to zero to avoid equipment failure or excessive aging. As presented in Table II, the amount of time that Pelamis is on cut-off state, hco, ranges
from 26 hours in 2017 for Monican02 to 65 hours in 2016 for Monican01, while CECO presents no cut-off periods. The better performance of CECO in terms of cut-off periods reflects the re-spective technology characteristics that supports higher wave power values, as can also be inferred from Subsection IV.B (see Fig. 7). The specific annual yield, ya, of both WECs also differs
considerably. Even with the registered cut-off periods, Pelamis overlaps CECO in all year and buoy combinations. This indica-tor, together with the fact that Pelamis presents higher CF values in most instants, shows that this WEC is more suitable for the analyzed locations in terms of energy production. This is also validated by the fact that, despite Pelamis shows a higher devia-tion to reference year than CECO (58% vs. 51% MAPD), it has a much lower standard deviation (42% vs. 64%).
TABLE II. WECS KEY PERFORMANCE INDICATORS
KPI
Monican01 Monican02 Pelamis CECO Pelamis CECO 2016 2017 2016 2017 2016 2017 2016 2017 CF [%] 22 19 17 14 20 16 15 13 hco[h] 65 31 0 0 41 26 0 0 ya [kWh/ kW] 1952 1621 1458 1223 1707 1401 1331 1120 a) b)
Fig. 8. 1-hour resolution and monthly average in 2017: Capacity Factor values for a) Pelamis and b) CECO.
Time [Month]
Jan Feb Mar Apr May Jun Jul Aug Sep Oct Nov Dec
C ap acity F acto r [% ] 0 10 20 30 40 50 60 70 80 90 100 1-hour Resolution Monthly Average Time [Month]
Jan Feb Mar Apr May Jun Jul Aug Sep Oct Nov Dec
P owe r Output [ kW /kW ] 0 0.1 0.2 0.3 0.4 0.5 0.6 0.7 0.8 0.9 1 1-hour Resolution Monthly Average
Regarding their average daily power output, both WECs pre-sent a relatively constant profile, as depicted in Fig. 9 (each value of this figure refers to the average of the analyzed 365 days for 2017). Nevertheless, it is worth mentioning that such daily pro-file would present different values throughout the year if com-puted monthly, following the availability of the primary energy resource.
Fig. 9. Average 1-hour resolution Capacity Factor for both WECs for 2017.
V. CONCLUSIONS
This paper presents a methodology to assess wave energy potential and verify the effect of seasonal and inter-annual re-source variability in the overall produced energy. The method-ology is implemented under the scope of an H2020 project named BigDataOcean and allows users to perform wave poten-tial assessment studies in a straightforward way. These studies require processing large datasets thus being time consuming and requiring computational effort.
The methodology here presented is validated using data from two consecutive years in two different locations and for two dif-ferent WEC devices. Numeric KPI’s allow concluding that for the particular locations selected, Pelamis proves a higher suita-bility than CECO. Using the implemented methodology, which will be available in the BigDataOcean online platform, studies can be extrapolated to other geographies and using different con-verters. This allows users to quickly perform resource assess-ment studies for wave energy solutions. The results provided by the BigDataOcean pilot in which this methodology is imple-mented aim to be used for further (and more detailed) site plan-ning studies, thus contributing to the further development of this renewable energy source.
ACKNOWLEDGMENT
This work and the BigDataOcean project have received fund-ing from the European Union’s Horizon 2020 research and in-novation programme under grant agreement No. 732310.
REFERENCES
[1] World Energy Council, “2010 Survey of Energy Resources,” 2010. [2] World Energy Council, “World Energy Resources: 2013 survey,” 2013. [3] B. Czech and P. Bauer, “Wave energy converter concepts : Design
challenges and classification,” IEEE Ind. Electron. Mag., vol. 6, no. 2, pp. 4–16, 2012.
[4] L. Rusu and F. Onea, “Assessment of the performances of various wave energy converters along the European continental coasts,” Energy, vol. 82, pp. 889–904, 2015.
[5] B. Drew, A. . Plummer, and M. N. Sahinkaya, “A review of wave energy converter technology,” J. Power Energy, vol. 223, pp. 887–902, 2009. [6] R. Carballo, M. Sánchez, V. Ramos, J. A. Fraguela, and G. Iglesias, “The
intra-annual variability in the performance of wave energy converters: A comparative study in N Galicia (Spain),” Energy, vol. 82, pp. 138–146, 2015.
[7] BigDataOcean, “Exploiting Ocean’s of Data for Maritime Aplications.” [Online]. Available: https://cordis.europa.eu/project/rcn/205983_en.html. [Accessed: 01-Mar-2018].
[8] I. Zaman, “Big Data in the Marine Sector,” 2017. [Online]. Available: http://www.maritimejournal.com/news101/onboard-systems/monitoring-and-control/big-data-in-the-marine-sector. [Accessed: 01-Mar-2018]. [9] National Oceaning and Atmospheric Administration, “How much of the
ocean have we explored?” [Online]. Available: https://oceanservice.noaa.gov/facts/exploration.html. [Accessed: 01-Mar-2018].
[10] Maritime Forum - European Commission, “Size of blue economy,” 2016.
[Online]. Available: https://webgate.ec.europa.eu/maritimeforum/en/frontpage/225.
[Accessed: 01-Mar-2018].
[11] J. Ferreira et al., “Maritime data technology landscape and value chain exploiting oceans of data for maritime applications,” in 2017 International Conference on Engineering, Technology and Innovation (ICE/ITMC), 2017, pp. 1113–1122.
[12] W. Sheng and H. Li, “A method for energy and resource assessment of waves in finite water depths,” Energies, vol. 10, no. 4, pp. 1–17, 2017. [13] S. Barstow and A. Kabuth, “Assessing the Global Wave Energy
Potential,” no. 2008, pp. 1–8, 2014.
[14] J. Falnes, “A review of wave-energy extraction,” Mar. Struct., vol. 20, no. 4, pp. 185–201, 2007.
[15] M. Penalba and J. V. Ringwood, “A review of wave-to-wire models for wave energy converters,” Energies, vol. 9, no. 7, 2016.
[16] L. Wang, J. Isberg, and E. Tedeschi, “Review of control strategies for wave energy conversion systems and their validation: the wave-to-wire approach,” Renew. Sustain. Energy Rev., vol. 81, no. August 2017, pp. 366–379, 2018.
[17] ENONDAS, “OceanPlug - portuguese pilot zone.” .
[18] Maretec, “Forecast Model Data.” [Online]. Available: http://forecast.maretec.org/stations/. [Accessed: 01-Mar-2018].
[19] EMEC - The European Marine Energy Centre Ltd, “Pelamis Wave Power.” [Online]. Available: http://www.emec.org.uk/about-us/wave-clients/pelamis-wave-power/. [Accessed: 01-Mar-2018].
[20] EMEC - The European Marine Energy Centre Ltd, “Press Release: EMEC seeks feedback from industry for P2-002,” 2016. [Online]. Available: http://www.emec.org.uk/press-release-emec-seeks-feedback-from-industry-for-p2-002/. [Accessed: 01-Mar-2018].
[21] P. Rosa-Santos, F. Taveira-Pinto, V. Ramos, and M. Lopez, “Assessing the performance of the CECO wave energy converter in the Portuguese near-shore,” in Proceedings of the Twelfth European Wave and Tidal Energy Conference, 2017, no. October, p. 788.
Time [HH:MM] 03:00 06:00 09:00 12:00 15:00 18:00 21:00 24:00 C ap acity Facto r [%] 0 10 20 30 40 50 60 70 80 90 100 CECO PELAMIS
![Fig. 7. CECO power matrix [21].](https://thumb-eu.123doks.com/thumbv2/123dok_br/18133971.870608/5.892.467.832.350.1020/fig-ceco-power-matrix.webp)