Comunicação e Sociedade, NÚMEROESPECIAL, 2012, pp. 39-55
Making sense of cancer news coverage trends:
a comparison of three comprehensive content analyses
Jakob D. Jensen*
Cortney M. Moriarty**
Ryan J. Hurley***
Jo Ellen Stryker****
Abstract: Cancer stories (N = 5,327) in the top 50 U.S. newspapers were analyzed by a
team of four coders and the results were compared with the earliest analyses of this type (from 1977 and 1980). Using cancer incidence rates as a comparison, three cancers were found to be consistently underreported (male Hodgkin’s, and thyroid) and four cancers were found to be consistently overreported (breast, blood/Leukemia, pancreatic, and bone/ muscle). In addition, cancer news coverage consistently has focused on treatment rather than on other aspects of the cancer continuum (e.g., prevention), portrayed lifestyle choices (e.g., diet, smoking) as the most common cancer risk factor, and rarely reported incidence or mortality data. Finally, the data were compatible with the idea that personalization bias (e.g., celebrity profiles, event coverage) may explain some news coverage distortions.
Keywords: cancer, news coverage, content analyses, health communication.
In their latest review of cancer trends, Jemal and colleagues (2008) noted that for all cancer sites combined, incidence rates have stabilized and mortality rates continue to decrease. At the site level, however, certain cancers still share a disproportionate amount of the cancer burden. Prostate, breast, lung, and colon cancers account for 50% of new cancer cases as well as 49%-50% of estimated cancer deaths.
* Assistant Professor in the Department of Communication at the University of Utah ([email protected]). ** Assistant Professor at College of Mount Saint Vincent ([email protected]).
*** Senior Lecturer at North Carolina State University([email protected]).
**** Associate Chief, Research and Evaluation, Prevention Communication Branch, Division of HIV/AIDS Prevention, Center
The reality of cancer, however, does not always match public or individual percep-tion of the disease. Research on illness representapercep-tions, for example, has demonstrated that people ‘‘formulate their own representation of illness’’ by prescribing different fre-quencies, causes, features, and timelines to the disease based on their cultural, social, and personal experiences (Orbell et al., 2008). This helps explain why actual cancer risk and perceived cancer risk are often different; that is, people frequently miscalcu-late the likelihood that they will contract a certain type of cancer or cancer in general (Leventhal, Kelly, & Leventhal, 1999). Illness representation also may play a role in other perceptual contradictions, such as the observation that 75% of Americans feel that ‘‘there are so many different recommendations about preventing cancer, it’s hard to know which ones to follow’’ (Arora et al., 2007, p. 224) juxtaposed with the reality that as much as 50% of cancer cases largely are attributable to just three modifiable beha-viors (smoking, diet, and exercise; Colditz & Hunter, 2004; Stein & Colditz, 2004).
In light of these contradictions, health communication researchers have sought to identify factors that might contribute to distortions between the reality of cancer and public perception of the disease. One source with the potential to distort perception of cancer is news coverage. Cancer is an increasingly popular topic in the news (Viswanath, 2005), and research suggests that some Americans pay close attention to this type of coverage (Roper Starch Worldwide, 1997; Viswanath et al., 2006). As a key source of information, news stories have the potential to shape illness representations of cancer at both the individual and public level. For example, if a rare type of cancer frequently is depicted in the news, then news consumers may decide that it is commonplace, or a multitude of stories about cancer treatment might discourage thinking about cancer prevention (i.e., depict cancer as unavoidable).
To understand the potential influence of news stories on illness representations, researchers have carried out several content analyses of cancer news coverage. This work generally has shown that cancer news coverage mirrors incidence rates rather than mortality rates; however, certain cancers (e.g., breast cancer) disproportionately are represented regardless of the comparison data (Cohen et al., 2008; Hoffman-Goetz & Friedman, 2005; Slater, Long, Bettinghaus, & Reineke, 2008).
Cancer news coverage also focuses heavily on treatment (Slater et al., 2008), depicts environment and lifestyle as primary cancer risk factors (Freimuth, Greenberg, DeWitt, & Romano, 1984; Greenberg, Freimuth, & Bratic, 1979), and typically is void of basic numerical information (e.g., incidence data; Freimuth et al., 1984; Greenberg et al., 1979).
The present study is a content analysis of cancer news stories (N¼5,327) in the top 50 U.S. newspapers based on circulation rates. Coded variables include cancer site, story topic, cancer risk factors, and presence of cancer statistics. The particular focus of this study is to compare datasets across time. Several comprehensive content analy-ses were carried out almost 30 years ago, and the goal of this analysis is to examine possible trends in cancer coverage. This is important not only as a means of validating current research findings by revealing consistent distortions, but also as way of mapping another aspect of illness representation, namely, how things change over time. Changes
in coverage may explain perceptual changes just as norms of the past may influence interpretations of the present. Given the potential importance of news coverage in the formation of illness representations, it is essential for health communication researchers to fully map cancer news coverage patterns. Only then could this information be used to change or counter distorted messages in the media.
Content analyses of cancer news coverage
Comprehensive content analyses of cancer news coverage have been rare; that is, resear-chers routinely have focused on a single cancer site (e.g., news coverage of skin cancer) rather than all cancer sites. This is unfortunate, as comprehensive analyses allow rese-archers to more readily observe distortions between coverage trends and actual cancer trends.
In the first comprehensive content analysis of cancer new coverage, Greenberg, Freimuth, and Bratic (1979) analyzed 2,138 cancer news articles published in 1977 in the top 49 circulating newspapers. A news clipping service, Burrelle’s, provided the researchers with the sample. The news clipping service selected articles from 3 months (August, September, and October) representing 6 composite weeks.
Burrelle’s was instructed to collect articles that mentioned any of the following key words: cancer, carcinogens, tumor, lump, malignant, and terminal illness. Content analysis of the sample revealed that breast cancer was the most frequently mentio-ned cancer site (11.0%), followed by lung (7.8%), bladder/kidney (6.8%), bone/muscle (5.5%), and blood/leukemia (5.0%). Several interreality distortions also were identi-fied; that is, news coverage patterns deviated from actual cancer rates. For example, colon cancer was seventh in coverage despite the fact that it was the most common cancer of the time. In total, seven cancers were underrepresented (colon, female repro-ductive, male reprorepro-ductive, head/neck, lymphatic/Hodgkin’s, stomach/pancreatic, and thyroid), four cancers were overrepresented (breast, bladder/kidney, blood/leukemia, and bone/muscle), and two cancers were reported proportionate to their incidence rates (lung and skin). News stories also disproportionately were focused on treatment as compared with prevention, detection, and coping and generally void of cancer statistics (e.g., incidence data). Environmental factors (e.g., water pollution) and lifestyle choices (e.g., smoking, diet) were the most frequently mentioned risk factors, accounting for roughly 85% of all mentions.
The next comprehensive content analysis of cancer news coverage examined 1,466 cancer news articles published in 1980 in the top 49 circulating newspapers (Freimuth et al., 1984). The sample was once again collected by Burrelle’s using the same sampling time frame and key words described above. Content analysis of the sample revealed that lung cancer was the most frequently mentioned cancer (10.7%), followed by breast (6.6%) and female reproductive (4.9%) cancer. Compared with incidence data, two cancers were underrepresented (colon and male reproductive), two cancers were overre-presented (breast and female reproductive), and one cancer was reported proportionate to its incidence rate (lung). Cancer treatment remained the dominant story topic, cancer
statistics still rarely were reported, and environmental factors and lifestyle choices were once again the most frequently mentioned risk factors.
Twenty years passed before another comprehensive content analysis was carried out. Hoffman-Goetz and Friedman (2005) conducted a comprehensive content analysis of Canadian newspaper coverage, coding 748 cancer news articles published in the year 2000. Their sample consisted of seven mainstream and 25 ethnic newspapers. They found that news coverage tended to focus on cancers with a ‘‘strong genetic compo-nent,’’ most notably cancers of the breast (p. 336). The five most mentioned cancers in mainstream newspapers were breast (20.1%), prostate (8.6%), leukemia= lymphoma (4.0%), colon (3.9%), and lung (3.9%).
Slater, Long, Bettinghaus, and Reineke (2008) recently carried out a large-scale content analysis, coding newspapers (n¼706), news magazines (n¼59), and televi-sion newscasts (n¼83) across all regions of the United States for the years 2002-2003. Breast cancer was once again the most frequently mentioned cancer site (across all three media). In newspapers, the five cancer cites mentioned the most (in order) where breast (29.6%), colon (11.3%), prostate (9.6%), lung (8.7%), and brain (7.0%). Several inter-reality distortions were identified as well. Using incidence rates as a comparison, Slater et al. (2008) found that breast, colon, brain, leukemia, cervical, and liver cancer were all overrepresented in newspaper coverage. Prostate, lung, and lymphoma were found to be underreported in newspapers. When mortality rates were used as a comparison, breast, prostate, brain, leukemia, pharyngeal, and cervical cancer were found to be overrepresented and lung, lymphoma, and pancreatic cancer were found to be under-represented in newspaper coverage. Consistent with past content analyses, treatment was the most frequent story topic in newspapers as well as the second most frequent in magazines and on television. Not only were prevention and detection rarely the focus of cancer stories, but Slater and colleagues also noted that it was odd that cancers with established prevention and detection components (e.g., skin, cervical, lung, colon) did not receive more coverage than those where such information is less certain (e.g., breast, prostate).
Finally, Cohen and colleagues (2008) coded 5,206 cancer news articles from 2004-2005. Their sample consisted of 23 weekly Black newspapers and 12 daily general--audience newspapers. They found that breast cancer was the most frequently covered cancer in both Black (mentioned in 28.9% of stories) and general audience newspapers (mentioned in 21.1% of stories). Rounding out the top five in general audience newspa-pers were prostate (10.0%), colon and rectum (6.1%), lung and bronchus (4.6%), and melanoma (2.7%).
Existing research provides a deep understanding of two time windows (i.e., the late 1970s and the early 2000s), but no content analysis to date has attempted to bridge these studies. The current study replicates and extends current work (e.g., Cohen et al., 2008; Slater et al., 2008) as well as links back to the original comprehensive content analyses by using a comparable content scheme. This approach may reveal trends that ultimately contribute to individual or societal illness representations (e.g., about cancer risk factors).
The original comprehensive content analyses focused on several aspects of cancer news coverage reporting. Certain cancer cites were found to be covered disproportio-nate to their actual incidence and mortality rates, a phenomenon that has come to be known as interreality distortion.
• RQ1: How do interreality distortions in the present study compare with previou-sly observed interreality distortions?
Cancer treatment was found to be the most common story topic, despite the fact that other aspects of the cancer continuum1 (e.g., prevention, detection) were equally important in cancer control.
• RQ2: How do story topic distortions in the present study compare with previou-sly observed story topic distortions?
Environmental and lifestyle were mentioned more frequently than other risk factors in news coverage.
• RQ3: How does the reporting of cancer risk factors in the present study compare with past reporting of cancer risk factors?
News coverage generally was devoid of cancer statistics, including incidence and mortality rates. One reason that interreality cancer distortions are so problematic is that they have the potential to produce inaccurate perceptions of cancer risks.
Hence, identifying and reducing interreality distortions is coupled with a desire to increase the number of stories that include information on cancer incidence.
• RQ4: How does the reporting of cancer statistics in the present study compare with past reporting of cancer statistics?
Underlying causes of cancer news coverage distortions
Past content analyses consistently have found that cancer news coverage is dispropor-tionately focused on breast cancer. The superior organization of the breast cancer com-munity partially may explain this finding (Slater et al., 2008), but researchers have speculated that news norms could play a role as well. Bennett (2007) argued that four journalistic biases consistently distort news content: personalization, dramatization, normalization, and fragmentation. Although Bennett identified these biases in the
con-1 Within the cancer research community, cancer is often discussed in terms of a ‘‘cancer continuum.’’ The continuum
represents the cancer process from beginning to end, starting with prevention and moving forward to detection, treatment, survivorship, and end-of life care (e.g., National Cancer Institute, 2007). The purpose of the cancer continuum is to help researchers organize their efforts and to draw attention to the fact that cancer care is often disproportionately treatment focused.
text of political news, he believed that all four had the potential to impact other issues as well by obscuring citizens’ ability to see the ‘‘big picture’’ (p. 37).
Of the four biases outlined by Bennett, personalization seems to be the most plau-sible cause of cancer news coverage distortions. Personalization refers to the tendency of news media to focus on human interest. Human interest stories favor personal or local angles that stress individuals rather than causes and effects. Bennett (2007) noted that human interest stories frequently ‘‘focus on attractive . . . personalities,’’ which ‘‘encourages a passive attitude among a public inclined to let those personalities do their thinking and acting for them’’ (pp. 39-40). In the context of cancer news coverage, media professionals routinely use ‘‘attractive personalities’’ as the story focus or hook; for example, past research has found that celebrity cancer cases tend to generate consi-derable news coverage (Chapman, McLeod, Wakefield, & Holding, 2005; Cram et al., 2003).
One problem with a celebrity or personality-driven model of news coverage is that it has the potential to significantly distort the amount of attention devoted to a specific (and completely random) type of cancer. That is, news coverage comes to reflect arbi-trary instances rather than underlying trends. It is also possible; however, that celebrity cancer coverage may serve to counter existing imbalances in coverage. There is some evidence (both research and anecdotal) that celebrities in and around the media leverage random cancer instances to raise awareness of lesser known but very common cancers. Indeed, Katie Couric transformed the tragic loss of her husband to colon cancer into a media event (i.e., Couric had a colonoscopy on live television) to increase public kno-wledge and awareness of colon cancer (Cram et al., 2003). Couric increased awareness not only with her personal behavior, but also by encouraging other media professionals (both national and regional) to engage in the same behavior. Thus, personalization bias, as represented by celebrity cancer stories, is a complicated phenomenon that seems to be capable of distorting and balancing cancer depictions.
Human interest stories, however, are not always about celebrities (or even specific people). Human interest stories are often about local or regional events (i.e., personali-zed to the media audience). Past research has found that interest groups often use their resources to ‘‘frame’’ news stories in favorable ways (Bennett, 2007). Of course, the most important frame for cancer-specific interests groups is one that focuses attention on their issue (e.g., a story about breast cancer research rather than health research in general). There are several ways that interest groups can increase issue-specific news coverage (e.g., helping legislation get passed), but some of the most frequently employed techniques are hosting local awareness or fundraiser events (Bennett, 2007). Such events draw consistent news coverage because they are (a) easy to cover and (b) prepackaged with a personal=local hook. The problem is that certain cancers have a stronger support base than others; for instance, Slater and colleagues (2008) recently argued that suc-cessful lobbying efforts may partly explain imbalances in news coverage. Some cancer lobbies (e.g., breast cancer) may be more adept than others at mobilizing support and interest in their cause; as a result, certain cancers receive consistent news coverage, whe-reas others do not. Consistent with this idea, Cohen and colleagues (2008) found that
stories about overrepresented cancers (e.g., breast, prostate) are more likely to contain localized information. So, whether it is celebrity instance or local events, one possible explanation for interreality cancer distortion is personalization bias.
• RQ5: Is there evidence that interreality distortions are caused by personalization bias? For example, are overrepresented cancers more likely to be present in sto-ries about famous people, events, or fundraisers?
Method
Sample
Data for this study were drawn from a comprehensive analysis of cancer news coverage in the top 50 circulating U.S. newspapers for the year 2003. Stories containing at least a minimal amount of cancer information (N=5,327) were identified by a rigorously
validated search term2. Relevant stories were sampled from the top 50 newspapers in
the United States, based upon circulation data, available through Lexis-Nexis. A total of 44 newspapers were used, as six of the newspapers did not post a relevant story during the time frame of the interest.
Variables
Incidence of Cancer. Cancer incidence data for 2003 were obtained from the U.S. Cancer Statistics Working Group (U.S. Cancer Statistics Working Group, 2007). Type of cancer. Coders first determined whether any specific types of cancer were men-tioned; if yes, coders identified all cancer types discussed in the story. Cancer sites inclu-ded cancers of the male reproductive system, breast, lung, colon/rectum, bladder, female reproductive system, lymphatic system and non-Hodgkin’s lymphoma, skin, leukemia/ blood, stomach, pancreas, kidney, brain, thyroid, bone/muscle, and other (coders indi-cated the specific ‘‘other’’ cancer). Childhood cancers not specified were not coded as a type of cancer.
Story topic. Coders noted whether a story had cancer prevention, detection, treatment, survivorship, or end of life as a major topic=theme. The aforementioned story topics are the main aspects of the cancer continuum (see National Cancer Institute, 2007). Cancer risk factors. A cancer risk factor is any aspect of life that can modify the risk of developing cancer. Coders identified whether an article mentioned any of five cancer risk factors: lifestyle, environmental or occupational, demographic, medical, or
gene-2 The search incorporated measures of recall and precision to estimate reliability and validity. Stated briefly, researchers
constructed an initial Lexis-Nexis search term and then modified it based a series of trial runs. During the runs, researchers coded a small sample of articles retrieved by versions of the search term to calculate how many were ‘‘valid’’ stories. This data were used to improve the term until an optimal search term had been constructed (for a further description of the search term, see Stryker, Wray, Hornik, & Yanovitzky, 2006). The full search term as well as a list of the newspapers included in the study are available at the lead author’s website: http://web.ics.purdue.edu/~jdjensen/
tic/hereditary. If a coder identified one of these factors as present in the article, then a second level of coding was carried out. Lifestyle cancer risks included alcohol consump-tion, tobacco use, exercise, diet/nutriconsump-tion, sexual activity, tanning/sun exposure, obe-sity, and cell phone use. Environmental/occupational cancer risks included air or water pollutants (e.g., radon), pesticides/chemicals, and occupational hazards (e.g., asbestos). Demographic risk factors included gender, race, age, and socioeconomic status (SES). Medical risk factors included medications that increase/reduce risk, surgery to prevent initial occurrence of disease (e.g., mastectomy for women with breast cancer gene), and viruses/infections (e.g., HPV). Genetic/heredity risk was not subdivided into additional categories.
Profile of a person with cancer. Coders identified whether the article was about a profile of a person with cancer; that is, a story focused on a single person’s cancer experience. If the story was a profile of a person with cancer, then coders noted whether the person was (a) not famous or (b) famous. Concerning the latter, ‘‘famous’’ referred to anyone known to a large number of people on a national or local level (e.g., an athlete, politi-cian, entertainer, etc.).
Cancer activities and resources. Activities and resources related to cancer were classi-fied by identifying whether the topic of the story involved a cancer fundraiser, benefit, or event (e.g., a breast cancer walk or an American Cancer Society benefit).
Cancer statistics. Any mentions of the chances of developing a cancer (verbal or nume-ric) based on past exposures or on membership in a population group were coded as mentions of cancer-related incidence. Any mentions of the chances of dying from cancer were coded as mentions of cancer-related mortality.
Intercoder reliability
Four coders reviewed stories that were entered into a database for random selection. Using stories published in 2002 and 2004, coders received approximately 90 hours of training over 4 months prior to establishing intercoder reliability. Reliability was rechecked every 3 months during actual coding. Tests were conducted on samples of approximately 150 stories from mainstream newspapers appearing in the months adja-cent to the study period. Disagreements among coders during the interrater reliability process were resolved by discussing the differences amongst coders, changing the coding manual, and retesting reliability using the updated manual. This iterative process conti-nued until coders reached acceptable reliability.
Reliability was computed using Krippendorff’s alpha (Krippendorff, 2004). For the full dataset, Krippendorff’s alpha for each variable was within the range 0.70 to 0.89 (M¼.83), averaged across reliability checks for that specific variable.
Results
RQ1: Interreality comparisons
The most frequently mentioned cancers in 2003 newspaper articles were breast (26.0%), lung (11.3%), male reproductive (10.4%), colon (8.5%), blood/leukemia (8.1%), female reproductive (6.0%), skin (5.1%), and head/neck (5.0%). All other cancers were mentioned in less than three percent of news articles.
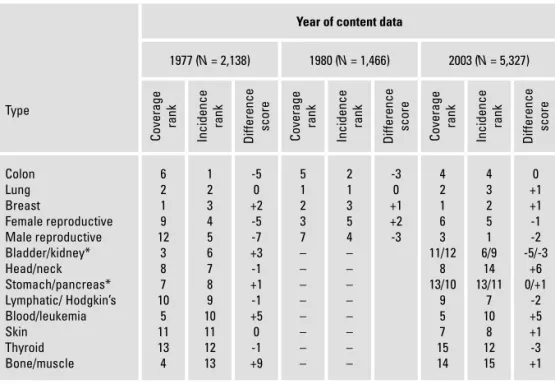
The first research question considered whether interreality distortions had chan-ged over time. To answer this question, data from the first two comprehensive content analyses of cancer news coverage (Freimuth et al., 1984; Greenberg et al., 1979) were compared with the current data (see Table 1)3. The comparison revealed that three can-cers consistently have been underrepresented (male reproductive, lymphatic/Hodgkin’s, and thyroid), four cancers have been consistently overrepresented (breast4, blood/leu-kemia, pancreatic, and bone/muscle5), and two cancers have remained relatively stable (lung and stomach).
The comparison also revealed a positive shift in colon cancer coverage. Cólon cancer was originally identified as a significantly underrepresented cancer in 1977. By 1980, the interreality distortion between colon cancer coverage and incidence had decreased by half. In the present data, colon cancer is covered identical to its incidence rate. A closer examination of coverage and incidence ranks reveals that two factors seem to contribute to the significant improvement of colon cancer coverage. First, colon cancer coverage increased substantially from 1977 to 2003. Second, colon cancer incidence decreased (in rank) over that same time period.
3 The comparison was not perfect, as different data reporting practices and content analytic schemesmade the datasets
somewhat inconsistent. The 1977 data included an ‘‘other cancers’’ category that altered the coverage rankings (and hence the discrepancy scores). The published 1980 data was incomplete (i.e., the fourth and sixth most covered cancers were not identified) and only included information for five cancers. The 2003 data separated some cancers that previously were grouped together. To make the datasets more comparable, some cancer categories were cut from 1977 (i.e., the other cancer category) and a few cancers were combined in 2003 (e.g., bladder/ kidney). Even with all these differences, several patterns were identified upon comparison.
4 Breast cancer consistently has been one of the most covered cancers; for example, roughly one in four cancer news articles
in 2003 mentioned breast cancer. Of course, breast cancer is also a very common form of cancer, so the breast cancer distortion has been relatively small over time. This should not mask the reality that breast cancer is substantially more likely to be reported than other types of cancer.
5 Bone/muscle cancer coverage is somewhat difficult to interpret. In 1977, bone=muscle cancer had a difference score of
plus nine. In 2003, the difference score was considerably smaller; however, readers should interpret the second number with some caution. Bone/muscle cancer is very rare and it can be difficult tomeaningfully distinguish the incidence rates of rare cancers (i.e., because of a floor effect).We chose to label bone/muscle cancer as fifteenth in incidence (because that is the total number of cancers we coded for), but it actually is one of several cancers that occurred with extremely limited frequency in 2003. The news coverage rank is different. Bone/ muscle cancer was, in fact, the fourteenth most reported cancer in 2003. So, for bone/muscle cancer, the distance between coverage and incidence rank is somewhat subjective. A case could be made that bone/muscle cancer was, for example, twenty-fourth in incidence. But that number would signifi-cantly inflate the difference score, disguising the fact that cancers ranking fifteenth to twenty-fourth in incidence are all very rare. Regardless of how one calculates bone/muscle cancer incidence, that cancer site consistently has been overreported in the news.
Table 1. Interreality comparisons of cancer news coverage and incidence of cancer, by year
Type
Year of content data
1977 (N = 2,138) 1980 (N = 1,466) 2003 (N = 5,327) Coverage rank Incidence rank Difference score Coverage rank Incidence rank Difference score Coverage rank Incidence rank Difference score Colon Lung Breast Female reproductive Male reproductive Bladder/kidney* Head/neck Stomach/pancreas* Lymphatic/ Hodgkin’s Blood/leukemia Skin Thyroid Bone/muscle 6 2 1 9 12 3 8 7 10 5 11 13 4 1 2 3 4 5 6 7 8 9 10 11 12 13 -5 0 +2 -5 -7 +3 -1 +1 -1 +5 0 -1 +9 5 1 2 3 7 – – – – – – – – 2 1 3 5 4 – – – – – – – – -3 0 +1 +2 -3 4 2 1 6 3 11/12 8 13/10 9 5 7 15 14 4 3 2 5 1 6/9 14 13/11 7 10 8 12 15 0 +1 +1 -1 -2 -5/-3 +6 0/+1 -2 +5 +1 -3 +1
Note: N = the number of valid news stories. Coverage data were not available for all
cancers in 1980. Specific cancers were counted in this analysis if they were mentioned at all (i.e., they did not have to be the major theme or topic). A story could mention more than one type of cancer.
Coverage rank = A hierarchical score conveying frequency of mention in the news, from most frequent (1) to least frequent (15).
Incidence rank = A hierarchical score conveying the number of new cases each year, from most new cases (1) to least new cases (15).
Difference Score = A score reflecting the difference between coverage and incidence rank; positive scores mean that a cancer was depicted more frequently in the news than it actually occurred.
* Some cancers were combined in 1977, but separated in 2003. For example, in 2003, bladder cancer was eleventh in coverage and sixth in incidence, whereas kidney cancer was twelfth in coverage and nineth in incidence.
RQ2: Story topic distortion
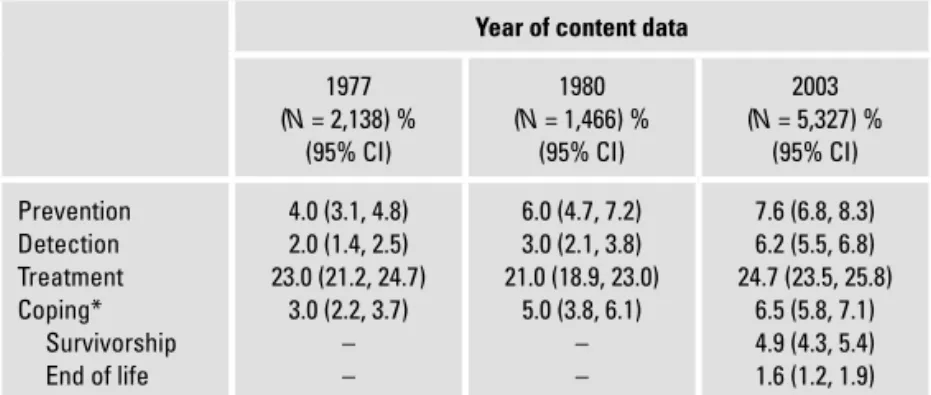
Research question two considered whether story topic distortions had changed over time. Past content analyses found that cancer news coverage tended to focus heavily on treatment. In 2003, treatment was still far more common than other aspects of the cancer continuum (see Table 2). Prevention, detection, and coping were rarely discus-sed, although detection coverage is statistically more common in 2003 than in the past.
Table 2. Percentage of stories with cancer continuum components as a major topic/theme, by year
Year of content data
1977 (N = 2,138) % (95% CI) 1980 (N = 1,466) % (95% CI) 2003 (N = 5,327) % (95% CI) Prevention Detection Treatment Coping* Survivorship End of life 4.0 (3.1, 4.8) 2.0 (1.4, 2.5) 23.0 (21.2, 24.7) 3.0 (2.2, 3.7) – – 6.0 (4.7, 7.2) 3.0 (2.1, 3.8) 21.0 (18.9, 23.0) 5.0 (3.8, 6.1) – – 7.6 (6.8, 8.3) 6.2 (5.5, 6.8) 24.7 (23.5, 25.8) 6.5 (5.8, 7.1) 4.9 (4.3, 5.4) 1.6 (1.2, 1.9)
Note: Cancer continuum components had to be a major topic/theme
of the article to be included in this count.
* In 1977/1980, researchers coded for “coping”. Coping is now thought of as an aspect of several parts of the cancer continuum, includ-ing survivorship and end of life care. The present study aggregated survi-vorship and end of life to form a “coping” variable. Survisurvi-vorship and end of life are also reported separately to allow readers to interpret the data as they see best.
RQ3: Reporting of cancer risk factors
Research question three considered how the reporting of cancer risk factors had chan-ged over time. In 1977, 27.3% (CI: 25.1, 28.8) of news stories mentioned a cancer risk factor. By 1980, that number had risen to 47.0% (CI: 44.4, 49.5). In 2003, the number was back down again as only 28.1% (CI: 26.7, 29.2) of news stories mentioned a cancer risk.
It is also interesting to examine the type of cancer risk factor mentioned. Unfortunately, this information was not completely reported for the 1977 or 1980 content analyses. Freimuth and colleagues (1984) offered the following description of the datasets:
In 1980, over one-half (55 percent) of the articles addressing risk factors mentioned the environment. A person’s lifestyle was the next most frequently mentioned risk factor (41per-cent). Physical or psychological makeup, genetic factors, and race or ethnic origin received little mention.
In the 1977 sample, environment and lifestyle accounted for 85 percent of the stories about risk factors. Genetic and heredity factors accounted for most of the remainder. (p. 68)
In other words, environment and lifestyle choices were the two most frequently men-tioned risk factors in 1977 and 1980.
Freimuth and colleagues (1984) reported the percentage of risk factor stories that included a specific risk factor (e.g., 55% of articles addressing risk factors mentioned the environment). To maximize comparability of data, we also report the percentage
of risk factor stories (n=1,498) that mentioned a specific risk factor6. In 2003, lifestyle was the most frequently mentioned risk factor (45.9%; CI: 42.4, 47.5), followed by demographics (39.5%; CI: 36.5, 41.4), genetic/heredity (22.3%; CI: 19.9, 24.1), envi-ronmental/occupational (22.2%; CI: 19.9, 24.1), and medical (18.8%; CI: 16.0, 19.9). Thus, lifestyle continues to be a frequently mentioned risk factor, whereas environmen-tal/occupational risk coverage appears to have declined dramatically.
RQ4: Reporting of cancer statistics
Research question four considered how the reporting of cancer statistics had changed over time. Past content analyses found that incidence data rarely was reported in cancer news coverage. In 1977 and 1980, 18.4% (CI: 16.3, 19.6) and 17.0% (CI: 15.0, 18.9) of news stories included incidence data. The present study coded for both incidence (the chance of developing a type of cancer) and mortality data (the chance of dying from a type of cancer). Roughly one in four new stories included incidence data in 2003 (26.9%; CI: 25.8, 28.1), which represents a small but significant increase. Morbidity data were less common, appearing in about one in 20 news stories in 2003 (6.1%; CI: 5.4, 6.7). Unfortunately, morbidity data were not coded in 1977 or 1980, so compari-sons across time are not possible.
RQ5: Personalization bias
Research question five considered whether personalization bias might explain inter-reality cancer distortions. Two types of coverage might reflect a personalization bias: stories about people with cancer or cancer events.
Past content analyses found that celebrity profiles were a common type of cancer news; albeit one that seemed to be declining in frequency. In 1977, 26.0% (CI: 24.1, 27.8) of news stories were about a celebrity with cancer. By 1980, that number had dropped to 16.0% (CI: 14.1, 17.8). The present study coded for profiles of famous and nonfamous people with cancer. Famous (10.7%; CI: 9.9, 11.5) and nonfamous profiles (11.7%; CI: 10.7, 12.3) were equally likely and mentioned in roughly one in 10 stories each. Thus, profiles were still common in 2003, but celebrity coverage was less frequent than in the past.
The frequency of profile stories over time is interesting, but the present study is more concerned with how profile coverage might be related to interreality cancer distortions. Table 3 depicts the percentage of profile cancer stories that mentioned each type of cancer. The three most frequently mentioned cancers in celebrity news stories were male reproductive, breast, lung, and head/neck. Of these, all but male reproductive cancer were overrepresented in 2003 news coverage (and male reproductive cancer coverage seemed to be increasing over time). The most frequently mentioned cancers in news articles about nonfamous people were breast, blood/leukemia, and head/neck. All three of these cancers were overrepresented in cancer news coverage.
6 Some readers may be interested in the percentage of all stories (n=5,327) that included a specific cancer risk factor (to
help visualize the data): lifestyle (11.7%), demographics (10.0%), genetic/heredity (5.7%), environmental/occupational (5.6%), and medical (4.8%).
Another type of coverage that may reveal personalization bias is news stories about cancer events. In the present study, event coverage was more common (12.0%; CI: 11.1, 12.8) than in 1980 (5.0%; CI 4.0, 5.9) or 1977 (7.0%; CI: 5.6, 8.3). Table 3 depicts the percentage of news articles about events that mentioned a specific type of cancer. Breast and blood/leukemia cancer were most frequently mentioned in event coverage. Roughly half of all event articles made reference to one or both cancers.
Table 3. Percentage of 2003 stories about profiles of people or cancer events by cancer site
Percent of profi le stories mentioning type of cancer
Percent of event coverage mentioning type of cancer Famous (Nf = 572) % (95% CI) Not famous (Np = 617) % (95% CI) Event coverage (Ne = 640) % (95% CI) Male reproductive Breast Lung Colon Female reproductive Bladder Lymphatic/Hodgkin’s Skin Kidney Blood/Leukemia Pancreas Thyroid Stomach Head/neck Bone/muscle Other 19.9 (16.7, 23.2) 16.0 (13.0, 19.0) 13.9 (11.1, 16.8) 4.5 (2.8, 4.5) 1.9 (0.7, 3.0) 5.4 (3.5, 7.2) 3.1 (1.6, 4.5) 5.0 (3.2, 6.7) 2.6 (1.3, 3.9) 5.4 (3.5, 7.2) 1.5 (0.5, 2.5) 2.6 (1.3, 3.9) 0.8 (0.0, 1.6) 13.1 (10.2, 15.7) 1.0 (0.1, 1.8) 20.7 (16.7, 23.2) 4.3 (2.7, 5.9) 24.4 (21.6, 27.3) 6.9 (4.9, 8.9) 5.5 (3.7, 7.3) 6.1 (4.1, 7.8) 0.4 (-0.5, 1.3) 3.8 (2.2, 5.3) 3.7 (2.2, 5.1) 1.6 (0.6, 2.5) 17.9 (15.0, 21,1) 2.2 (1.0, 3.3) 1.1 (0.2, 1.9) 1.6 (0.6, 2.5) 9.5 (7.1, 11.8) 2.7 (1.4, 3.9) 25.0 (21.5, 28.4) 7.0 (5.0, 8.9) 36.0 (32.2, 39.7) 4.2 (2.6, 5.7) 3.2 (1.8, 4.5) 6.5 (4.5, 8.4) 0.1 (-0.8, 0.9) 3.1 (1.7, 4.4) 2.5 (1.2, 3.7) 0.6 (-0.3, 1.5) 13.1 (10.3, 15.6) 1.0 (0.2, 1.7) 0.4 (-0.4, 1.2) 0.3 (-0.6, 1.1) 3.9 (2.4, 5.4) 1.0 (0.2, 1.7) 12.1 (9.4, 14.5)
Note: Cancers are listed vertically by incidence rates (most frequent
first). Nf = the number of news stories about famous people with cancer.
Np = the number of news stories about nonfamous people with cancer.
Ne = the number of stories that were about cancer fundraisers or events. Specific cancers were counted in this analysis if they were mentioned at all (i.e., they did not have to be a major topic/theme). A story could mention more than one type of cancer.
Discussion
The present study quantified newspaper coverage of cancer and compared similar stu-dies over time. Several patterns emerged with the potential to shape illness representa-tions of cancer. Breast cancer was found to be the most covered cancer site, a result that now has been replicated in all but one comprehensive content analysis from 1977 to 2005 (in 1980, breast cancer was second). Roughly one in four cancer stories
mentio-ned breast cancer, a higher proportion than observed in the original studies (i.e., 1977, 1980) but consistent with more recent content analyses (i.e., 2000-2005). On a similar note, breast cancer once again was found to be overrepresented compared with its inci-dence rate, a finding that has been documented in every study that has looked for such distortion.
Researchers have suggested in the past that the organization and activity of the breast cancer community may at least partially explain breast cancer coverage patterns. The present study directly addressed this issue by coding for personalization bias in cer coverage. As expected, a sizeable portion of profiles of people with cancer and can-cer events were devoted to breast cancan-cer. A closer examination of the data suggests that breast cancer is mentioned in a high number of profile stories about nonfamous people with cancer and in a substantial proportion of stories about cancer events. A similar pattern emerged for another overrepresented cancer that has a very strong community: blood/leukemia. The data correspond to a media advocacy explanation; in other words, stories about nonfamous people with a type of cancer and cancer events are both topics that may be heavily publicized by cancer organizations in an effort to increase awa-reness. On the opposite end of the spectrum, bladder cancer (the sixth most common cancer) is mentioned in almost no profiles of nonfamous people or event coverage. The only personalized coverage bladder cancer received with any frequency was celebrity profile stories, which are the most random of the three. Not surprisingly, bladder cancer was found to be significantly underrepresented in the news.
Of course, the breast and blood/leukemia cancer communities are not to be bla-med for news coverage distortions. The efforts of both communities are to be admired. Indeed, another way to contextualize these findings is to compare coverage of the five most common cancers over time (breast, colon, lung, female reproductive, and male reproductive), the logic being that the five most common cancers should be the five most covered cancers. Across six comprehensive content analyses (Cohen et al.,2008; Freimuth et al., 1984; Greenberg et al., 1979; Hoffman-Goetz & Friedman, 2005; Slater et al., 2008), only breast and lung cancer consistently have been in the top five most frequently mentioned cancers. Male reproductive and colon cancer, however, have been in the top five most frequently mentioned cancers in the last four content analyses (spanning the years 2000-2005). In other words, only one of the five most common cancers remains suspiciously absent from news coverage: female reproductive cancer. The only time female reproductive cancer was in the top five most mentioned cancers was in 1980 (it was third). Thus, researchers should attempt to identify why female reproductive cancer consistently has been underreported and, just as important, what can be done about it.
Another consistent finding was that cancer news coverage has focused heavily on cancer treatment and devoted very little attention to prevention, detection, or coping. Treatment-focused reporting has been a stable feature of cancer news coverage over the years and one that may cultivate the belief that cancer is something to be reacted to rather than prevented (for similar conclusions, see Slater et al., 2008). Increasing pre-vention, detection, and coping stories may require innovative narrative frameworks for
discussing aspects of cancer unrelated to treatment. That is, journalists may well favor treatment-focused stories only because they have qualities that make them desirable (e.g., drama). Identifying ways to package nontreatment stories in ways that satisfy journalists and audiences might help to balance reporting of the cancer continuum.
The reporting of cancer risk factors was problematic as well. The most common can-cer risk factor mentioned in the news was lifestyle (e.g., diet, exercise). In fact, lifestyle consistently has been depicted in the news as a major cancer risk factor. This coverage pattern corresponds nicely with cancer prevention research, as current research sug-gests that as much as 50% of cancer cases are largely attributable to just three lifestyle choices (smoking, diet, and exercise; Colditz & Hunter, 2004; Stein & Colditz, 2004). Unfortunately, few stories mention cancer risk factors (roughly one in four), so news consumers easily could miss this important piece of information.
On a related note, the number of stories mentioning cancer risk factors dramatically rose from 27% in 1977 to 47% in 1980 and then fell back down to 28% in 2003. It is possible that 1980 is an anomaly, or this could be a by product of sample size (1980 content analysis had the smallest sample and thus could be less reliable). It is also worthwhile to consider other explanations, however, for this dramatic increase in cancer risk factor coverage. Rushefsky (1986) has argued that 1977-1980 was a pivotal moment in cancer policy history. During that time, President Carter’s administration issued ‘‘numerous cancer risk assessment guidelines’’ and attempted to revamp environ-mental policy as well as the War on Cancer (Rushefsky, pp. 62-63). A crucial turning point in cancer policy was marked in 1980 with the election of President Reagan and subsequent deregulation of many government sectors. Therefore, it is possible that can-cer reporting was markedly different in 1980 (perhaps as a response to deregulation) compared with 1977 and 2003. Rushefsky (1986) noted that cancer policy and hence cancer dialogue tends to shift with administration changes, a reality that future content analyses of cancer news coverage will want to consider.
Cultivating accurate illness representations may require the consistent communi-cation of actual cancer statistics (see, e.g., Schwartz, Woloshin, & Welch, 1999). Past studies have found that incidence data rarely are reported in cancer news coverage.
The present study found that incidence and mortality data still rarely are mentio-ned in cancer news stories. The absence of cancer statistics in cancer news is likely a by product of the streamlining process, whereby journalists cut scientific content that is deemed lexically challenging to the audience (Jensen, 2008). If true, then change may come only as journalists are better trained to appreciate aspects of science central to effective communication. The present study has several limitations that need to be acknowledged. Comparisons among three datasets are rarely perfect and often require compromises.
That was certainly the case in the present study where a gap of 26 years separated the first study from the last. For example, content analytic practices have changed conside-rably since the late seventies, and reporting norms have changed as well. To compensate for differences in the data, we tried to look only at the big picture over time. In other words, we looked for trends that were consistent across all available years or that were
unusual in magnitude. A second limitation of the study is that only newspaper coverage was considered. Slater and colleagues (2008) found differences across newspaper, maga-zine, and television coverage, suggesting that additional content analytic research may be necessary to fully understand cancer news coverage patterns. Finally, chance may explain some of the differences observed in this study. For example, certain cancers may have received unusually high or low amounts of coverage in 1977, 1980, or 2003; thus, the present study is vulnerable to random bias that could create the illusion of trends.
Limitations aside, the present study provided a snapshot of cancer news coverage and a comparison of how coverage has changed (or not changed) since 1977. What is not clear is whether cancer coverage patterns do alter news consumers’ perceptions and behaviors. This research has the potential to significantly inform our understanding of cancer communication and control, especially in light of encouraging recent findings suggesting links between media usage and cancer prevention and detection (Geiger et al., 2008; Stryker, Moriarty, & Jensen, 2008).
References
Arora, N. K.; Hesse, B. W.; Rimer, B. K.; Viswanath, K.; Clayman, M. L. & Croyle, R. T. (2007). Frustrated and confused: The American public rates its cancer-related information-seeking experiences. Journal of
General Internal Medicine, 23, 233-238.
Bennett, W. L. (2007). News: The Politics of Illusion. White Plains, NY: Longman.
Chapman, S.; McLeod, K.; Wakefield, M. & Holding, S. (2005). Impact of news of celebrity illness on breast cancer screening: Kylie Minogue’s breast cancer diagnosis. The Medical Journal of Australia, 7, 1-4. Cohen, E. L.; Caburnay, C. A.; Luke, D. A.; Rodgers, S.; Cameron, G. T. & Kreuter, M. W. (2008). Cancer
coverage in general-audience and black newspapers. Health Communication, 23, 427-435.
Colditz, G. A. & Hunter, D. J. (2004). Cancer Prevention: The Causes and Prevention of Cancer. Boston: Kluwer Academic Publishers.
Cram, P.; Fredrick, A. M.; Inadomi, J.; Cowen, M. E.; Carpenter, D. & Vijan, S. (2003). The impact of a celebrity promotional campaign on the use of colon cancer screening: The Katie Couric effect. Archives
of Internal Medicine, 163, 1601-1605.
Freimuth, V. S.; Greenberg, R. H.; DeWitt, J. & Romano, R. M. (1984). Covering cancer: Newspapers and the public interest. Journal of Communication, 34(1), 62-73.
Geiger, T. M.; Miedema, B. W.; Geana, M. V.; Thaler, K.; Rangnekar, N. J. & Cameron, G. T. (2008). Improving rates for screening colonoscopy: Analysis of the health information national survey (HINTS I) data. Surgical Endoscopy, 22, 527-533.
Greenberg, R.; Freimuth, V. S. & Bratic, E. (1979). A content analytic study of daily newspaper coverage of cancer. Communication Yearbook, 3, 645-654.
Hoffman-Goetz, L. & Friedman, D. B. (2005). Disparities in coverage of cancer information in ethnic minor-ity and mainstream print media. Ethnicminor-ity & Disease, 15, 332-340.
Jemal, A.; Siegel, R.; Ward, E.; Hao, Y.; Xu, J.; Murray, T. & Thun, M. J. (2008). Cancer statistics, 2008. CA:
A Cancer Journal for Clinicians, 58, 71-96.
Jensen, J. D. (2008). Scientific uncertainty in news coverage of cancer research: Effects of hedging on scien-tists’ and journalists’ credibility. Human Communication Research, 34, 347-369.
Krippendorff, K. (2004). Content Analysis: An Introduction to its Methodology. Thousand Oaks, CA: Sage. Leventhal, H.; Kelly, K. & Leventhal, E. (1999). Population risk, actual risk, and cancer control: A discussion.
Journal of the National Cancer Institute Monographs, 25, 81-85.
National Cancer Institute. (2007). Cancer Control Continuum. Retrieved March 13, 2008, from http://can-cercontrol.cancer.gov/od/continuum.html
Orbell, S.; O’Sullivan, I.; Parker, R.; Steele, B.; Campbell, C. & Weller, D. (2008). Illness representations and coping following an abnormal colorectal cancer screening result. Social Science & Medicine, 67, 1465--1474.
Roper Starch Worldwide. (1997). Americans Talk about Science and Medical News: The National Health
Council Report. New York: Roper Starch Worldwide.
Rushefsky, M. E. (1986). Making Cancer Policy. Albany, NY: SUNY Press.
Schwartz, L. M.; Woloshin, S. & Welch, H. G. (1999). Risk communication in clinical practice: Putting cancer in context. Journal of the National Cancer Institute Monographs, 25, 124-133.
Slater, M. D.; Long, M.; Bettinghaus, E. P. & Reineke, J. B. (2008). News coverage of cancer in the United States: A national sample of newspapers, television, and magazines. Journal of Health Communication, 13, 523-537.
Stein, C. J. & Colditz, G. A. (2004). Modifiable risk factors for cancer. British Journal of Cancer, 90, 299-303. Stryker, J. E.; Moriarty, C. M.; & Jensen, J. D. (2008). Effects of newspaper coverage on public knowledge
about modifiable cancer risks. Health Communication, 23, 380-390.
Stryker, J. E.; Wray, R. I.; Hornik, R. C. & Yanovitzky, I. (2006). Validation of database search terms for content analysis: The case of cancer news coverage. Journalism & Mass Communication Quarterly, 83, 413-430.
U.S. Cancer Statistics Working Group. (2007). United States Cancer Statistics: 1999-2004 Incidence and
Mortality Web-based Report. Atlanta: U. S. Department of Health and Human Services, Centers for
Disease Control and Prevention, and National Cancer Institute. Retrieved April 28, 2008, from http:// www.cdc.gov.uscs.
Viswanath, K. (2005). The communications revolution and cancer control. Nature Reviews, 5, 828-835. Viswanath, K.; Breen, N.; Meissner, H.; Moser, R. P.; Hesse, B., et al. (2006). Cancer knowledge and