DOI 10.1007/s00217-015-2528-5 ORIGINAL PAPER
Mineral and volatile composition of água‑mel from Portugal
Maria Graça Miguel1 · Smail Aazza1 · Maria Dulce Antunes1 ·
Maria Leonor Faleiro2 · José G. Barroso3 · Luis G. Pedro3 · A. Cristina Figueiredo3
Received: 1 June 2015 / Revised: 27 July 2015 / Accepted: 5 August 2015 / Published online: 25 August 2015 © Springer-Verlag Berlin Heidelberg 2015
chromatography (GC) and gas chromatography–mass spec-trometry (GC–MS) from a subset of eight samples. Cluster analysis showed two poorly correlated clusters (Scorr < 0.3). Cluster I only sample was dominated by trans-β-ocimene (19 %), γ-terpinene (15 %) and 2-furfural (9 %). Cluster II that included the remaining seven samples showed two mod-erately correlated subclusters (Scorr < 0.5). The six samples with high correlation from subcluster IIa were dominated by 2-furfural (18–41 %) and benzene acetaldehyde (12–39 %).
n-Nonadecane (14 %), n-heneicosane and 2-furfural (both 13 %) were the main components of subcluster IIb sample. Although the presence of some volatile compounds can help in the correlation between água-mel and honey botanical source, the final product varies largely according to the prepa-ration process even for the same producer, in different years.
Água-mel detailed characterization may assist in bringing added value to this typical Portuguese honey-based product.
Keywords Portugal · Água-mel · Honey · Mineral
composition · Volatiles
Abbreviations
GC Gas chromatography
GC–MS Gas chromatography–mass spectrometry
Introduction
For their importance in local economies, regional honeys and honey-based products are gaining increased interest [1–4]. The Portuguese beekeepers, particularly in southern Portu-gal (Algarve and Alentejo regions), produce for long a typi-cal honey-based product typi-called água-mel. The production of
água-mel starts after the extraction of honey from the hon-eycombs. These honeycombs are then crumbled and dipped
Abstract Água-mel (honey–water) is a typical honey-based
product produced by the Portuguese beekeepers, particularly in southern Portugal. Água-mel was characterized by mineral content and volatiles contents. Mineral content evaluation was performed based on a random sampling of 14 samples from a total of 16 samples provided by local producers. Min-eral content showed that potassium predominated in
água-mel samples (1270–4105 mg/kg). The concentration of alu-minium in one sample was tenfold higher (5.8 mg/kg) than in the remaining samples (0.3–0.6 mg/kg). Água-mel vola-tiles were isolated by hydrodistillation and analysed by gas
* Maria Graça Miguel [email protected]
Smail Aazza
[email protected] Maria Dulce Antunes [email protected]
Maria Leonor Faleiro [email protected] José G. Barroso [email protected] Luis G. Pedro [email protected] A. Cristina Figueiredo [email protected]
1 Departamento de Química e Farmácia, Faculdade de Ciências e Tecnologia, Universidade do Algarve, MeditBio, Campus de Gambelas, 8005-139 Faro, Portugal
2 Faculdade de Ciências e Tecnologia, CBMR, Edf. 8, Campus de Gambelas, 8005-139 Faro, Portugal
3 Centro de Estudos do Ambiente e do Mar Lisboa, Faculdade de Ciências, 1749 016 Lisboa, Portugal., Universidade de Lisboa, CBV, DBV, 1749–016 Lisbon, Portugal
into warm water (70 °C), and the remaining liquid constituted by the washing water, as well as honey, propolis and pollen residues is, afterwards, cooked during 9–12 h, until it forms a dark-golden brown liquid syrup, with 70°–77° Brix. In order to know that the right consistency is attained, a drop of the syrup should be dropped over a nail, making a small round ball [5, 6]. This preparation procedure resembles the produc-tion of the Italian honey-based product abbamele [1, 2].
Água-mel is used in Portugal not only for folk medicinal purposes, to improve upper respiratory tract problems, but also in local gastronomy to spread in bread, for salads or fresh cheese dressing, as sweetener, and in the preparation of the typical bolo de água-mel (honey–water cake) [5, 6].
The physico-chemical characterization and microbio-logical quality of Portuguese água-mel as well as their anti-microbial, antiviral and antioxidant attributes were recently reported [6, 7]. Changes in some physical and chemical parameters during the traditional process of production were also evaluated by Figueira and Cavaco [5].
The present study aimed at the valorization of this honey-based product by investigating água-mel volatiles and mineral composition and understanding the influence of the preparation procedure and honey type used on the final product characteristics.
Materials and methods Materials
A total of 16 água-mel samples were kindly provided by local producers, as detailed in Table 1. For the volatiles
analysis, a subset of eight samples was randomly selected from the total sampling (Table 1). Água-mel samples were kept at room temperature until analysis.
Mineral content
Água-mel samples (5 g) were submitted to calcination (550 °C). After cooling, the residue was placed in a desic-cator up to further analysis. Nitric acid (5 mL) was added to the água-mel ash, and the mixture was stirred on a heat-ing plate to almost complete dryness. Thereafter, nitric acid (10 mL) was added, and the mixture was brought up to 25 mL with distilled water. From these solutions, the min-eral content (Na, K, Mg, Mn, Zn and Fe) was determined by flame atomic absorption spectrometry (air-acetylene) using a PerkinElmer Aanalyst 800, except aluminium and cupper which were analysed by graphite furnace atomic absorption spectrometry. Results were expressed as milli-grams of mineral content per kilomilli-grams of água-mel.
Volatiles extraction
Água-mel volatiles were isolated by hydrodistillation for 3 h using a Clevenger-type apparatus according to the European Pharmacopoeia method [8]. The isolation proce-dure was run at a distillation rate of 3 ml/min. The extracted volatiles were recovered in distilled n-pentane, collected in a vial and concentrated to a minimum volume, at room temperature, under nitrogen flux. The volatiles were stored at −20 °C in the dark until analysis.
Gas chromatography (GC)
Gas chromatographic analyses were performed using a PerkinElmer Clarus 400 gas chromatograph equipped with two flame ionization detectors, a data handling system and a vaporizing injector port into which two columns of dif-ferent polarities were installed: a DB-1 fused-silica column (polydimethylsiloxane, 30 m × 0.25 mm i.d., film thick-ness 0.25 µm; J & W Scientific Inc., Rancho Cordova, CA, USA) and a DB-17HT fused-silica column [(50 % phenyl)-methylpolysiloxane, 30 m × 0.25 mm i.d., film thickness 0.15 µm; J & W Scientific Inc.]. Oven tempera-ture was programmed, 45–175 °C, at 3 °C min−1,
subse-quently at 15 °C min−1 up to 300 °C, and then held
iso-thermal for 10 min; injector and detector temperatures, 280 and 300 °C, respectively; carrier gas, hydrogen, adjusted to a linear velocity of 30 cm s−1. The samples were injected
using split sampling technique, ratio 1:50. The volume of injection was 0.1 µL of a pentane–volatiles solution (1:1). The percentage composition of the volatiles was computed by the normalization method from the GC peak areas, cal-culated as mean values of two injections from each sample,
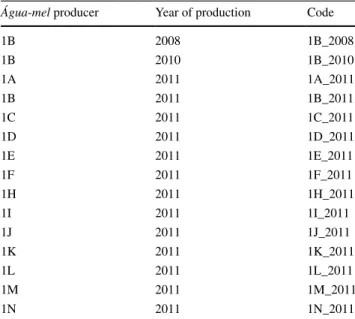
Table 1 Água-mel producer, year of production and code used in the volatiles analysis
Água-mel producer Year of production Code
1B 2008 1B_2008 1B 2010 1B_2010 1A 2011 1A_2011 1B 2011 1B_2011 1C 2011 1C_2011 1D 2011 1D_2011 1E 2011 1E_2011 1F 2011 1F_2011 1H 2011 1H_2011 1I 2011 1I_2011 1J 2011 1J_2011 1K 2011 1K_2011 1L 2011 1L_2011 1M 2011 1M_2011 1N 2011 1N_2011
using the response factors reported in the literature as pre-viously detailed [9].
Gas chromatography–mass spectrometry (GC–MS)
The GC–MS unit consisted of a PerkinElmer Clarus 600 gas chromatograph, equipped with DB-1 fused-silica col-umn (30 m × 0.25 mm i.d., film thickness 0.25 µm; J & W Scientific, Inc.) and interfaced with a PerkinElmer 600T mass spectrometer (software version 5.4, PerkinElmer, Shelton, CT, USA). Injector and oven temperatures were as above; transfer line temperature, 280 °C; ion source tem-perature, 220 °C; carrier gas, helium, adjusted to a linear velocity of 30 cm s−1; split ratio, 1:40; ionization energy,
70 eV; scan range, 40–300 u; scan time, 1 s. The identity of the components was assigned by comparison of their retention indices, relative to C8–C28 n-alkane indices and GC–MS spectra from a home-made library, created with reference essential oils (REO), laboratory-synthesized components (LSC), laboratory-isolated compounds (LIC) and commercially available standards (CAS).
Statistical analysis
The percentage composition of the isolated volatiles was used to determine the relationship between the samples by cluster analysis using Numerical Taxonomy Multivariate Analysis System (NTSYS–pc software, version 2.2, Exeter Software, Setauket, New York) [10]. For cluster analysis, correlation coefficient was selected as a measure of similar-ity among all accessions, and the Unweighted Pair Group Method with Arithmetical Averages (UPGMA) was used for cluster definition. The degree of correlation was evalu-ated, according to Pestana and Gageiro [11], as very high
(0.9–1), high (0.7–0.89), moderate (0.4–0.69), low (0.2– 0.39) and very low (<0.2).
Results and discussion Mineral content
Potassium (K) predominated (1270–4105 mg/kg) in the mineral content of all água-mel samples (Table 2), although with great variability depending on the producer. The pre-dominance of potassium was expected since this element is quantitatively the most important mineral in honey [12–14]. However, some values were much higher than those reported for honey samples, such as for 1N_2011 (3110 mg/kg) and 1F_2011 (4105 mg/kg). Sodium was the second more important element, whose concentra-tions ranged from 109.5 to 416.5 mg/kg. Aluminium (Al) was tenfold higher in the sample 1N_2011 when com-pared to the remaining samples (Table 2). Iron (Fe) content (61.5 mg/kg) was also higher in the same sample than in the remaining ones (15.0–55.5 mg/kg) (Table 2). The levels of copper (Cu) were also different between samples, from a minimal concentration around 4 mg/kg in several samples to 10.5–10.6 mg/kg in 1E_2011 and 1O_2011, respectively. Other example of great variability was magnesium (Mg) whose contents ranged from 37.9 mg/kg, in 1K_2011 sam-ple, to 188.9 mg/kg, in 1I_2011 (Table 2).
Variations in trace element contents in different honey types have been correlated with its botanical origin [15,
16]. Although água-mel mineral content variability found in the present work can also be linked to this factor, it is important to stress that the highest content of aluminium or iron in one sample may also be attributed to the traditional
Table 2 Mineral contents (mg/kg) ± standard deviation of Portuguese Água-mel
a Due to sample shortage, only one measurement was made for Na
Água-mel samples Al Cu Fe K Mg Mn Zn Naa
1A_2011 0.4 ± 0.2 6.5 ± 0.3 30.5 ± 1.0 2600 ± 460 101.1 ± 0.7 4.8 ± 1.5 4.2 ± 0.3 121.5 1B_2011 0.5 ± 0.1 7.8 ± 0.5 36.5 ± 1.5 2900 ± 25 78.8 ± 0.2 5.6 ± 1.8 3.9 ± 0.7 117.0 1C_2011 0.3 ± 0.2 5.4 ± 0.4 26.0 ± 1.0 2350 ± 165 93.6 ± 0.8 3.9 ± 0.5 3.1 ± 0.2 253.5 1D_2011 0.5 ± 0.3 9.1 ± 0.7 15.0 ± 2.5 1625 ± 65 45.8 ± 0.2 4.9 ± 0.8 3.8 ± 0.1 109.5 1E_2011 0.5 ± 0.1 10.5 ± 0.3 25.0 ± 1.0 2310 ± 40 60.5 ± 0.1 5.8 ± 0.5 4.9 ± 0.4 203.0 1F_2011 0.4 ± 0.2 5.2 ± 0.6 19.0 ± 2.5 4105 ± 45 55.3 ± 0.8 2.8 ± 1.0 3.0 ± 0.1 213.0 1H_2011 0.5 ± 0.1 9.0 ± 1.2 39.5 ± 0.5 1620 ± 215 163.1 ± 0.3 3.7 ± 0.3 3.5 ± 0.2 241.5 1I_2011 0.6 ± 0.2 4.4 ± 0.4 20.0 ± 1.5 1735 ± 110 188.9 ± 0.4 5.3 ± 0.7 3.6 ± 0.2 141.0 1J_2011 0.6 ± 0.2 5.6 ± 0.7 29.0 ± 0.5 1270 ± 40 145.6 ± 0.1 5.1 ± 0.4 4.1 ± 0.1 143.0 1K_2011 0.4 ± 0.1 4.3 ± 0.2 55.5 ± 3.0 1485 ± 45 37.9 ± 0.7 3.9 ± 0.4 3.2 ± 0.2 181.5 1L_2011 0.4 ± 0.1 4.9 ± 0.4 26.5 ± 0.5 2055 ± 5 44.5 ± 0.2 4.2 ± 0.5 3.8 ± 0.1 416.5 1M_2011 0.4 ± 0.1 6.0 ± 0.2 30.0 ± 1.0 1625 ± 250 96.3 ± 1.8 3.0 ± 0.9 4.1 ± 0.1 191.0 1N_2011 5.8 ± 0.9 5.5 ± 0.1 61.5 ± 1.0 3110 ± 60 77.7 ± 0.3 5.5 ± 0.8 2.8 ± 0.25 215.0
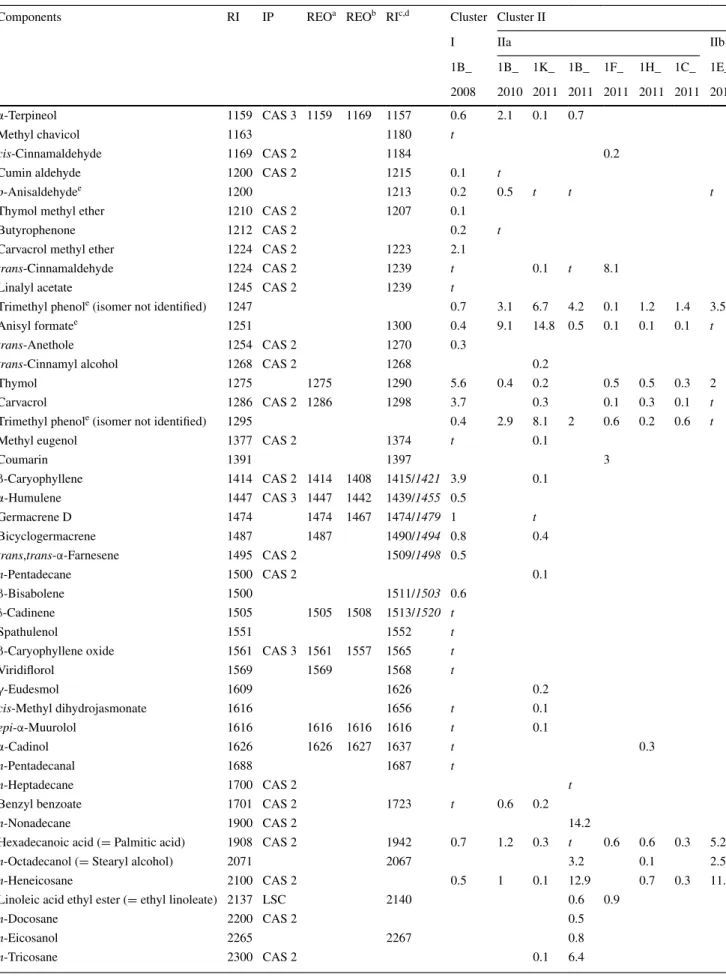
Table 3 Percentage composition of the components identified in the volatiles isolated by hydrodistillation from eight samples of Água-mel obtained from local producers (Table 1)
Components RI IP REOa REOb RIc,d Cluster Cluster II
I IIa IIb 1B_ 1B_ 1K_ 1B_ 1F_ 1H_ 1C_ 1E_ 2008 2010 2011 2011 2011 2011 2011 2011 n-Octane 800 CAS 2 1.2 1.4 2.1 0.9 0.3 2.4 3.9 4.5 2-Furfural 825 CAS 2 829 9.1 35.9 34.2 12.7 41.4 36.1 38.6 17.8 Protoanemonine 854 2 t p-Xylene 855 CAS 2 857 2.9 2.8 o-Xylene 856 CAS 2 869 5.7 0.2 2-Acetyl furane 900 892 1 5 1.5 1.1 5 6 0.2 1.8 n-Nonane 900 CAS 2 2.5 α-Thujene 924 CAS 1 922 922 929 1.5 Benzaldehyde 927 CAS 2 934 0.8 0.1 0.5 1 1.1 0.5 α-Pinene 930 CAS 1 930 930 931 0.4 5-Methyl furfural 938 934 0.3 0.7 0.5 3.2 3.7 5.3 4.5 0.5 Camphene 938 CAS 1 938 942 938 t Sabinene 958 CAS 1 958 964 959 0.6 1.7 1.5 1-Octen-3-ol 961 CAS 2 961 959 972 t β-Pinene 963 CAS 1 963 970 962 2.3 8.9
Hexanoic acid (= Caproic acid) 968 CAS 2 981 t
β-Myrcene 975 CAS 2 975 980 981 2.3 t 0.3 t
α-Phellandrene 995 CAS 2 1000 998 986 0.2 0.1
Benzyl alcohol 1000 CAS 2 1004 t t t
Benzene acetaldehyde 1002 CAS 2 1006 2.3 12.2 14.2 2.8 16.7 29.7 24.1 39.2
2,6,6-Trimethyl cyclohexanone 1003 CAS 2 1016 t t
p-Cymene 1003 CAS 2 1003 1011 1004 2.4 1.9 t t t
1,8-Cineole 1005 CAS 2 1005 1010 5.5 t 0.2
Limonene 1009 CAS 3 1009 1020 1014 1.6 0.3 5 4.1 0.1
cis-β-Ocimene 1017 CAS 3 1017 1025 1015 4.6 0.1
Acetophenone 1017 CAS 2 1036 t t t
trans-β-Ocimene 1027 CAS 3 1027 1035 1026 19 0.1
γ-Terpinene 1035 CAS 2 1035 1046 1049 14.6 0.4 0.1 0.7 t 0.1
trans-Sabinene hydrate 1037 1037 1052 t
cis-Linalool oxide 1045 1078 t 0.1 0.2 0.5 3.2 0.1
2-Methyl decanee 1046 1065 t 0.1 0.1 t 0.1 0.8 0.1 0.1
Fenchone 1050 CAS 2 1065 0.5
trans-Linalool oxide 1059 1064 0.1 t 1.5
Terpinolene 1064 CAS 2 1064 1077 1077 t 1.1
Phenyl ethyl alcohol 1064 CAS 2 1074 0.4 t 0.1 t 0.1
Linalool 1074 CAS 2 1074 1082 1082 0.5 0.1
Isophorone 1074 CAS 2 1074 0.1
n-Undecane 1100 CAS 2 t 0.3 t t 0.1 t 0.1
2-Ethyl hexanoic acide 1101 1097 2.5 0.2
Borneol 1134 CAS 2 1134 1140 t
Menthol 1148 CAS 2 1150 t
Terpinen-4-ol 1148 CAS 2 1148 1158 1171 0.5 t 0.1
p-Cymen-8-ol 1148 1148 1158 1171 t
Table 3 continued
Components RI IP REOa REOb RIc,d Cluster Cluster II
I IIa IIb
1B_ 1B_ 1K_ 1B_ 1F_ 1H_ 1C_ 1E_
2008 2010 2011 2011 2011 2011 2011 2011
α-Terpineol 1159 CAS 3 1159 1169 1157 0.6 2.1 0.1 0.7
Methyl chavicol 1163 1180 t
cis-Cinnamaldehyde 1169 CAS 2 1184 0.2
Cumin aldehyde 1200 CAS 2 1215 0.1 t
p-Anisaldehydee 1200 1213 0.2 0.5 t t t
Thymol methyl ether 1210 CAS 2 1207 0.1
Butyrophenone 1212 CAS 2 0.2 t
Carvacrol methyl ether 1224 CAS 2 1223 2.1
trans-Cinnamaldehyde 1224 CAS 2 1239 t 0.1 t 8.1
Linalyl acetate 1245 CAS 2 1239 t
Trimethyl phenole (isomer not identified) 1247 0.7 3.1 6.7 4.2 0.1 1.2 1.4 3.5
Anisyl formatee 1251 1300 0.4 9.1 14.8 0.5 0.1 0.1 0.1 t
trans-Anethole 1254 CAS 2 1270 0.3
trans-Cinnamyl alcohol 1268 CAS 2 1268 0.2
Thymol 1275 1275 1290 5.6 0.4 0.2 0.5 0.5 0.3 2
Carvacrol 1286 CAS 2 1286 1298 3.7 0.3 0.1 0.3 0.1 t
Trimethyl phenole (isomer not identified) 1295 0.4 2.9 8.1 2 0.6 0.2 0.6 t
Methyl eugenol 1377 CAS 2 1374 t 0.1
Coumarin 1391 1397 3
β-Caryophyllene 1414 CAS 2 1414 1408 1415/1421 3.9 0.1
α-Humulene 1447 CAS 3 1447 1442 1439/1455 0.5
Germacrene D 1474 1474 1467 1474/1479 1 t
Bicyclogermacrene 1487 1487 1490/1494 0.8 0.4
trans,trans-α-Farnesene 1495 CAS 2 1509/1498 0.5
n-Pentadecane 1500 CAS 2 0.1
β-Bisabolene 1500 1511/1503 0.6
δ-Cadinene 1505 1505 1508 1513/1520 t
Spathulenol 1551 1552 t
β-Caryophyllene oxide 1561 CAS 3 1561 1557 1565 t
Viridiflorol 1569 1569 1568 t
γ-Eudesmol 1609 1626 0.2
cis-Methyl dihydrojasmonate 1616 1656 t 0.1
epi-α-Muurolol 1616 1616 1616 1616 t 0.1
α-Cadinol 1626 1626 1627 1637 t 0.3
n-Pentadecanal 1688 1687 t
n-Heptadecane 1700 CAS 2 t
Benzyl benzoate 1701 CAS 2 1723 t 0.6 0.2
n-Nonadecane 1900 CAS 2 14.2
Hexadecanoic acid (= Palmitic acid) 1908 CAS 2 1942 0.7 1.2 0.3 t 0.6 0.6 0.3 5.2
n-Octadecanol (= Stearyl alcohol) 2071 2067 3.2 0.1 2.5
n-Heneicosane 2100 CAS 2 0.5 1 0.1 12.9 0.7 0.3 11.6
Linoleic acid ethyl ester (= ethyl linoleate) 2137 LSC 2140 0.6 0.9
n-Docosane 2200 CAS 2 0.5
n-Eicosanol 2265 2267 0.8
way to produce água-mel, namely to the type of containers where água-mel was produced and/or stored.
Volatiles evaluation
The volatile fraction isolated from each individual of
água-mel sample was a complex mixture in which 91 compo-nents were identified, representing 84–97 % of the total volatiles. The identified volatile components are listed in Table 3 in the order of their elution on the DB-1 column, arranged according to the total three types of volatile oils obtained by agglomerative cluster analysis.
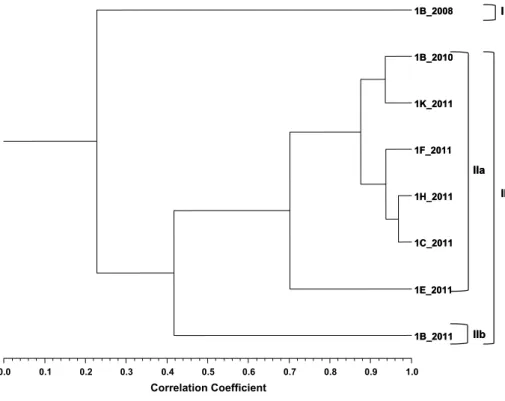
Cluster analysis, based on água-mel volatiles composi-tion, showed two poorly correlated clusters (Scorr < 0.3)
(Fig. 1). Cluster I which included only one sample from 2008 was characterized by the dominance of trans-β-ocimene (19 %), γ–terpinene (15 %) and 2-furfural (9 %). Cluster II that included the remaining seven samples showed two moderately correlated subclusters (Scorr < 0.5). The six more correlated samples from subcluster IIa were dominated by 2-furfural (18–41 %) and benzene acetalde-hyde (12–39 %). n-Nonadecane (14 %), n-heneicosane and 2-furfural (both 13 %) were the main components of the one sample from subcluster IIb.
Benzene acetaldehyde, a common aromatic compound in honey samples [17–19], was present in all água-mel samples in a range of 2–39 % (Table 3). In honey, this vari-ability has been related to the floral origin of honeys [17]. Generally, beekeepers use mixtures of honeys for água-mel production; thus, different proportions of several unifloral or even multifloral honeys may be responsible for that per-centage range. 2-Furfural was also present in relative high amounts in all samples (9–41 %). This compound has also
been reported as part of the volatile fraction of honey [20]. Other thermally derived furan derivatives were also present in relative abundance, such as 2-acetyl furan (0.2–5 %) and 5-methylfurfural (0.3–5 %) (Table 3).
n-Nonadecane, hexadecanoic acid, n-octadecanol,
n-heneicosane, linoleic acid ethyl ester, n-docosane,
n-eicosanol, n-tricosane, n-pentacosane and n-heptacosane present in relative high amounts in some água-mel samples may be due to the use of the honeycombs-derived beeswax. These compounds were also reported by Jerković et al. [2] in abbamele, from Sardinia (Italy), an água-mel similarly obtained product, by traditional honeycombs processing.
Despite the similarities of producing process, between
abbamele [2] and the presently studied água-mel sam-ples, there are some differences in the volatile profile. Limonene was the main monoterpene found in some samples of abbamele, which according to the authors could be attributed to the citrus rind addition during pro-duction process. In the present work, only one sample of
água-mel had relatively high amounts of monoterpenes (1B_2008).
Among monoterpenes, trans-β-ocimene (19 %), γ–ter-pinene (15 %), 1,8-cineole (6 %) and thymol (6 %) were the most relevant, present in percentages ≥5 % in sam-ple 1B_2008 (Table 3). However, in samples 1B_2010 and 1B_2011, 2 and 3 years later samples from the same beekeeper, these monoterpenes did not attain such high percentages (varying from not detected to 1 %, in the four samples). Instead, β-pinene was the major monoterpene in 1B_2010 sample (9 %) and not detected in 1B_2011. Conversely, in 1B_2011 água-mel sample of the same producer, limonene (4 %) was the main monoterpene, whereas in 1B_2008 and 1B_2010, the percentages were
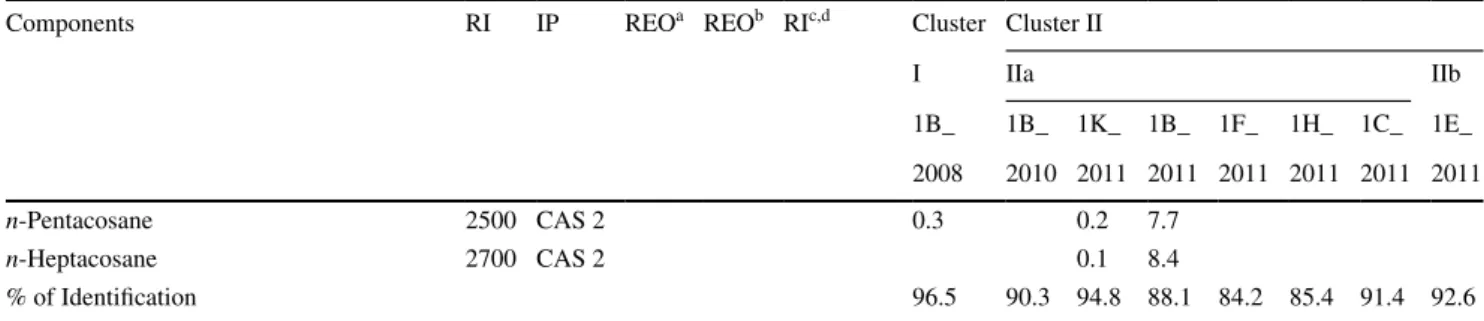
Table 3 continued
Components RI IP REOa REOb RIc,d Cluster Cluster II
I IIa IIb 1B_ 1B_ 1K_ 1B_ 1F_ 1H_ 1C_ 1E_ 2008 2010 2011 2011 2011 2011 2011 2011 n-Pentacosane 2500 CAS 2 0.3 0.2 7.7 n-Heptacosane 2700 CAS 2 0.1 8.4 % of Identification 96.5 90.3 94.8 88.1 84.2 85.4 91.4 92.6
For samples grouped on each of the clusters I–II and subclusters a–b, see Fig. 1
RI = retention index calculated relative to C9–C27 n-alkanes on the DB-1 column; IP = identification procedure. All components were identified based on a laboratory-made library created with reference essential oils (REO), laboratory-synthesized components (LSC), laboratory-isolated compounds (LIC) and commercially available standards (CAS)
a,b REO, reference essential oils of Thymus caespititius [21] and Juniperus cedrus [22], in which components’ identity was confirmed by RI, GC–MS and 13C-NMR. CAS 1. Extrasynthese (Cymit Química, S.L.), CAS 2. Sigma-Aldrich, CAS 3. Fluka, CAS 4. Riedel-de Haën. Unless otherwise specified, retention index from LSC, LIC and CAS is that reported in previous column. c,d RI, regular font values from Linstrom and Mallard [23], italic values from Joulain and Köning [24]. c RI, literature retention indices on DB-1 or similar phase column (100 % dimethyl-polysiloxane) not from the authors’ laboratory. d RI, literature retention indices on a Cp-Sil 5 (100 % dimethylpolysiloxane). t, trace (<0.05 %). e Tentative identification based on mass spectra only
2 and 0.3 %, respectively. Limonene was also present as major monoterpene component (5 %) in sample 1K_2011 (Table 3).
This variability was also found [6] for total phenols and flavonoids in the same samples. In that work, the authors concluded that these metabolites as well as anti-oxidant activity, measured through several methods were dependent on the producer and year of production. How-ever, the authors also found that the antioxidant activity correlated better with the melanoidin content than with polyphenol content, particularly between melanoidin content and capacity for scavenging peroxyl radicals; between melanoidin content and capacity for scaveng-ing nitric oxide radicals; and between melanoidin content and capacity for chelating metal ions [6]. Such results revealed that beyond the components constituting the honeys used for producing água-mel, there are other ones that are formed during its production which are impor-tant on the biological properties. In this way, the botani-cal origin of honeys along with the mode of production is particularly important on the final characteristics of
água-mel.
Such as previously observed [6] for polyphenols, mela-noidins and biological properties, in the present work it was possible to conclude that although the presence of some volatile compounds can help in the correlation between
água-mel and honey botanical source, the final product also varies largely according to the preparation process (time of decoction, type of container, optional addition of spices, or
other flavourings substances) even for the same producer, in different years.
Conclusion
This study reports the first mineral content and volatiles study of água-mel. Mineral content was similar to that gen-erally found in honey. Potassium was the most abundant, nevertheless with significant differences between produc-ers. Other elements such as Al, Cu, Fe and Mg also varied greatly. These differences may be attributed to the botanical origin of honeys used for água-mel production, but also to the type of containers used in its production.
Thermally derived furan derivatives were detected in
água-mel samples, as a consequence of the prolonged decoction process, as well as some aromatic compounds frequent in honey and in beeswax. Their percentages, as well as other volatile compounds, like monoterpenes, var-ied according to the producer and, for the same producer, with production year.
The relative high concentrations of some minerals as well as those of the derived furan derivatives in água-mel need to be solved, and for this purpose, it will be necessary to standardize the production technology using stainless steel vessels and reducing the time of high-temperature heating.
Aiming at adding value to água-mel, gaining an in-depth knowledge on this a Portuguese typical honey-based prod-uct may support strategies for creation of new market trades.
Fig. 1 Dendrogram obtained by cluster analysis of the percent-age composition of volatiles from Água-mel samples based on correlation and using UPGMA. For abbreviations, see Table 1 1B_2008 1B_2010 1K_2011 1F_2011 1H_2011 1C_2011 1E_2011 1B_2011 I II IIa IIb Correlation Coefficient 0.0 0.1 0.2 0.3 0.4 0.5 0.6 0.7 0.8 0.9 1.0 1B_2008 1B_2010 1K_2011 1F_2011 1H_2011 1C_2011 1E_2011 1B_2011 I II IIa IIb
Acknowledgments This study was partially funded by Ministério da Agricultura, Mar, Ambiente e Ordenamento do Território (Portu-gal) under research contract Programa Apícola Nacional 2011–2013, Medida 6A, and by Fundação para a Ciência e a Tecnologia (FCT), under Pest–OE/EQB/LA0023/2011 and UID/AMB/50017/2013. Compliance with ethical standards
Conflict of interest None.
Compliance with Ethics Requirements This article does not con-tain any studies with human or animal subjects.
References
1. Spano N, Ciulu M, Floris I, Panzanelli A, Pilo MI, Piu PC, Scanu R, Sanna G (2008) Food Chem 108(1):81–85
2. Jerković I, Kasum A, Marijanović Z, Tuberoso CIG (2011) Food Chem 124(1):401–410
3. Tornuka F, Karaman S, Ozturk I, Toker OS, Tastemur B, Sagdic O, Dogan M, Kayacier A (2013) Ind Crops Prod 46(1):124–131 4. Čanadanović-Brunet J, C´etković G, Šaponjac VT, Stajcˇić S,
Vulić J, Djilas S, Štajnerb D, Popović B (2014) Ind Crops Prod 62(1):1–7
5. Figueira AC, Cavaco T (2012) J Food Process Preserv 36(4):285–290
6. Miguel MG, Antunes MD, Aazza S, Duarte J, Faleiro ML (2013) Ital J Food Sci 25:275–282
7. Miguel MG, Faleiro L, Antunes MD, Aazza S, Duarte J, Silvério AR (2013) Food Chem Toxicol 56(1):136–144
8. Council of Europe (COE) European Directorate for the Quality of Medicines (2007) European Pharmacopoeia 6th edn. Stras-bourg, France
9. Figueiredo AC, Garcia C, Sim-Sim M, Sérgio C, Pedro LG, Bar-roso JG (2010) Flavour Fragr J 25(4):219–222
10. Rohlf JF NTSYS-pc (2000) Numerical Taxonomy and Multivari-ate Analysis System. Applied Biostatistics, Port Jefferson, New York
11. Pestana MH, Gageiro JN (2000) Análise de dados para ciências sociais. A complementaridade do SPSS. Edições Sílabo, Lisboa 12. Rodriguez-Otero JL, Paseiro P, Simal J, Cepeda A (1994) Food
Chem 49(1):169–171
13. Downey G, Hussey K, Kelly JD, Walshe TF, Martin PG (2005) Food Chem 91(2):347–354
14. Silva LR, Videira R, Monteiro AP, Valentão P, Andrade PB (2009) Microchem J 93(1):73–77
15. González-Miret ML, Terrab A, Hernanz D, Fernández-Recama-les MA, Heredia FJ (2005) J Agric Food Chem 53:2574–2580 16. Nozal Nalda MJ, Yague JLB, Calva JCD, Gomez MTM (2005)
Anal Bioanal Chem 382(2):311–319
17. Pérez RA, Sánchez-Brunete C, Calvo RM, Tadeo JL (2002) J Agric Food Chem 50(9):2633–2637
18. Baroni MV, Nores ML, Díaz MDP, Chiabrando GA, Fas-sano JP, Costa C, Wunderlin DA (2006) J Agric Food Chem 54(19):7235–7241
19. Manyi-Loh CE, Ndip RN, Clarke AM (2011) Int J Mol Sci 12(2):9514–9532
20. Wolski T, Tambor K, Rybak-Chmielewska H, Kedzia B (2006) J Apic Sci 50(2):115–126
21. Salgueiro LR, Vila R, Tomi F, Figueiredo AC, Barroso JG, Cañigueral S, Casanova J, da Proença AP, Adzet T (1997) Phyto-chemistry 45(2):307–311
22. Cavaleiro C, Salgueiro L, Barroso JG, Figueiredo AC, Pedro LG, Fontinha SS, Bighelli A, Casanova J, Looman A, Scheffer JJC (2002) Flavour Fragr J 17(2):111–114
23. Linstrom PJ, Mallard WG (eds) NIST chemistry webbook, NIST standard reference database number 69, National Institute of Standards and Technology, Gaithersburg MD, 20899, http://web-book.nist.gov. Accessed May 2015
24. Joulain D, Köning WA (1998) The atlas of spectral data of ses-quiterpene hydrocarbons. E.B.-Verlag, Hamburg