379 Barbosa, Costa, and Coelho are with Polytechnic Institute Bragança, Bragança, Portugal. Marinho, Moreira, and Silva are with the University of Beira Interior, Covilhã, Portugal.
Modeling the Links Between Young
Swimmers’ Performance: Energetic
and Biomechanic Profiles
Tiago M. Barbosa and Mário CostaPolytechnic Institute Bragança
Daniel A. Marinho
University of Beira Interior
Joel Coelho
Polytechnic Institute Bragança
Marc Moreira and António J. Silva
University of Beira Interior
The aim was to develop a path-flow analysis model for young swimmers’ perfor-mance based on biomechanical and energetic parameters, using structural equation modeling. Thirty-eight male young swimmers served as subjects. Performance was assessed by the 200-m freestyle event. For biomechanical assessment the stroke length, the stroke frequency and the swimming velocity were analyzed. Energet-ics assessment included the critical velocity, the stroke index and the propulsive efficiency. The confirmatory model explained 79% of swimming performance after deleting the stroke index-performance path, which was nonsignificant (SRMR = 0.06). As a conclusion, the model is appropriate to explain performance in young swimmers.
The goal of competitive swimming is to travel the race distance as fast as possible. The identification of the variables that predict swimming performance is one of the main aims of the swimming “science” community. Anthropometrics, hydrodynamics, psychology, pedagogy, medicine and traumatology are some of the main scientific approaches used to understand swimming performance (9). Even so, it is consensual that biomechanics and physiology/energetics are the most determinant areas to enhance performance and achieve high-standard levels in competitive swimming (5).
Some research groups dedicate their attention to understanding the relationships established between energetics and biomechanical variables on adult swimmers, with special emphasis on elite adult swimmers (e.g., 2,3,29). Several research projects explored those relationships and identified the links between them. It was reported that, on one hand, performance is strongly related to several energetic variables, such as oxygen up-take (e.g., 13), energy cost (e.g., 7) or time limit and minimum velocity to achieve maximal oxygen up-take (e.g., 16). On the other hand, energetics variables appear to depend on biomechanical ones, such as speed fluctuation (e.g., 1), swimming velocity (e.g., 2) or stroke mechanics (e.g., 3). In this sense, there are relationships that might be described as a “flow chart” type. These types of explor-atory and confirmexplor-atory models are often used in other scientific domains, such as economy, genetics or epidemiology. However, to our knowledge, the development of “flow chart” models was never attempted in competitive swimming.
Furthermore, the research dedicated to competitive swimming in young people is reduced in comparison with the one about adult/elite swimmers. Investigation on the relationships between performance, energetics and biomechanics in young swimmers has to change some of the variables analyzed. Not only economical but also ethical issues are raised when children are evaluated. Several parameters commonly assessed in adult swimmers cannot be used in young swimmers due to several reasons. Assessments in young swimmers are less expensive, invasive, complex or time consuming in comparison with the ones assessed in adult/elite swimmers. Nevertheless, on a regular basis, young swimmers’ coaches also perform biomechanical and energetic assessments. Besides, there are assessment batteries suggesting procedures for data collection, its analysis and interpretation for young swimmers in particular. They include both energetic and biomechanical assessment procedures among others (e.g., 6,13,34).
While children are swimming, the relationships established between perfor-mance, energetics and biomechanics domains, seem not to be fully understood. Some papers examined the influence of the energy cost of swimming, body compo-sition, drag coefficient and technical parameters on swimming performance (e.g., 22–25,30). There, it was reported that stroke index (R2 = .898), in-water VO
2peak (R2 = .358), and arm span (R2 = .454) were the best predictors of swimming per-formance in young swimmers (22). Higher levels of leg-kick force, peak VO2, stroke efficiency and muscularity were the most potent variables contributing to the classification of the faster swimmers (23). When scaling for body surface area and body mass, children were less economical than adults; when scaling for body length, children were equally economical and; when considering energy cost per meter and absolute VO2, children were more economical than the adults computing two-sample student’s t test (24). For young swimmers, anthropometric character-istics, stroke frequency and stroke length did not present large association with energy cost in front-crawl swimming (R < .57; 30). Stepwise regression showed that biomechanical factors (R2 > .32) best characterized the 400-m event in young females, followed by energetic (R2 > .31) and physical ones (R2 > .20; 25). These researches contributed to a higher level in the state of the art about performance in children swimming. Nevertheless, several evaluated parameters are not often at the disposal of young swimmers’ coaches, such as, energy cost, blood lactate or VO2. So, there is a chance to develop a model to explain young swimmers’ performance based on variables assessed on a regular basis by field practitioners (e.g., 34).
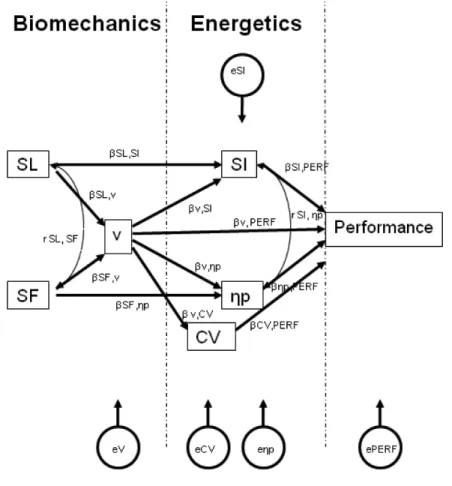
The aim of this research was to develop a path-flow analysis model for young swimmers’ performance based on biomechanical and energetic parameters using structural equation modeling. The theoretical model adopted is presented in Figure 1. This model was developed according to the main review papers about these relationships in competitive swimming (e.g., 5,26). It was reported that swim-ming performance is determined by energetic profile and the latter by biome-chanics behavior (5). So, the sequence of the path-flow domains was respectively biomechanics-energetic-performance. For biomechanical assessment the most cited variables are the stroke length, stroke frequency and swimming velocity (14). In the energetic domain, aerobic capacity is often estimated through the critical velocity concept in young swimmers (20). Estimation of swimming efficiency has been accomplished in the past by the stroke index (12) and more recently by the propulsive efficiency estimation concept (40) based on the theoretical model of
Figure 1 — Theoretical path-flow model. SL—stroke length; SF—stroke frequency;
CV—critical velocity; SI—stroke index; ηp—propulsive efficiency; βxi,yi—beta value for
regression model between exogenous (xi) and endogenous (yi) variables; exi—disturbance term for a given endogenous variable; rxi,yi—correlation coefficient between two variables; xi →yi—variable yi depends from variable(s) xi; xi↔yi variable yi is associated to variable xi
Martin et al. (27). All these parameters are easy to record and have an ecological validity for young swimmers’ coaches.
Methods
Subjects
Thirty-eight male young swimmers with several competitive levels volunteered as subjects (12.53 ± 0.58 years old; 1.56 ± 0.10 m of height; 46.58 ± 9.25 kg of body mass; 14.98 ± 4.95% fat mass by bioimpedance; Tanner stages 1–2 assessed by self-evaluation). Parents and coaches gave their consent for the swimmers’ participation in this study. All procedures were in accordance to the Declaration of Helsinki in respect to Human research. The Institutional Review Board of the Polytechnic Institute Bragança approved the study design.
Biomechanical Data Collection
For biomechanical assessment swimming velocity, stroke frequency and stroke length were measured. Each swimmer made a maximal 25-m swim with an underwa-ter start. Subject performed the bout alone with no other swimmer in the same swim lane to reduce the drafting or pacing effects. The swimmers were advised to reduce gliding during the start. Swimming velocity was measured in the middle 15-m as:
Equation 1
Where v is the mean swimming velocity, d the distance covered by the swim-mer, t the time spent to cover such distance and measured with a chronometer by an expert evaluator on the swimming pool deck during the bout. The stroke frequency (SF) was measured with a crono-frequency meter from 3 consecutive stroke cycles, in the middle of the 15-m distance by another expert evaluator on the swimming pool deck during the bout. Stroke length was estimated as (14):
Equation 2 Energetics Data Collection
The assessment of energetics included the analysis of the stroke index and the propulsive efficiency as swim efficiency estimators as well as critical velocity as an aerobic capacity estimator. Stroke index (SI), considered as one of the swim stroke efficiency indexes was computed as (12):
Equation 3
Propulsive efficiency (hp) was estimated as being (40):
Equation 4
Where v is the swim velocity, SF is the stroke frequency and l is the arm’s length. The l was computed trigonometrically measuring the arm’s length and taking into account the average elbow angles during the insweep of the arm pull reported by Zamparo (41) for subjects of similar chronological age and gender. Equation 4 is properly speaking the Froude efficiency. The difference between Froude and propelling efficiency is that the first one does not take into account the effect of the internal mechanical work to total mechanical work production. As reported by Zamparo et al. (40), at the range of swim velocities verified in these swimmers, internal mechanical work is rather low and can be neglected. So, propulsive effi-ciency is very similar to Froude effieffi-ciency.
Critical velocity (CV) was computed based on the swimmers curriculum (10). The CV was assessed based on the 200 m and 800 m freestyle short course events. The mean (± SD) time gap between the swimmers personal records (the difference between the oldest and the most recent personal best) was 2.3 ± 1.2 months. The
CV was computed using the slope of the simple linear regression model, plotting the swimming performances over the time and determined by (39):
Equation 5
Where d is the distance of the swim event, a is the slope of the fit line, t is the time spent to cover the distance and b the y- interception in the origin of the xx axis.
Performance Data Collection
Swimming performance was assessed by time lists of the 200 m freestyle event of official short course competitions of local, regional or national level. The time gap between biomechanical plus energetics assessments and swimming performance was made in less than two weeks.
Statistical Procedures
The normality and homocedasticity assumptions were checked respectively with the Shapiro-Wilk and the Levene tests. Descriptive statistics (minimum, maximum, mean and one standard deviation) from all variables were calculated. Pearson correlation coefficients were computed between swimming performance and all remains variables. The statistical significance was set at p ≤ .05.
Structural equation modeling is a mathematical approach for testing and esti-mating causal relationships using a combination of statistical data and qualitative causal assumptions previously defined by the researcher that will be (or would not be) confirmed. Path analysis is one special case of structural equation modeling. This kind of modeling aims at confirming the existence of relationships between variables and not to identify them. Moreover, this approach, rather than to identify variables, also suggests the kind of interplay (direct, indirect and spurious effects) which exists.
Path-flow analysis was performed with the estimation of linear regression standardized coefficients between the exogenous and endogenous variables. All assumptions to perform the path-flow analysis were taken into account. When appropriate, according to the theoretical model, simple or multiple linear regression models were computed. Standardized regression coefficients (β) were considered. Significance of each β was assessed with the Student’s t test (p ≤ .05). The effect
size of the disturbance term, reflecting unmeasured variables, for a given endog-enous variable, was 1-R2.
To measure the quality of the model fit, the standardized root mean square residuals (SRMR) was computed:
Equation 6
Where r is the Pearson correlation coefficients and p the correlation predicted by the model (based on total effect, i.e., the addiction of the direct and indirect effects plus spurious effects). SRMR measures the standardized difference between the observed covariance and predicted covariance. It is considered qualitatively if: (i) SRMR < 0.1 that the model adjust to the theory; (ii) SRMR < 0.05 that the model adjusts very well to the theory and; (iii) SRMR ~0 that the model is perfect (adapted from 21).
Results
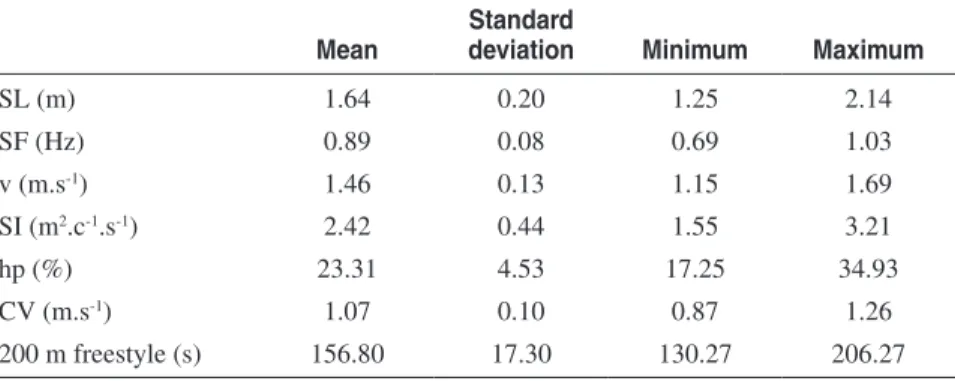
Table 1 presents descriptive statistics from all variables studied. Data dispersion, expressed as 1SD, was moderate-high for almost every variable. This same idea can be supported analyzing the range values. This was especially clear for the swim performance (130.27 ≤ 200 m Freestyle ≤ 206.27 s), one biomechanical variable (1.25 ≤ SL ≤ 2.14 m) and one energetics variable (17.25 ≤ ηp ≤ 34.93%).
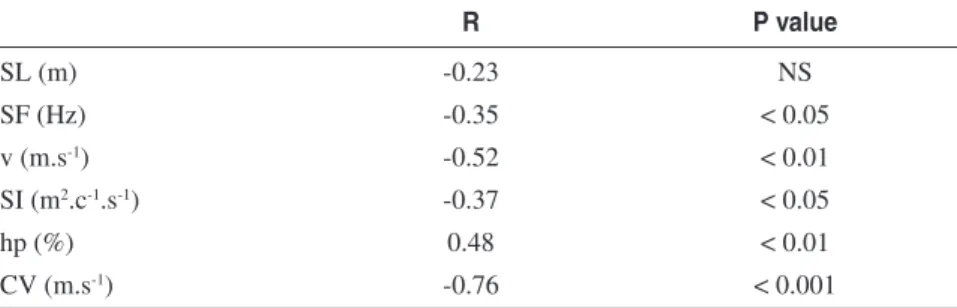
Table 2 presents the correlation between swim performance and remaining variables analyzed. All variables presented significant association with swim per-formance, except for SL. For the significant ones, correlation coefficients ranged between moderate (e.g., r performance,SF = -0.35) and high (e.g., rperformance,CV = -0.76) associations.
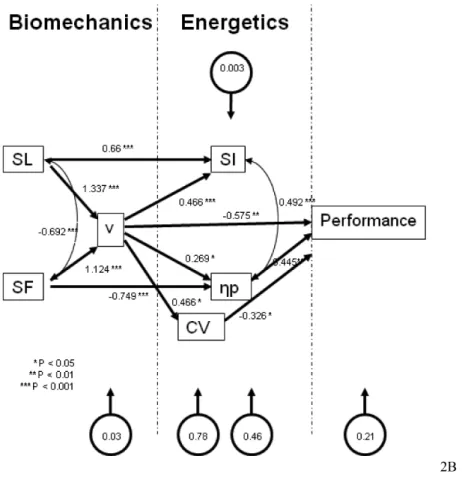
Figure 2 presents the confirmatory path-flows for young swimmer’s per-formance. Almost every partial relationship confirmed the hypothesis. The only exception was the relationship between SI and performance (β = -0.003, p > .05).
Table 1 Descriptive Statistics of Biomechanics, Energetics and Swim Performance Variables
Mean Standard deviation Minimum Maximum
SL (m) 1.64 0.20 1.25 2.14 SF (Hz) 0.89 0.08 0.69 1.03 v (m.s-1) 1.46 0.13 1.15 1.69 SI (m2.c-1.s-1) 2.42 0.44 1.55 3.21 hp (%) 23.31 4.53 17.25 34.93 CV (m.s-1) 1.07 0.10 0.87 1.26 200 m freestyle (s) 156.80 17.30 130.27 206.27
The confirmatory model explained 79% of swimming performance for both path-flows including (Figure 2A) and deleting (Figure 2B) SI-performance path with subsequent recomputation of the remaining data. So, it can be stated from a quali-tative viewpoint that a high prediction of swim performance was verified. SRMR, quantifying the fit of the model purposed, was 0.10 for the first confirmatory model, including the nonsignificant path (Figure 2A) and 0.06 without that path (Figure 2B). In this sense, the confirmatory path-flow model can be considered suitable of the theory presented.
Discussion
The aim of this research was to develop a path-flow analysis model for young swim-mers’ performance based on biomechanical and energetics parameters. The main results were that the confirmatory models explained 79% of swimming performance including (SRMR = 0.10) or deleting (SRMR = 0.06) the stroke index-performance path, which was nonsignificant.
It was considered that swimming performance is strongly related to the energet-ics profile and, in turn, this one to technical level (5). So, the path model designed adopted the same flow sequence: biomechanics-energetic-performance. The analysis of the relationships between the three domains is often made with adult/elite swim-mers. However, in young swimmers these interplays seem not to be fully explored. Moreover, “typical” variables to assess biomechanical and energetics profile in young swimmers are not the same as for adult/elite swimmers. With the younger swimmers, apparatus and procedures have to be less expensive, invasive, complex and time consuming. Field practitioners do: (i) biomechanical assessments based on the stroke mechanics (SF, SL and v); (ii) energetics assessments estimating the swim efficiency (SI and ηp) and the aerobic capacity (CV) and; (iii) swimming performance assessment according to final time in real competition context. All the variables are easy to collect and have ecological meaning to design, control and evaluate the training process. Swimming performance was evaluated based on the 200 m freestyle event. Most of the races in the competitive swimming have distances up to 200 m. Indeed the 200 m event is one of the most challenging ones for young swimmers not only because the technical level (i.e., biomechanical behavior) is relevant but also because of the energetics profile.
Table 2 Correlation Matrix Between Swim Performance and Remains Variables R P value SL (m) -0.23 NS SF (Hz) -0.35 < 0.05 v (m.s-1) -0.52 < 0.01 SI (m2.c-1.s-1) -0.37 < 0.05 hp (%) 0.48 < 0.01 CV (m.s-1) -0.76 < 0.001
Mean data values are somewhat within the range of values reported in the literature for swimmers with similar gender, chronological and biological ages (e.g., 18,31,32). In this sense, it can be speculated that our data are in accordance to main literature. Thus, it is possible to give a step further in the “state of the art” about competitive swimming, exploring the links established between performance, energetic and biomechanical variables in young swimmers. Data dispersion was moderate-high for almost every variable. Moderate-high data dispersion will allow analyzing and confirming significant determinants of swim performance for the pooled data of several swimmers with different competitive levels.
All variables assessed presented significant association with swim performance, except for SL. Higher performances were associated with higher SF, v, SI and CV. Several papers reported similar associations for young (e.g., 20,22) and adult swim-mers (e.g., 8). However, performance was also positive and significantly associated
Figure 2 — Confirmatory path-flow models including nonsignificant paths (2A). SL—stroke
length; SF—stroke frequency; CV—critical velocity; SI—stroke index; ηp—propulsive efficiency; xi→yi—variable yi depends from variable(s) xi; xi↔yi variable xi is associated
to variable yi
Figure 2 — (continued) and deleting nonsignificant paths with subsequent recomputation
of remain data (2B). SL—stroke length; SF—stroke frequency; CV—critical velocity; SI—stroke index; ηp—propulsive efficiency; xi→yi—variable yi depends from variable(s)
xi; xi↔yi variable xi is associated to variable yi
with ηp. It can be hypothesized that efficiency is related to better performances. As described in equation 4, ηp is directly related to v and inversely to SF. Prob-ably young swimmers achieve higher v increasing SL and SF although with more emphasis on the last one. As a consequence, for a reduced range of swim paces, v increases especially due to SF, and therefore hp decreases.
Another redundant explanation is that propulsive efficiency can also be described as:
Equation 7
Where Pd is the mechanical power needed to overcome drag force and Pkin the mechanical power of the kinetic energy transferred to the water from the swimmer.
Pd is computed as:
Equation 8
Where wd is the mechanical work per stroke when submitted to the drag force. So,
Equation 9
On the other hand, Pkin is computed as:
Equation 10
Where mi is the mass of water displaced by the swimmer trying to propeller himself and vi is the velocity of the added mass of water. So, taking into account equations 7, 9 and 10, the increase of the SF will lead to a decrease of the ηp.
One of the main aims of swimming research is to identify determinant param-eters related to competitive level and to understand how they interplay to enhance performance. This kind of research can be developed (5): (i) comparing different competitive level swimmers; (ii) employing neural network; (iii) computing clus-ter analysis or; (iv) developing statistical models to predict performance from the swimmer’s profile. In this last case of statistical modeling, several mathematical procedures can be employed, such as computing: (i) associations between perfor-mance and other variables (i.e., correlation coefficients); (ii) prediction equations for performance based on independent variables (i.e., simple or multiple regression models) or; (iii) prediction of performance based on several independent variables and how they interplay between themselves (i.e., structural equation modeling). Indeed, path analysis has been used in several knowledge areas, such as economy, genetics or epidemiology. However, its use in sport sciences, mainly in the research related to sports performance is almost nonexistent, despite its relevance. Some of the few exceptions are the works by Fogarty et al. (17) and Feltz et al. (15). In this manuscript path analysis was employed mostly to confirm the type of effects suggested on regular basis in the literature for the relationship between swim per-formance, biomechanics and energetic. In the present state of the art of competitive swimming, understanding such relationships is more interesting rather than trying to predict and model swimming performance. The performance modeling can be as much challenging as frustrating if based on today’s knowledge.
Almost every path previously hypothesized was confirmed. The only nonsig-nificant path was the SI-performance one (β = -0.003, p > .05), meaning that the direct effect of the energetic variable in the performance is reduced. However, SI has an indirect effect in the swim performance mediated by the hp (r = .492, p < .01). This means that the ηp has a higher capability to predict performance than SI, resulting in the exclusion of this one from the model. However, from an ecologi-cal point of view, field practitioners can continue using SI as evaluation criteria on regular basis as it has a relationship with swimming performance.
As a measure of the models fit the SRMR was used. Numerically the model is as fit as SRMR is closer to zero. Qualitatively it is possible to define a cutoff value when SRMR is equal or lower than 0.10, meaning that the model adjusts to the theory. Deleting the nonsignificant path SI-performance and recomputing all data, SRMR was 0.06. In this sense, the theoretical model after a smooth change was adjusted.
Only variables that are easy to be assessed by field practitioners were selected to be included in the theoretical model. As a result, it seems that such variables and the interplay reported in Figure 2 can be useful for age-group coaches’ performing training control and evaluation.
The determination coefficient of swim performance was 0.79. It can be stated that qualitatively a high prediction of swim performance was verified. Even so, 21% of swim performance cannot be explained by the variables analyzed. A higher performance predictability and even a decrease of SRMR might be achieved including other biomechanical variables such as speed fluctuation (2), segmental kinematics (4); or energetics ones, e.g., V. O2max and minimum velocity to achieve V. O2max (16,22), energy cost of swimming (3), blood lactate (25) and anaerobic parameters (19,35,38) according to the literature. However, the inclusion of such variables could increase the gap between the theoretical model proposed and practice since the procedures and apparatus to assess these variables are not easily at the disposal of young swimmers’ coaches. Moreover, swimming performance is a multifactorial phenomenon. Predictability could also increase if other scien-tific domains reported in the literature as having strong relationships with swim performance were included in the model, e.g., motor control (33), anthropometry (34,37), hydrodynamics (13,24), genetics (11,28) or psychology (36).
As a matter of fact, some limitations in the study can explain at least part of the prediction model. It might be supposed to increase the model quality if: (i) other biomechanical variables are included in it, such as speed fluctuation or segmental kinematics; (ii) other energetic variables are also included in it, such as oxygen up-take, energy cost, time limit, minimum velocity to achieve V. O2max, oxygen deficit or blood lactate; (iii) instead of estimating propulsive efficiency, assess it using another evaluation method; (iv) include in the model parameters from other knowledge areas, e.g., genetics, motor control, anthropometry, hydrodynamics, psychology, etc. Moreover, it should be stressed that the model is only suitable for young male swimmers performing the 200-m freestyle event in short course.
As a conclusion, the model based on biomechanical and energetic variables, according to the relationships suggested, is appropriate to explain performance in young swimmers. Nevertheless, the model should be expanded, including other variables to increase the prediction level and show a deeper understanding of the swimming performance.
Acknowledgments
The authors would like to acknowledge Ana M. Cruz and Mário C. Marques for their valu-able help during data collection.
References
1. Barbosa, T.M., K.L. Keskinen, R.J. Fernandes, C. Colaço, C. Carmo, and J.P. Vilas-Boas. Relationship between energetic, stroke determinants and velocity in butterfly stroke. Int. J. Sports Med. 26:841–846, 2005.
2. Barbosa, T.M., F. Lima, A. Portela, et al. Relationships between energy cost, swimming velocity and speed fluctuation in competitive swimming strokes. In: Biomechanics and
Medicine in Swimming X, J.P. Vilas-Boas, F. Alves, A. Marques (Eds). Portuguese J. Sports Sci. Supl 2, 2006, pp. 28-29
3. Barbosa, T.M., K.L. Keskinen, R.J. Fernandes, and J.P. Vilas-Boas. The influence of stroke mechanics into energy cost of elite swimmers. Eur. J. Appl. Physiol. 103:139–149, 2008.
4. Barbosa, T.M., R.J. Fernandes, P. Morouço, and J.P. Vilas-Boas. Predicting the intra-cyclic variation of the velocity of the centre of mass from segmental velocities in Butterfly stroke: A pilot study. J Sports Sci Med. 7:201–209, 2008.
5. Barbosa, T.M., J.A. Bragada, V.M. Reis, D.A. Marinho, C. Carvalho, and A.J. Silva. Energetics and biomechanics as determining factors of swimming performance: updat-ing the state of the art. J. Sci. Med. Sports, 2009, DOI
6. Carzola, G. Tests Spécifiques d’évaluation du Nager. Paris: Editions Vigot, 1993. 7. Chatard, J.C., J.M. Lavoie, and J. Lacour. Analysis of determinants of swimming
economy in front crawl. Eur. J. Appl. Physiol. 61:88–92, 1990.
8. Chollet, D., P. Pelayo, C. Tourney, and M. Sidney. Comparative analysis of 100 m and 200 m events in the four strokes in top level swimmers. J Hum Mov Stud. 31:25–37, 1996.
9. Clarys, J.P. The historical perspective of swimming science. In: Biomechanics and
Medicine in Swimming VII, J.P. Troup, A.P. Hollander, D. Strasse, S.W. Trappe, J.M. Cappaert, and T.A. Trappe (Eds.). London: E & FN Spon, 1996, pp. xi–xxxiv. 10. Costa, A.M., A.J. Silva, H. Louro, et al. Can the curriculum be used to estimate critical
velocity in young competitive swimmers? J Sports Sci Med. 8:17–23, 2009. 11. Costa, A.M., A.J. Silva, N.D. Garrido, H. Louro, R.J. Oliveira, and L.B. Granadeiro.
Association between ACE D allele and elite short distance swimming. Eur. J. Appl.
Physiol. XXX: 2009. .
12. Costill, D., J. Kovaleski, D. Porter, R. Fielding, and D. King. Energy expenditure during front crawl swimming: predicting success in middle-distance events. Int. J. Sports Med. 6:266–270, 1985.
13. Costill, D., E. Maglischo, and A. Richardson. Swimming. Handbook of Sports Medicine
and Science. Oxford, UK: Blackwell Scientific Publications, 1992.
14. Craig, A.B., and D. Pendergast. Relationships of stroke rate, distance per stroke and velocity in competitive swimming. Med. Sci. Sports Exerc. 11:278–283, 1979. 15. Feltz, D.L., G.M. Chow, and T.J. Hepler. Path analysis of self-efficiency and diving
performance revisited. J Sport Exer Psychol. 30:401–411, 2009.
16. Fernandes, R.J., V. Billat, A. Cruz, P. Colaço, C. Cardoso, and J.P. Vilas-Boas. Does net energy of swimming affect time to exhaustion at the individual’s maximal oxygen consumption velocity? J. Sports Med. Phyis. Fitness. 46:373–380, 2006.
17. Fogarty, T.D., B. Jensen, H.J. Scheuchenzuber, M.A. Coughlin, and J. Morrison. Pre-diction model using path analysis for the constant speed phase of a 100-m sprint. Med.
Sci. Sports Exerc. 30:S126, 1998.
18. Greco, C.C., and B. Denadai. Critical speed and endurance capacity in young swim-mers: effects of gender and age. Pediatr. Exerc. Sci. 17:353–363, 2005.
19. Griffin, A.J., V.B. Unnithan, and P. Ridges. The physiological effects of swimming competition on 16-17-year-old elite female swimmers. Pediatr. Exerc. Sci. 11:22–31, 1999.
20. Hill, D.W., R.P. Steward, and C.J. Lane. Application of the critical power concept to young swimmers. Pediatr. Exerc. Sci. 7:281–293, 1995.
21. Hu, L., and P.M. Bentler. Cutoff criteria for fit indexes in covariance structure analysis: Conventional criteria versus new alternatives. Struct. Equ. Modeling. 6:1–55, 1999. 22. Jurimae, J., K. Haljaste, A. Cichella, et al. Analysis of swimming performance from
physical, physiological and biomechanical parameters in young swimmers. Pediatr.
Exerc. Sci. 19:70–81, 2007.
23. Kilika, R.J., and W.G. Thorland. Physiological determinants of sprint performance in children and young adults. Pediatr. Exerc. Sci. 6:59–68, 1994.
24. Kjendlie, P.L., F. Ingjer, O. Madsen, R.K. Stallman, and J. Stray-Gundersen. Differences in the energy cost between children and adults during front crawl swimming. Eur. J.
Appl. Physiol. 91:473–480, 2004.
25. Latt, E., J. Jurimae, K. Haljaste, A. Cicchella, P. Purge, and A.T. Jurimae. Physical development and swimming performance during biological maturation in young female swimmers. Coll. Antropol. 33:117–122, 2009.
26. Lavoie, J.M., and R. Montpetit. Applied physiology of swimming. Sports Med. 3:165–188, 1986.
27. Martin, R.B., R.A. Yeater, and M.K. White. A simple analytical model for the crawl stroke. J. Biomech. 14:539–548, 1981.
28. Nazarov, I., D. Woods, H. Montgomery, et al. The angiotensin convenrting enzyme I/D polymorphism in Russian athletes. Eur. J. Hum. Genet. 9:797–801, 2001.
29. Pendergast, D.R., C. Capelli, A.B. Craig, et al. Biophysics in swimming. In:
Biome-chanics and Medicine in Swimming X, J.P. Vilas-Boas, F. Alves, A. Marques (Eds). Portuguese J. Sports Sci. Supl 2, 2006, pp. 185-189
30. Poujade, B., C. Hautier, and A. Rouard. Determinants of the energy cost of front-crawl swimming in children. Eur. J. Appl. Physiol. 87:1–6, 2002.
31. Reis, J., and F. Alves. Training induced changes in critical velocity and V4 in age group swimmers. In: Biomechanics and Medicine in Swimming X, J.P. Vilas-Boas, F. Alves, A. Marques (Eds). Portuguese J. Sports Sci. Supl 2, 2006, pp. 311-313
32. Schidt, A., and B.E. Ungerechts. The effect of cognitive intervention on stroke distance in age-group swimmers. In: The Book of Proceedings of the 1st International Scientific
Conference of Aquatic Space Activities, T. Nomura, B.E. Ungerechts (Eds.) Tsubuka: University of Tskuba, 2008, pp. 380-387
33. Seifert, L., D. Chollet, and J.C. Chatard. Kinematic change during a 100-m Front Crawl: effects of performance level and gender. Med. Sci. Sports Exerc. 39:1784–1793, 2007. 34. Silva, A.J., A.M. Costa, P.M. Oliveira, et al. The use of neural network technology to
model swimming performance. J Sports Sci Med. 6:117–125, 2007.
35. Soares, S.M., L. Machado, A.B. Lima, et al. Velocimetric characterization of a 30 sec maximal test in swimming: consequences for bioenergetical evaluation. In:
Biome-chanics and Medicine in Swimming X, J.P. Vilas-Boas, F. Alves, A. Marques (Eds). Portuguese J. Sports Sci. Supl 2, 2006, pp. 265-268.
36. Thenopoulos, V. (2006). State of pre-competitive anxiety among swimmers and water polo players in relation to competitive experience. In: Biomechanics and Medicine in
Swimming X, J.P. Vilas-Boas, F. Alves, A. Marques (Eds). Portuguese J. Sports Sci. Supl 2, 2006, pp. 343-346.
37. Tuuri, G., and M. Loftin. Comparison of Hydrodensitometry, skinfold thickness, and dual-energy X-ray absorptiometry for body fat estimation in youth swimmers. Pediatr.
Exerc. Sci. 13:238–245, 2001.
38. van Praagh, E. Symposium Proceedings - Development of anaerobic function during childhood and adolescence. Pediatr. Exerc. Sci. 12:150–173, 2000.
39. Wakayoshi, K., K. Ikuta, T. Yoshida, et al. Determination and validity of critical veloc-ity as an index of swimming performance in the competitive swimmer. Eur. J. Appl.
Physiol. Occup. Physiol. 64:153–157, 1992.
40. Zamparo, P., D. Pendergast, J. Mollendorf, A. Termin, and A. Minetti. An energy bal-ance of front crawl. Eur. J. Appl. Physiol. 94:134–144, 2005.
41. Zamparo, P. Effects of age and gender on the propelling efficiency of the arm stroke.
Eur. J. Appl. Physiol. 97:52–58, 2006.