Periódico Trimestral, digital e gratuito publicado pela Academia Brasileira de Ciências Contábeis | Available online at www.repec.org.br
REPeC, Brasília, v. 14, n. 1, art. 3, p. 34-55, Jan./Mar. 2020 | DOI: http://dx.doi.org/10.17524/repec.v14i1.2375 | ISSN 1981-8610
Abstract
Objective: This study proposes an instrument to assess active and passive transparency among teaching institutions from the perception of social actors.
Method: The proposed questionnaire was applied to assess active and passive transparency from the perspective of social actors in a teaching institution. The questionnaire was validated in a sample of 1,070 stakeholders, based on techniques to analyze convergent and discriminant validity, along with tests of the reliability and one-dimensional nature of the questionnaire.
Results: The instrument was assessed using various validity measures and presented satisfactory results that indicate its applicability. A detailed method is presented for its application and classification, which allows teaching institutions to assess their transparency based on the instrument’s dimensions (Institutional Management, Information Access) or to obtain an overall perception (Active Transparency and Passive Transparency).
Contributions: The instrument proposed here is a pioneer in the joint assessment of active and passive transparency among teaching institutions considering the perspective of social actors, which grants public managers a comprehensive view of transparency-related actions based on the assessment of these actors. Keywords: Management; Universities; Scale; Law on Access to Information
Kelmara Mendes Vieira
https://orcid.org/0000-0002-8847-0941 | E-mail: profkelmara@gmail.com Daniela Pegoraro
https://orcid.org/0000-0001-8946-1169 | E-mail: danielapillon@yahoo.com.br Monize Sâmara Visentini
https://orcid.org/0000-0001-6233-6106 | E-mail: monize.visentini@uffs.edu.br
Perception of Active and Passive Transparency
in Teaching Institutions: proposal and
1. Introduction
Transparency in public institutions is one of the basic mechanisms to obtain credibility and quality management (Relly, 2012). This premise consolidates legal actions applied by the Brazilian government in recent years, indicating considerable advancements in the search for transparency, such as Complementary Law No. 101 (Fiscal Responsibility Law, LRF, 2000), Complementary Law No. 131 (2009), Law No. 12,527 (Law of Access to Information, LAI, 2011), and Decree No. 8,777 (2016).
Complementary Law No.101/2000 is considered a landmark in public finances for having established transparency of information as one of its basis, thus, making it possible for the society to monitor public accounts (Rodrigues Jr. & Salgueiro, 2015). Thus, public entities started disseminating its plans, budgets and budget guidelines, accountability and respective reports, Fiscal Management Report and Summary Report on Budget Execution, as well as the simplified versions of these documents (Possamai & Schindler, 2017).
In 2009, Complementary Law No131, called Capibaribe or Transparency Act, was created to complement LRF with devices intended to detail the mechanisms of fiscal management Transparency. This law was determinant in the creation of transparency-content webpages by all entities in the Federation to disseminate budgetary and financial execution information of government actions, promoting more democratic management of public resources.
Consolidating advertising as a rule and secrecy as an exception, Law No.12.527/2011 establishes that transparency is the possibility of any citizen to request access to public information, with exception of confidential documents, according to rules, deadlines, instruments of control and resources as provided by law. Thus, it defines instruments and competencies that ensure the right to information, changing the way citizens relate with the Government and with the public sector, introducing the concept of passive transparency. The most recent policy of transparency, Decree No.8.777/2016, instructs institutions to make public data available without restrictions and in formats that allow them to be reused, regardless of the purpose.
This legislation also applies to public higher education institutions, while different stakeholders1
have demanded greater transparency and accountability from these institutions given their level of autonomy (De La Torre & Torres, 2016). Additionally, universities need to redefine their online role in the society, building a sustainable, authentic and transparent, digital identity to provide information and dialogue with all those involved and participating in the construction of knowledge (Lara, 2009).
The disclosure of information on the part of universities through their webpages consolidates active transparency, provided for in Art. 8th of LAI, that is, public agents proactively disseminate information of
interest to citizens without the need for a request. Active transparency benefits both citizens and public entities. The first is benefited because there is no need to request information from a public entity if it is already made easily accessible and institutions are benefited because it saves time and resources to the extent there are fewer requests for information (CGU, 2013).
Passive transparency, provided in Art. 10th of LAI, takes place whenever requests for information are
submitted to channels such as the e-Sic [Electronic Services of Citizen Information] or Ombudsperson. In the words of Michener, Contreras and Niskier (2018, p.611), “passive transparency represents a ‘more demanding test’ of a commitment with public information access” and is employed when a public entity is requested by a citizen to provide non-confidential information that is of general or collective interest (CGU, 2013).
1 Stakeholders include courts of accounts, Controller General of Accounts (CGU), Public Ministry of the Union, Ministry of Education (MEC), the National Institute for Educational Studies and Research Anísio Teixeira (Inep), among other public inspection and control agencies, in addition to civil society.
Assessments of LAI regulation performed by Brazilian public universities (Monteiro, 2014; Pessôa, Canuto, Costa & Almeida, 2018; Melo, 2019) show that these institutions need to advance concerning the implementation of transparency, as an information disclosure culture is not predominant. Such a scenario is not different from that portrayed by the analysis performed by Abello-Romero, Mancilla, Molina and Palma (2018) of Latin-American universities, which shows the low level of dissemination of information among these institutions.
Monteiro (2014) assesses the websites of 53 Brazilian federal universities and reports that none of these universities has fully complied with LAI devices, though some had disseminated relevant amount of information. Pessôa et al. (2018) analyzed the websites of 59 federal universities and identified an average level of information disclosure (66.32%).
More recently, Melo (2019) assessed the websites of the 20 largest Brazilian federal universities reporting that in general, they presented a low level of active transparency, as information provided was either incomplete or not sufficiently clear. The author notes the low engagement of these federal universities to comply with LAI since it was instituted, may explain, at least in part, the growing number of requests submitted by users/citizens to SIC [Citizen Information Service].
Based on these considerations, this study’s objective was to contribute to institutional management, as an incentive or motivation, to improve the structure to obtain higher levels of efficiency in terms of transparency –e.g., qualification, punctuality and updating of information available in the websites of teaching institutions. Such efficiency reflects clear communication is established with society, facilitating access to information. For that, we seek to answer the following research problem: How do we measure the perception of social actors about active and passive transparency among teaching institutions? Based on this question, this study’s general objective was to propose an instrument2 to assess active and
passive transparency among teaching institutions from the perceptive of social actors.
Because universities are also a means to achieve social change, more than ensuring compliance with legal standards, they should consider initiatives to implement transparency as a policy of responsible management that favors the exercise of citizenship. Understanding the effects of this policy is essential to monitor and qualify management. The central idea of the questionnaire validated here is to enable managers to identify how social actors perceive their institutions’ transparency actions based on characteristics of active transparency, considering aspects inherent to institutional management, information access and passive transparency.
The innovative nature of the instrument we propose in this study lies in two aspects. The first is the fact it is a precursor in the assessment of transparency among teaching institutions from the perspective of social actors. No other studies with a similar proposal were found on the3. Existing studies (e.g.,
Monteiro, 2014; Pessôa, Canuto, Costa & Almeida, 2018; Melo, 2019) assess the websites of Brazilian public universities using a strategy to structurally observe LAI regulation, not taking into account the perception of users/citizens, which is the emphasis proposed here.
The second aspect is directly related to the fact the instrument addresses two forms of transparency (active and passive transparency), enabling public managers to have a more comprehensive view on how successful transparency-related actions are based on the assessment performed by social actors. This additional aspect is in agreement with is proposed by Silva and Bruni (2019), that when measuring attributes that represent each form of transparency, one has a better understanding of transparency antecedents, considering that “the same public entity may have different results depending on whether the focus is on passive or active aspects, or both aspects” (p. 429). This proposed instrument is relevant given the complexity inherent to teaching institutions, which demand an ongoing assessment and control process so that this instrument can be used as a tool to monitor transparency indicators.
2. Theoretical framework
Some characteristics are reported in the literature as antecedents of the perception of active transparency such as those linked to institutional management. Flórez-Parra, Pérez and López-Hernández (2017) note that the level of perceived transparency depends on the universities’ strategic plans and therefore, would be linked to the mission, vision and values of an institution. The authors also note that the mission represents the identity and personality of an institution and should be seen as the driver of social responsibility and sustainable development. It is linked to institutional policies, especially teaching, research (Eckel, 2008) and extension.
Visintin, Dechen and Neves (2009) also mention transparency is indispensable in all relations established with society, as it positively contributes to the management of social responsibility and sustainable development, considered ethical complementary actions in the role of universities. Additionally, there are indications that transparency impacts an institution’s planning and organization, as when it establishes and disseminates its strategies and policies, an institution must also establish goals and deadlines and comply with both as society supervises its actions.
Bairral, Silva and Alves (2015) verified that to make their actions transparent, public entities providing education are very clear and exact in their account-giving, as demanded by law, such as LAI, e.g., reporting the use of financial resources, considering that it is a renowned practice in the fight against corruption. Nonetheless, as noted by Relly (2012), it is important to have in mind how society sees the relationship between transparency and the fight against corruption, considering that merely complying with a law determining access to information does not suffice to ensure that a true policy of transparency has been implemented nor that there is any interest in acting to dismantle corruption.
Communication established with society is central to institutional management for actions to be transparent, while one of LAI’s premises is the active maintenance of communication and service to citizens (CGU, 2013). For this reason, these institutions must provide ample access to information by adopting channels that ensure efficient and efficacious communication (Saraite-Sariene, Rodríguez & Rosario, 2018). Considering information access, the second construct associated with active transparency in this study, Saraite-Sariene et al. (2018) highlight the importance of disclosing information that concerns a university’s organization and governance. Information includes distribution of management positions, policies and regulations (e.g., student mobility programs), selective processes, competitions and biddings, and management of resources (public or not).
Understanding the perceptions of citizens of such information and related procedures are essential for public managers, considering irregularities appointed by Dalto, Nossa and Martinez (2014), such as a lack of instruments of control used by Federal universities to account for the resources originating from agreements established with Support Foundations. The authors also note the notorious transfer of “responsibilities and tasks that are exclusive of Public Administration, such as organizing public competitions, purchasing goods and services, and outsourcing” (p. 19), from Federal universities to Foundations.
Alerts such as these contributed to include statements in this instrument concerning the perception of social actors about the transparency of student selection processes, public competitions, and use of public resources, elements that may be under the management of Support Foundations but neglected on the part universities’ management. Understanding how society views transparency in terms of information access may be a way of university managers to acknowledge and address the need to improve institutional processes.
Concerning passive transparency, Alvarenga (2017) developed a ranking to classify the 63 federal universities existing in Brazil. Of these, 37 answered all requests of information within 20 days, though some neglected SIC as being “an instrument to interact and be transparent with society” (p. 1). However, worse than exceeding legal deadlines, some institutions did not respond to most of the requests. Considering 2016, the author notes that from a total of 9,903 requests, 157 requests were addressed per federal teaching institution on average.
These figures indicate the importance of establishing effective communication channels between institutions and society. The punctuality of answers, though, is not the only factor to be considered, as the quality of information is also relevant. Thus, with that in mind, this study assesses the characteristics of information provided by institutions, which may impact the satisfaction of applicants. CGU (2013) establishes that clear and objective language must be used, to ensure that communication meets the demands of applicants and the messages of public entities are fully comprehended.
Flórez-Parra et al. (2017) note there is greater demand for relevant and reliable information be provided by universities while Figueiredo and Santos (2013) add that social actors need to assimilate data provided so that entities need to ensure they provide information that is sufficient to satisfy the receiving audience. Thus, it is the responsibility of public institutions to provide clear, complete and easily understood information while information is considered transparent when all these requirements are met. The constructs Institutional Management and Information Access are dimensions that compose Active Transparency, thus, might be associated. This association is apparent especially when variables concerning the management of public resources are added in both dimensions, considering that “accountability is a necessity as such information may be related to the proof of expenses or how resources were managed” (Dalto et al., 2014, p. 9). Additionally, Saraite-Sariene et al. (2018) note that information disclosure is related to aspects linked to the organization and governance of teaching institutions.
The literature addressed in this section also assumes the existence of a direct relationship between both dimensions of active transparency and perceived transparency. Thus, the following hypotheses emerge in the proposed model:
• H1: Access to information is associated with institutional management • H2.1: Access to information impacts the perceived level of transparency • H2.2: Institutional management impacts levels of perceived transparency
A general measure of perceived transparency was developed to assess hypotheses H2.1 and H2.2, in which respondents score from 0 to 10 their perceptions regarding an institution’s level of transparency while 0 represents lack of transparency and 10 represents the perception of total transparency.
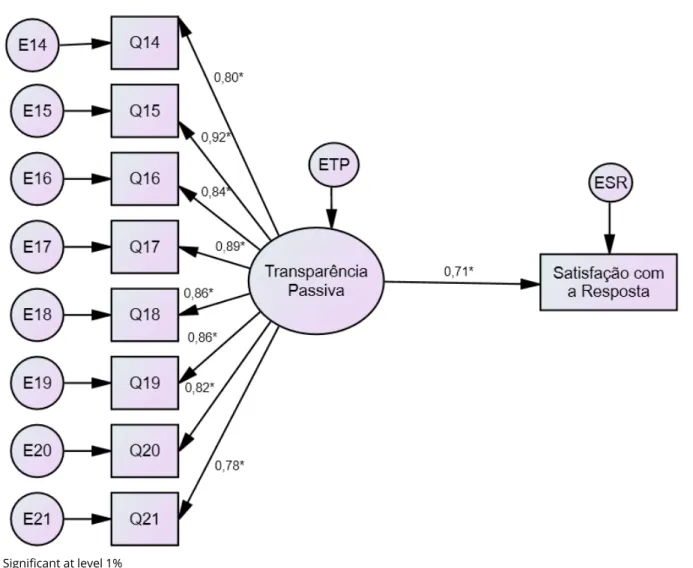
Also, considering documents and studies consulted (CGU, 2013; Figueiredo & Santos, 2013; Flórez-Parra et al., 2017), we understand that the construct Passive Transparency should be directed related with the general measure of Satisfaction with Answer Provided. Thus, we have the following hypothesis:
• H3: Passive Transparency directly impacts Satisfaction with Answer Provided.
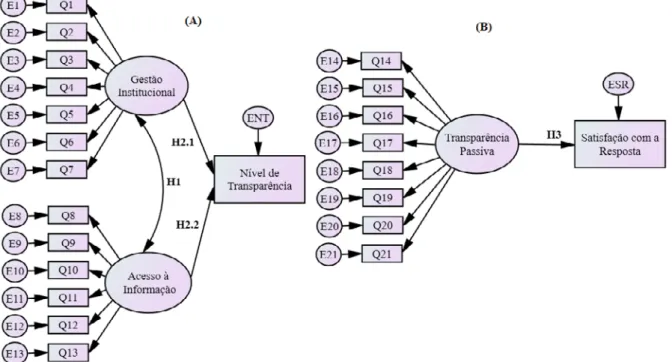
A score, from 0 to 10, is assigned by applicants to classify their Satisfaction with Answer Provided, in which 0 means not satisfied and 10 completely satisfied. Figure 1 synthesizes the theoretical models presented in this section. Letter S represents the statements; letter E represents errors in each statement; while the constructs and latent dimensions are represented by their respective ellipses.
Figure 1. Theoretical Models of Active (A) and Passive (B) Transparency
Source: developed by the authors (2019)
Translation: Institutional Management; Information Access; Level of transparency; Passive transparency; Satisfaction with answer.
Representation (A) refers to the theoretical model of Active Transparency, composed of the constructs Institutional Management and Information Access, both associated (H1) and directly impacting Perception of Transparency (H2.1 and H2.2, respectively). Representation (B), refers to the model of Passive Transparency, a construct composed of eight statements, and which directly impacts Satisfaction with Answer Provided (H3). Concerning the different social actors, model represented in (A) is considered to apply to all actors, while the scale for Passive Transparency (B) applies only to individuals who request information via SIC, e-SIC or ombudsperson, sector of protocols or other channels.
3. Methodology
This section describes methodological procedures using in this study. The stages used to develop and validate this instrument are initially reported and afterwards, the sample and its application are explained in detail.
3.1 Questionnaire construction and validation
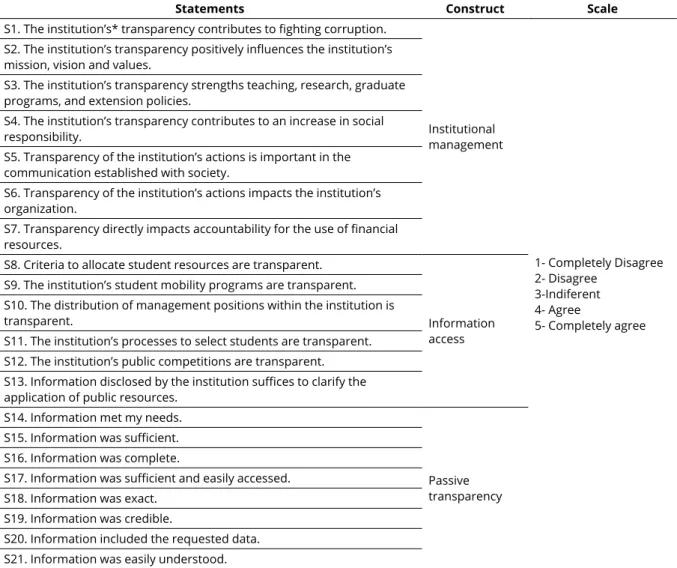
The instrument proposed in this study is based on the category active transparency, as a measure to estimate the perception of transparency and, the category of passive transparency is intended to measure the satisfaction of applicants with the answers provided by the institutions. An analysis of the institutional management and disclosure of organizational processes, dimension defined here as information access, is considered for active transparency. The assessment of passive transparency takes into account the characteristics of information provided to applicants according to the expected precepts of information of a public nature. The statements composing each of the three constructs contained in the model, as well as the measurement scale, were based on the theoretical framework as presented in Figure 2.
Statements Construct Scale
S1. The institution’s* transparency contributes to fighting corruption.
Institutional management 1- Completely Disagree 2- Disagree 3-Indiferent 4- Agree 5- Completely agree S2. The institution’s transparency positively influences the institution’s
mission, vision and values.
S3. The institution’s transparency strengths teaching, research, graduate programs, and extension policies.
S4. The institution’s transparency contributes to an increase in social responsibility.
S5. Transparency of the institution’s actions is important in the communication established with society.
S6. Transparency of the institution’s actions impacts the institution’s organization.
S7. Transparency directly impacts accountability for the use of financial resources.
S8. Criteria to allocate student resources are transparent.
Information access S9. The institution’s student mobility programs are transparent.
S10. The distribution of management positions within the institution is transparent.
S11. The institution’s processes to select students are transparent. S12. The institution’s public competitions are transparent. S13. Information disclosed by the institution suffices to clarify the application of public resources.
S14. Information met my needs.
Passive transparency S15. Information was sufficient.
S16. Information was complete.
S17. Information was sufficient and easily accessed. S18. Information was exact.
S19. Information was credible.
S20. Information included the requested data. S21. Information was easily understood.
*We suggest replacing the term “institution” by the name of the institution when applying the instrument.
Figure 2. Definition of statements that concern constructs of active and passive transparency and respective scale
Validation followed the constructs’ theoretical development and was performed in two stages: the objective of the first was to obtain content validation and apply a pretest while the second stage, having the sample data in hands, was intended to verify the validity of the model.
Content validation is an essential step in the development of new measures because it represents mechanisms used to associate abstract concepts with observable and measurable indicators (Wynd, Schmidt & Schaefer, 2003). It consists of verifying the extension in which the items of a measure correspond to content (Rubio, Berg-Weger, Tebb, Lee & Rauch, 2003), that is, the extent to which a question/statement contributes to form a construct. As suggested by Lynn (1986), the content validation process followed the development and judgment stages. The stage of development included the construction of each construct, the generation of items, and the development of the instrument (Figure 2).
The judgment stage was conducted using the technique of expert committee, followed by a pretest among individuals with characteristics similar to those of the study’s participants but from an institution different from that from where the study sample would be drawn. The committee was composed of three experts in the subject, who received the questionnaire along with an explanatory letter, providing clarification regarding the instrument’s objectives, definition of the constructs, and instructions. The assessment showed that the version we proposed presented appropriate semantics and that the statements represented what they were intended to. No major changes were proposed, only small adjustment on the scoring.
A pretest was then performed with 15 individuals, students, professors, and administrative technicians in the field of education. Again, the questionnaire semantic assessment was considered appropriate and, according to the respondents, the statements were coherent to the social and occupational context.
After the first stage, the instruments were applied, initiating the second stage in which we adopted procedures to verify convergent validity, its one-dimensional nature, and discriminant validity of the constructs, as well as adjustment of the integrated model.
Convergent validity measures the extent to which a latent variable is positively related to the expressed variables intended to measure the same latent variable (Garver & Mentzer, 1999). An analysis of the reliability of the scales along with Confirmatory Factor Analysis was performed to check for convergent validity.
Assessment of reliability of a scale indicates the degree of internal consistency among the multiple indicators of a construct, that is, the extent to which an instrument produces coherent results based on the various measurements (Schumacker & Lomax, 1996). The analysis was conducted based on three indicators: Cronbach’s alpha, Composed Reliability, and Average Variance Extracted (AVE). The Cronbach’s alpha and the reliability index verify the internal consistency of the aggregated scale based on the mean correlation among pairs of indicators. AVE reflects the total variance of indicators accruing from the latent construct. High AVE indicates that the expressed variables represent the latent variables.
Confirmatory Factor Analysis (CFA) was also conducted for convergent validity, which involves the specification and estimation of one or more hypothetical models of factor structure, where each of the models proposes a set of latent variables that should be considered to obtain covariances in a set of observed variables (Koufteros, 1999). A variance-covariance matrix, maximum likelihood estimation and bootstrap method were used in the estimation process. Bootstrap estimation was chosen to obtain greater precision of the estimated values (Byrne, 2010). As suggested by Cheung and Lau (2008), bootstrap was estimated with a sample size of 1,000.
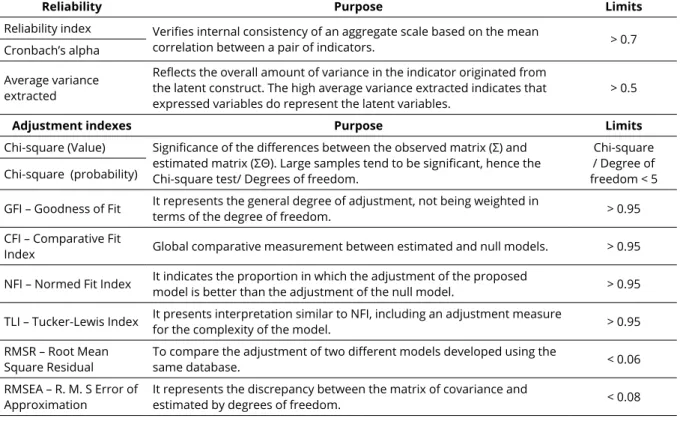
The convergent validity of each construct was analyzed by observing the magnitude and statistical significance of standardized coefficients as well as adequacy to absolute adjustment indexes. Figure 3 presents indexes of reliability and adjustment, their respective purposes and limits suggested.
Reliability Purpose Limits
Reliability index Verifies internal consistency of an aggregate scale based on the mean
correlation between a pair of indicators. > 0.7
Cronbach’s alpha Average variance extracted
Reflects the overall amount of variance in the indicator originated from the latent construct. The high average variance extracted indicates that
expressed variables do represent the latent variables. > 0.5
Adjustment indexes Purpose Limits
Chi-square (Value) Significance of the differences between the observed matrix (Σ) and estimated matrix (ΣΘ). Large samples tend to be significant, hence the Chi-square test/ Degrees of freedom.
Chi-square / Degree of freedom < 5 Chi-square (probability)
GFI – Goodness of Fit It represents the general degree of adjustment, not being weighted in terms of the degree of freedom. > 0.95 CFI – Comparative Fit
Index Global comparative measurement between estimated and null models. > 0.95 NFI – Normed Fit Index It indicates the proportion in which the adjustment of the proposed model is better than the adjustment of the null model. > 0.95 TLI – Tucker-Lewis Index It presents interpretation similar to NFI, including an adjustment measure for the complexity of the model. > 0.95 RMSR – Root Mean
Square Residual To compare the adjustment of two different models developed using the same database. < 0.06 RMSEA – R. M. S Error of
Approximation It represents the discrepancy between the matrix of covariance and estimated by degrees of freedom. < 0.08
Figure 3. Reliability and Adjustment Indexes, their respective purposes and limits suggested
Source: Developed by the authors based on Hu and Bentler (1999), Byrne (2010); Hair, Black, Babin, Anderson and Tatahm. (2010); Hooper, Coughlan e Mullen (2008) and Kline (2011).
The one-dimensional nature of each construct was also assessed, that is, the degree in which a set of items represents only one construct (Garver & Mentzer, 1999). This assessment was performed by identifying standardized residue related to the indicators of each latent variable. Standardized residue with high values (higher than 2.58) may indicate items are not one-dimensional, thus, are inappropriate (Hair et al., 2010).
The test of difference of Chi-squares was used to verify discriminant validity between the model’s constructs. This test consists of developing submodels for each possible pair of constructs of the measurement model. A fixed correlation, equal to one, is established in the first model (called restrict) between the pair of constructs while correlation is free in the second submodel. A significant difference between the Chi-squares of the respective models is evidence of discriminant validity (Pedhazur & Schmelkin, 1991, Anderson & Gerbing, 1988, Garver & Mentzer, 1999). When differences are higher than 3.84 (p<0.05 for one degree of freedom) we say there is discriminant validity.
To assess the integrated models, which include the constructs and relationships, the coefficients and respective significances were assessed along with adjustment indexes proposed in Figure 3. Finally, to facilitate the use of the instrument proposed here, a methodology was developed for its application (section 4.2), which allows the institutions using it to classify their level of transparency.
3.2 Sample and questionnaire application
The questionnaire was applied in person between October and November 2018 in a federal teaching institution located in Rio Grande do Sul, Brazil. This institution has a total of 4,068 stakeholders among professors, students, and administrative technicians in the field of education. Thus, for a sample error of 3%, with a 95% confidence interval and a finite population, we have a minimum sample of 847. At the end of data collection, we had 1,070 respondents for the statements concerning active transparency, 71 of whom had already used SIC, e-SIC or ombudsperson and also completed the questionnaire concerning passive transparency.
This number of respondents also meets the recommendations to apply the modeling technique of structural equations in which the minimum sample size should be significantly larger than the number of covariances or correlations in the data entry matrix. Landis, Beal and Tesluk (2000) consider that a minimum of five respondents is required for each parameter estimated (5:1), while a ratio of 10 respondents per parameter (10:1) is more appropriate. According to Hair et al. (2010), when data violate the assumption of normality, the ratio needs to be 15 respondents per parameter (15:1). Thus, considering the model of active transparency has a total of 55 parameters, the sample is appropriate even in the case of deviation from normality.
Concerning the profile of the 1,070 respondents, most were women (52.1%), single (74.8%), aged up to 20 years old (51.5%). About income, 41.8% have an income of up to R$5,875.75 and only one-eighth earn more than R$17,627.25. In terms of education, most (68.7%) had attended vocational high school, while (17.4%) had an undergraduate degree.
This study complied with ethical guidelines (CAAE: 98394718.1.00005346).
4. Results and Analyses
This section presents the results of this investigation, that is, the application of a questionnaire including its convergent validity, one-dimensional nature, the constructs’ discriminant validity as well as adjustment of the integrated model. Finally, based on the results, we propose a method to assess transparency that can be adopted by institutional managers.
4.1 Validation of the model
The first stage of empirical validation consisted of the individual validation of the constructs, which involved convergent validity, reliability, one-dimensional nature, and discriminant validity
Initially, confirmatory factor analysis and reliability measures were used to analyze convergent validity and reliability. Table 1 presents the results of the measures in the initial and final estimation for each of the three theoretical constructs.
Table 1
Adjustment and Reliability Indexes of the Initial and Final Models for the constructs of Institutional Management, Information access, and Passive Transparency.
Indexes
Institutional
Management Information Access Passive Transparency Initial
Model Final Model ModelInitial ModelFinal ModelInitial ModelFinal
Chi-square (value) 234.170 11.916 210.863 9.583 47.800 25.546
Chi-square (probability) 0.000 0.218 0.000 0.143 0.000 0.111
Degrees of freedom 14 9 9 6 20 18
Chi-square / Degrees of freedom 16.726 1.324 23.429 1.597 2.390 1.419
GFI - Goodness of Fit 0.941 0.997 0.938 0.997 0.868 0.926
CFI - Comparative Fit Index 0.932 0.999 0.911 0.998 0.947 0.986
NFI - Normed Fit Index 0.928 0.996 0.908 0.996 0.913 0.954
TLI- Tucker-Lewis Index 0.898 0.998 0.852 0.996 0.925 0.978
RMR - Root Mean Square Residual 0.049 0.013 0.088 0.019 0.053 0.041
RMSEA - R. M. S Error of Approximation 0.119 0.017 0.142 0.023 0.141 0.077
Reliability index 0.868 0.857 0.834 0.816 0.952 0.952
Cronbach’s alpha 0.853 0.853 0.854 0.854 0.951 0.951
Average Variance Extracted 0.488 0.467 0.457 0.426 0.713 0.713
Source: developed by the authors (2019).
The results for the initial models indicate that three constructs do not meet the Chi-square criterion and at least one of the adjustment indexes was below the recommended, 0.95. Hence, we opted for the strategy of an improved model in which, generally two main actions are recommended: the removal of items and the inclusion of correlation between the items’ errors. In this case, we chose to include the correlations between errors of the items belonging to the same construct.
After this procedure, Chi-square became insignificant; GFI, CFI, NFI and TLI reached the recommended value of 0.95 (except GFI for Passive Transparency); RMR and RMSA were below 0.06 and 0.08, respectively; while the reliability index and Cronbach’s alpha remained above 0.7. The Average Variance Extracted for the two constructs Institutional Management and Information Access was slightly lower than 0.5. However, because these constructs presented appropriate values in two other reliability measures, we considered them to be reliable.
The one-dimension nature of the three constructs was then verified. No standardized residue above 2.58 was found, indicating the constructs had one dimension. The test of difference of chi-squares was used for the discriminant validity. Table 2 presents the chi-square values and degrees of freedom for the restricted and free models, in addition to the difference of chi-squares.
Table 2
Test of Difference of Chi-Squares for the constructs Information Access, Institutional Management and Passive Transparency
Constructs Restrict Model Free Model
Difference of chi-squares Qui-square GL Qui-square GL Value
Information access and Institutional Management 262.22 57 151.93 56 110.30** Institutional Management and Passive Transparency 193.51 83 162.67 82 30.84** Information access and Passive Transparency 113.51 72 88.90 71 24.61** ** significant at 5%
Source: developed by the authors (2019)
All combinations between the three constructs were tested. The chi-square values of the restricted model were significantly higher than the free model values, confirming discriminant validity between the constructs. Therefore, the three constructs were considered to be appropriate and met criteria established for convergent validity, reliability, one-dimensional nature, and discriminant validity. Thus, the integrated model was then analyzed, which considers both the constructs as well as their relationships. Table 3 presents the adjustment indexes of the initial and final models and Figures 4 and 5 present the models for active and passive transparency, respectively.
Table 3
Adjustment indexes for the Models of Active and Passive Transparency
Indexes Active Transparency Passive Transparency
Chi-square (value) 207.932 28.107
Chi-square (probability) 0.000 0.303
Degrees of freedom 66 25
Chi-square / Degrees of freedom 3.150 1.124
GFI - Goodness of Fit 0.974 0.928
CFI - Comparative Fit Index 0.977 0.953
NFI - Normed Fit Index 0.967 0.992
TLI- Tucker-Lewis Index 0.969 0.994
RMR - Root Mean Square Residual 0.055 0.043
RMSEA - R. M. S Error of Approximation 0.044 0.042
Source: developed by the authors (2019).
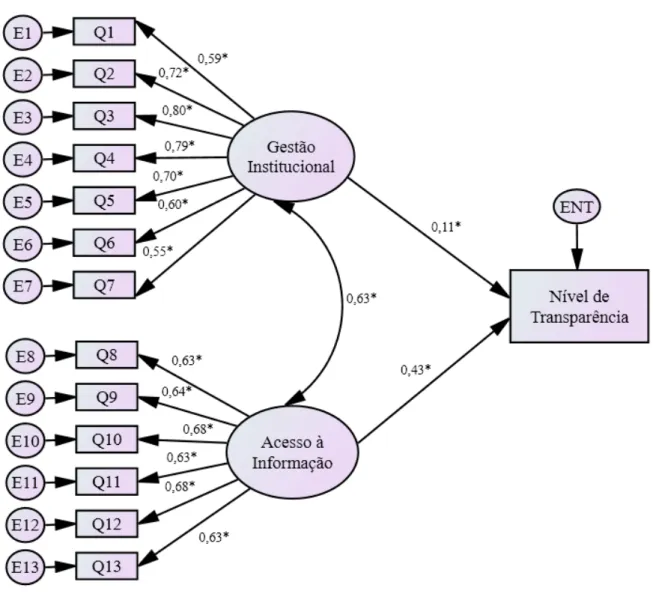
All the adjustment indexes achieved appropriate limits for the model of Active Transparency, except the Chi-square, which was significant. Considering that one the problems presented by the chi-square refers to its sensitiveness to sample size (Garver & Mentzer, 1999), the ratio chi-square/degrees of freedom was analyzed, which presented a result below five, confirming the model is appropriate. All the adjustment indexes of the model Passive Transparency were appropriate as well.
Note there is a correlation of 0.63 (Figure 4) between the constructs Institutional Management and Information Access, which corroborates hypothesis H1 expected in the theoretical model and is in agreement with the discussion proposed by Dalto et al. (2014), which concern the bivalent role of transparency of accounts and public resources, which support both the development of policies and organizational management and allows the society to monitor how these resources are used. Note that articles 7th and 8th of
LAI establish the mandatory disclosure of information concerning the transfer of financial resources, public expenditure, management of public assets, use of public resources and biddings, for instance.
Significant at 1%
For simplicity, the correlations between errors were omitted, but are listed in Appendix A.
Figure 4. Standardized Coefficients and Significance for the Model of Passive Transparency Source: developed by the authors (2019).
Translation: Institutional Management; Information Access; Level of transparency
Hypotheses H2.1 and H2.2 were also valid, indicating that Institutional Management and Information Access are antecedents of Perception of Transparency. Saraite-Sariene et al. (2018) highlight that universities understand the importance of allowing ample access to more generalized information but do not value the importance of responding to the growing demand for specific information concerning organizational structure, governance, management and financial issues, which directly impacts transparency. It reinforces this study’s results, which suggest that the impact of the construct Information Access is superior to that of Institutional Management.
In this sense, CGU (2013) already instructed in its guidelines to apply LAI that clear communication that facilitates understanding of information and data on the part of citizens must be the goal of public
Significant at level 1%
For simplicity, the correlations were omitted here but are listed in Appendix A.
Figure 5. Standardized Coefficients and Significance for the Model of Passive Transparency Source: developed by the authors (2019).
Translation: Passive transparency; Satisfaction with answer
Finally, each of the respondents completed the instrument at once, which could lead to associations between factors due to the method bias (common method variance), a type of bias that tend to affect studies applying questionnaires (Chang, van Witteloostuijn & Eden, 2010; Gorrell, Ford, Madden, Holdridge & Eaglestone, 2011), so that Harman’s single factor test (Podsakoff, MacKenzie, Lee & Podsakoff, 2003) was used, which indicated a percentage of variance extracted of 38.66%, suggesting there were no problems of common variance.
The conclusion, after performing these validation processes, is that the theoretical models proposed were confirmed according to empirical estimations, indicating that both the constructs and relationships were appropriate for the sample used.
4.2 Classification of Transparency: assessment methodology
To enable teaching institutions to acquire a view of perceived transparency based on the model proposed, we opted for developing a methodology to assess both the dimensions of transparency and the institutions’ overall transparency. The results obtained in the sample in which this study was validated were used to propose this methodology.
Hence, the definition of weights, obtained by dividing the standardized coefficient of each statement by the sum of all standardized coefficients of the statements composing the construct, was used for calculating the constructs and overall assessment of transparency. Transformation into weights keeps the scale of constructs in an interval from one to five and allows one to consider the importance of each item in the composition of a construct. Table 4 presents the weights assigned to each statement in the composition of each measure.
Table 4
Standardized Coefficients and Weights of Each Statement in the Composition of Constructs
Construct Statements Standardized Coefficient Weight
Institutional Management S1 0.586 0.123 S2 0.722 0.152 S3 0.798 0.168 S4 0.793 0.167 S5 0.697 0.147 S6 0.603 0.127 S7 0.548 0.115 Total 4.747 1.000 Information Access S8 0.630 0.162 S9 0.639 0.164 S10 0.681 0.175 S11 0.634 0.163 S12 0.676 0.174 S13 0.630 0.162 Total 3.890 1.000 Passive transparency S14 0.801 0.119 S15 0.917 0.136 S16 0.842 0.125 S17 0.887 0.131 S18 0.855 0.127 S19 0.864 0.128 S20 0.815 0.121 S 21 0.775 0.115 Total 6.756 1.000
The measures for each interviewee are constructed by multiplying weights by the answers provided by the participants, in mathematical terms:
(1) 𝑮𝑰𝒋= 0.123 × 𝑆1𝑗+ 0.152 × 𝑆2𝑗+ 0.168 × 𝑆3𝑗+ 0.167 × 𝑆4𝑗+ 0.147 × 𝑆5𝑗+ 0.127 × 𝑆6𝑗+ 0.115 × 𝑆7𝑗 (2) 𝑨𝑰𝒋= 0.162 × 𝑆8𝑗+ 0.164 × 𝑆9𝑗+ 0.175 × 𝑆10𝑗+ 0.163 × 𝑆11𝑗+ 0.174 × 𝑆12𝑗+ 0.162 × 𝑆13𝑗 (3) 𝑻𝑨𝒋 = 0.208 × 𝐺𝐼𝑗+ 0.792 × 𝐴𝐼𝑗 (4) 𝑻𝑷𝒋= 0.119 × 𝑆14𝑗+ 0.136 × 𝑆15𝑗+ 0.125 × 𝑆16𝑗+ 0.131 × 𝑆17𝑗+ 0.127 × 𝑆18𝑗+ 0.128 × 𝑆19𝑗+ 0.121 × 𝑆20𝑗+ 0.115 × 𝑆21𝑗
where GIj is the interviewee j’s Perception of Institutional Management; AIj is interviewee j’s Perception of Information Access; TAj is the interviewee j’s Perception of Active transparency; TPj the interviewee j’s Perception of Passive transparency. The statements of the instrument (kj) are the interviewee
j’s answers to statement k, which are scored as 1- Completely Disagree; 2- Disagree; 3-Indiferent; 4-Agree;
5- CompletelyAgree.
While the measures for the institution are obtained from the mean of interviewees’ answers. For instance, for the construct Institutional Management (GI), we have:
(5)
𝑮𝑰𝒊=∑𝑛𝑗=1𝑛𝐺𝐼𝑗
where i represents the institution and n the number of interviewees j who answered the instrument. A similar expression is used to calculate the institutional scores obtained for the remaining constructs. The scores are on a five-point scale and the closer to the maximum score, the better is one’s perception of transparency. Hence, Table 5 presents a classification of Perception of Active and Passive Transparency according to the scores obtained for the expressions.
This classification may be used both to assess one of the three constructs (Information Access, Institutional Management, Passive Transparency) and to assess Active Transparency. The descriptions represent the expected perception of most of the social actors classified in each category.
This methodology enables an institution to assess the perception of a social actor in the different dimensions of transparency and also to have a notion of the institution’s overall transparency whenever the answers of a group of interviewees are compiled. Appendix B presents the methodology to apply the proposed model of Perception of Transparency in detail.
Table 5
Classification of Perception of Institutional Transparency
Score Classification Overall description
Active Transparency Passive Transparency
from 1.00
to 1.99 Very poor
Social actors checked completely disagree or disagree for most of the statements, indicating that, according to their perceptions, the institution is far from meeting their demands in terms of transparency, and for this reason, should reassess its transparency policy in general.
The social actors checked completely disagree or disagree in most statements, indicating the need to generally reassess the policy concerning how demands accruing from SIC, e-SIC and/or ombudsperson are met.
from 2.00
to 2.99 Poor
Most of the social actors checked the options from completely disagree to indifferent, showing the institutions’ transparency still requires considerable adjustments to meet the demands of social actors. In this case, a review of the institution’s transparency policy is recommended.
Most social actors completely disagree or are indifferent concerning the statements, showing that information provided via passive transparency needs to be considerably adjusted to meet the demands of social actors. In this case, a review of the practices adopted is recommended as well as analyze whether perception differs between forms of requests (e-SIC, SIC or ombudsperson) to identify the weakest processes.
from 3.00
to 3.99 Good
On average, the social actors mostly checked the options from indifferent to agree, showing that the institution’s transparency still needs some adjustments. To better identify which aspects need to be addressed, the institution can observe the means obtained in each statement and identify those rated the worst.
The social actors mainly checked the answer indifferent and agree. Thus, the management of information provided via passive transparency requires adjustment. To better identify the points that need to be changed, institutions can assess the means of answers provided in each statement to see which ones were rated the worst.
above 3.99 Excellent
The social actors checked either agree or completely agree in most statements. The institution has adopted transparency practices that meet the demands of social actors. There is possibly room for improvement, which can be verified by assessing those statements that obtained the lowest means or presented the highest variations (standard deviation).
The social actors checked agree and completely disagree in most of the statements, meaning the institution has satisfactorily answered to the demands of social actors. There is room for improvement, which can be identified by assessing the statements with the lowest means or greatest variations (standard deviation).
Source: developed by the authors (2019).
6. Final Considerations
Transparency has gained relevance in recent years both in Brazil and internationally and much has been achieved in terms of indicators to assess, mainly the transparency of public institutions and governments, with an eminently objective vision, the base theory of which are legal aspects. There is, however, a lack of studies assessing transparency from the perception of social actors, that is, the perception of the society to which transparency efforts are directed.
An institution intending to achieve excellence in terms of transparency is supposed to fully comply with legal requirements and qualify their scores in terms of objective measures, to maintain a policy that allows different social actors to identify its institutional efforts. In this sense, transparency cannot be an end in itself, rather it should drive institutional transformation to ensure accessibility and fully meet the demand for information on the part of society.
Seeking to fill in this gap, we propose a questionnaire to assess active and passive transparency among teaching institutions from the perception of social actors. The validity of the instrument was assessed by checking various measures, with satisfactory results indicating its applicability.
To simplify its use, we proposed a methodology that enables teaching institutions to assess transparency based on its dimensions (Institutional Management, Information Access) or overall transparency (Active Transparency and Passive Transparency), with the specific result of a given social actor (perception of one interviewee) or from the perception of various respondents. This is the greatest contribution of this questionnaire to be used by institutional managers to better understand an institution’s level of transparency.
Note that we did not identify in the literature a questionnaire in the context of teaching institutions that includes both active and passive transparency, which is an innovation presented in this study. Its use will perhaps be more frequent among public teaching institutions required to comply with legal norms and subjected to the control of stakeholders, with a need to perform self-assessments. The model, however, is perfectly fit for private teaching institutions, for-profit or not, which desire to implement a model to assess its level of transparency.
Despite the efforts to validate the model using a representative sample of one institution, one of this study’s limitations is lack of cross-cultural validation, which requires this study to be replicated to verify its applicability in other countries. Another limitation is the lack of validation in a sample different from the one used to estimate the model. In this sense, considerable advancement can be obtained by future studies intending to expand validation of this model and/or to adapt the model to other contexts
References
Abello-Romero, J. B., Mancilla, C., Molina, C. & Palma, A. (2018). Relación entre divulgación de información y características de universidades latinoamericanas. Revista Venezolana de Gerencia,
23(1), 67-89. doi: 10.31876/revista.v23i1.24457
Alvarenga, C. (2017). Ranking da Transparência das Universidades Federais 2017. Recuperado em 16 de julho, 2019, de https://cristianoalvarenga.com/pesquisa/ranking-da-transparencia-das-universidades-federais-2017 .
Anderson, J. C. & Gerbing, D. W. (1988). Structural equation modeling in practice: a review and recommended two-step approach. Psychological Bulletin, 103(3), pp.411-423. http://dx.doi. org/10.1037/0033-2909.103.3.411
Bairral, M. A. C., Silva, A. H. C. & Alves, F. J. S. (2015). Transparência no setor público: uma análise dos relatórios de gestão anuais de entidades públicas federais no ano de 2010. Revista de Administração
Pública, 49(3), pp. 642-675. http://dx.doi.org/10.1590/0034-7612125158
Byrne, B. M. (2010). Structural equation modeling with AMOS: BaSIC concepts, applications, and
Chang, S. J., van Witteloostuijn, A. & Eden, L. (2010). From the Editors: Common method variance in international business research. Journal of International Business Studies, 41(2), pp. 178-184. https:// doi.org/10.1057/jibs.2009.88
Cheung, G.W. & Lau, R.S. (2008). Testing mediation and suppression effects of latent variables: bootstrapping with structural equation models. Organizational Research Methods, 11(2), pp. 296-325. https://doi.org/10.1177/1094428107300343
Controladoria Geral da União, (2013). Manual da Lei de Acesso à Informação para Estados e Municípios. 1ª edição – Abril de 2013, Brasília (DF). Recuperado em 21 de julho, 2019 de https://www.cgu.gov. br/Publicacoes/transparencia-publica/brasil-transparente/arquivos/manual_lai_estadosmunicipios. pdf
Dalto, C., Nossa, V., & Martinez, A. (2014). Recursos de convênio entre fundações de apoio e universidades federais no Brasil: um estudo dos acórdãos do Tribunal de Contas da União (TCU). Revista Universo
Contábil, 10(2), pp. 06-23. https://doi.org/10.4270/RUC.2014209
De la Torre, R., & Torres, E. (2016). Transparencia y buen gobierno en la universidad pública. Reflexiones en torno al caso mexicano. Revista Online Especializada en Derecho de la Comunicación, 4, pp. 1-13. Recuperado de http://www.derecom.com/secciones/articulos-de-fondo/item/132-transparencia-y-buen-gobierno-en-la-universidad-publica-reflexiones-en-torno-al-caso-mexicano
Decreto nº 8.777, de 11 de maio de 2016. (2016). Institui A Política de Dados Abertos do Poder Executivo
Federal. Brasília, DF.. Recuperado de http://www.planalto.gov.br/ccivil_03/_ato2015-2018/2016/ decreto/d8777.htm Acesso em 01 de julho de 2019.
Eckel, P. (2008). Mission diversity and the tension between prestige and effectiveness: An overview of US higher education. Higher Education Policy, 21(2), pp. 175-192. http://dx.doi.org/10.1057/hep.2008.2 Figueiredo, V. S. & Santos, W.J.L. (2013). Transparência e controle social na administração pública. Revista
Temas de Administração Pública, 8(1), pp. 1-20. Recuperado de https://periodicos.fclar.unesp.br/
temasadm/article/view/6327/4715
Flórez-Parra, J. M., López-Pérez, M. V. & López-Hernández, A. M. (2017). Transparency and its determinants at Colombian universities, Higher Education Research & Development, 36(4), pp. 674-687. https://doi.org/10.1080/07294360.2016.1239613
Garver, N. S. & Mentzer, J. T. (1999). Logistics research methods: employing structural equation modeling to test for construct validity. Journal of Business Logistics, 20(1), pp. 33-57. Recuperado de https://www.scirp.org/(S(vtj3fa45qm1ean45vvffcz55))/reference/ReferencesPapers. aspx?ReferenceID=1927926Gorrell, G., Ford, N., Madden, A., Holdridge, P. & Eaglestone, B. (2011). Countering method bias in questionnaire‐based user studies. Journal of Documentation, 67(3), pp. 507-524. https://doi.org/10.1108/00220411111124569
Hair, J. R., Black, W. C., Babin, B. J., Anderson, R. E. & Tatham, R. L. (2010). Multivariate Data Analyses.
(Vol.6). 7a.ed. New Jersey: Pearson.
Hooper, D.; Coughlan, J. & Mullen, M. R. (2008). Structural Equation Modelling: Guidelines for Determining Model Fit. The Electronic Journal of Business Research Methods, 6(1), pp. 53–60. https://doi.org/10.21427/D7CF7R
Koufteros, X. A. (1999). Testing a model of pull production: a paradigm for manufacturing research using structural equation modeling. Journal of Operations Management, 17(4), pp. 467-488. https://doi. org/10.1016/S0272-6963(99)00002-9
Landis, R. S., Beal, D. J., & Tesluk, P. E. (2000). A comparison of approaches to forming composite measures in structural equation models. Organizational Research Methods, 3(2), pp. 186-207. https://doi. org/10.1177/109442810032003
Lara, T. (2009). El papel de la Universidad en la construcción de su identidad digital. RUSC, Universities
and Knowledge Society Journal, 6(1), pp. 15-21. http://dx.doi.org/10.7238/rusc.v6i1.25
Lei Complementar nº 101, de 4 de maio de 2000. (2000). Estabelece normas de finanças públicas voltadas
para a responsabilidade na gestão fiscal e dá outras providências. Recuperado de http://www. planalto.gov.br/ccivil_03/leis/lcp/lcp101.htm Acesso em: 17 de outubro de 2019.
Lei Complementar nº 131, de 27 de maio 2009. (2009). Acrescenta dispositivos à Lei Complementar no101,
de 4 de maio de 2000. Brasília, DF. Recuperado de http://www.planalto.gov.br/ccivil_03/leis/lcp/ lcp131.htm Acesso em 01 de julho de 2019.
Lei nº 12.527, de 18 de novembro de 2011. (2011). Regula o acesso a informações previsto no inciso XXXIII
do art. 5º, no inciso II do § 3º do art. 37 e no § 2º do art. 216 da Constituição Federal; altera a Lei nº 8.112, de 11 de dezembro de 1990; revoga a Lei nº 11.111, de 5 de maio de 2005, e dispositivos da Lei nº 8.159, de 8 de janeiro de 1991; e dá outras providências Brasília, DF. Recuperado de http:// www.planalto.gov.br/ccivil_03/_ato2011-2014/2011/lei/l12527.htm Acesso em 01 de julho de 2019. Lynn, M. R. (1986). Determination and quantification of content validity. Nursing Research, 35(6), pp.
382-385. https://doi.org/10.1097/00006199-198611000-00017
Melo, D. A. (2019). Transparência da informação pública: uma avaliação de sítios eletrônicos de
universidades federais brasileiras. Dissertação Mestrado em Administração Pública em Rede
Nacional, Universidade Federal de Goiás, Goiânia, Go, Brasil. Recuperado de http://repositorio. bc.ufg.br/tede/handle/tede/9599
Michener, G., Contreras, E., & Niskier, I. (2018). Da opacidade à transparência? Avaliando a Lei de Acesso à Informação no Brasil cinco anos depois. Revista De Administração Pública, 52(4), pp. 610-629. http://dx.doi.org/10.1590/0034-761220170289
Monteiro, A. (2014). Aferição do grau de cumprimento às obrigações de transparência ativa constantes da
Lei de Acesso à Informação por Universidades Federais do Brasil. Dissertação Mestrado Profissional
em Administração Pública, Fundação Getúlio Vargas (FGV), Rio de Janeiro, RJ, Brasil. Recuperado de http://hdl.handle.net/10438/12440
Pedharzur, E. J. & Schmelkin, L. P. (1991). Measurement, design, and analysis: an integrated
approach. New Jersey: Lawrence Erlbaum Associates. Recuperado de https://www.scirp.org/
(S(i43dyn45teexjx455qlt3d2q))/reference/ReferencesPapers.aspx?ReferenceID=1587225Periódicos Capes (2019). Missão e Objetivos. Recuperado de https://www.periodicos.capes.gov.br/index. php?option=com_pinstitucional&Itemid=104 Acesso em 15 de outubro de 2019.
Pessôa. I. S., Canuto. E. S. L., Costa, J. C. & Almeida, J. E. F. (2018). Determinantes da transparência das universidades federais brasileiras: Uma Análise Empírica no ano de 2013. Revista de Gestão e
Contabilidade da UFPI, 5(2), pp. 97-114. https://doi.org/10.26694/2358.1735.2018.v5ed27199
Podsakoff, P. M., MacKenzie, S. B., Lee, J. Y., & Podsakoff, N. P. (2003). Common method biases in behavioral research: A critical review of the literature and recommended remedies. Journal of
Possamai, A. J. & Schindler, E. (2017). Transparência e lei de Acesso À Informação (LAI) nos municípios gaúchos: fatores associados. Indicadores Econômicos FEE, 45(1), pp. 71-86, 2017. Recuperado de https://revistas.fee.tche.br/index.php/indicadores/article/view/3988
Relly, J. (2012). Examining a model of vertical accountability: A cross-national study of the influence of information access on the control of corruption. Government Information Quarterly, 29(3), pp. 335-345. https://doi.org/10.1016/j.giq.2012.02.011
Rodrigues Jr., M. S. & Salgueiro, V. A. G. (2015). Transparência na Gestão Fiscal nos Municípios do Estado do Ceará. Revista Controle, 13(1), pp. 47-63. https://doi.org/10.32585/rcda.v13i1.21
Rubio, D. M., Berg-Weger, M., Tebb, S. S., Lee, E. S. & Rauch, S. (2003). Objectifying content validity: Conducting a content validity study in social work research. Social Work Research, 27(2), pp. 94-104. https://doi.org/10.1093/swr/27.2.94
Saraite-Sariene, L., Rodríguez, M. del M. G. & Rosario, A. H. (2018). Exploring determining factors of web transparency in the world’s top universities, Revista de Contabilidad, 21(1), pp. 63-72. https:// doi.org/10.1016/j.rcsar.2017.07.004
Schumacker, R. E. & Lomax, R. G. A. (1996). Beginner’s Guide to Structural Equation Modeling. New Jersey: Lawrence Erlbaum Associates, Recuperado de https://www.scirp.org/ (S(351jmbntvnsjt1aadkposzje))/reference/ReferencesPapers.aspx?ReferenceID=770443
Silva, W. A. O. & Bruni, A. L. (2019). Variáveis socioeconômicas determinantes para a transparência pública passiva nos municípios brasileiros. Revista de Administração Pública, 53(2), pp. 415-431. http://dx.doi.org/10.1590/0034-761220170383
Visintin, J. A., Dechen, A. R. & Neves, E. M. (2009). O Futuro da Pesquisa e da Sustentabilidade. In USP 2034: Planejando o Futuro/organizadores Suely Vilela, Franco Maria Lajolo. Editora da universidade de São Paulo, São Paulo.
Wynd, C. A., Schmidt, B., & Schaefer, M. A. (2003). Two Quantitative Approaches for Estimating Content Validity. Western Journal of Nursing Research, 25(5), pp. 508–518. http://dx.doi. org/10.1177/0193945903252998.
Appendix A
Correlations between Errors of Variables of the Constructs Information Access, Institutional Management and Passive Transparency
Construct Correlated Errors Correlation Value Sig Institutional Management E3 <—> E1 0.159 * E5 <—> E4 0.198 * E6 <—> E5 0.291 * E7 <—> E6 0.381 * E7 <—> E5 0.110 * E9 <—> E8 0.357 *
Appendix B
Methodology to Apply the Model of Perception of Transparency
Step 1: Instrument’s application:
Develop a methodology to apply the statements with their respective scales among social actors. Observe that the scales Information Access and Institutional Management can be applied to all social actors while the scale Passive Transparency should be completed only by individuals who requested information via SIC, e-SIC or ombudsperson.
Step 2: Coding statements
Having an interviewee’s answers, each statement should be coded according to the following scoring: Completely Disagree =1; Disagree=2; Indifferent=3; Agree=4; and Completely Agree=5.
Step 3: Calculate the score of each construct based on the following equations:
(1) 𝐺𝐼𝑗= 0.123 × 𝑆1𝑗+ 0.152 × 𝑆2𝑗+ 0.168 × 𝑆3𝑗+ 0.167 × 𝑆4𝑗+ 0.147 × 𝑆5𝑗+ 0.127 × 𝑆6𝑗+ 0.115 × 𝑆7𝑗 (2) 𝐴𝐼𝑗= 0.162 × 𝑆8𝑗+ 0.164 × 𝑆9𝑗+ 0.175 × 𝑆10𝑗+ 0.163 × 𝑆11𝑗+ 0.174 × 𝑆12𝑗+ 0.162 × 𝑆13𝑗 (3) 𝑻𝑨𝒋 = 0.208 × 𝐺𝐼𝑗+ 0.792 × 𝐴𝐼𝑗 (4) 𝑻𝑷𝒋= 0.119 × 𝑆14𝑗+ 0.136 × 𝑆15𝑗+ 0.125 × 𝑆16𝑗+ 0.131 × 𝑆17𝑗+ 0.127 × 𝑆18𝑗+ 0.128 × 𝑆19𝑗+ 0.121 × 𝑆20𝑗+ 0.115 × 𝑆21𝑗
Step 4: Calculate the institution’s perception of Transparency according to the following formulas:
(5) 𝑮𝑰𝒊=∑ 𝐺𝐼𝑗 𝑛 𝑗=1 𝑛 (6)
𝐴𝐼
𝑖=
∑
𝐴𝐼
𝑗 𝑛 𝑗=1𝑛
(7) 𝑇𝐴𝑖 =∑ 𝑇𝐴𝑗 𝑛 𝑗=1 𝑛 (8) 𝑇𝑃𝑖 =∑ 𝑇𝑃𝑗 𝑛 𝑗=1 𝑛where GIj is interviewee j’s Perception of Institutional Management; AIj is interviewee j’s Perception of Information Access; TAj is interviewee j’s Perception of Active Transparency; TPj is interviewee j’s Perception of Passive Transparency.
Step 5: Classify the Perception of Transparency regarding the institution: