FUNDAÇÃO GETULIO VARGAS
ESCOLA BRASILEIRA DE ADMINISTRAÇÃO PÚBLICA E DE EMPRESAS MESTRADO EM ADMINISTRAÇÃO
A PERFORMANCE ANALYSIS OF TELEVISION PROGRAMS IN BRAZIL
DISSERTAÇÃO APRESENTADA À ESCOLA BRASILEIRA DE ADMINISTRAÇÃO PÚBLICA E DE EMPRESAS PARA OBTENÇÃO DO PARA OBTENÇÃO DO GRAU DE MESTRE
LIZ HASSAD DE ANDRADE Rio de Janeiro – 2019
Ficha catalográfica elaborada pelo Sistema de Bibliotecas/FGV
Andrade, Liz Hassad de
A performance analysis of television programs in Brazil / Liz Hassad de Andrade. – 2019.
60 f.
Dissertação (mestrado) - Escola Brasileira de Administração Pública e de Empresas, Centro de Formação Acadêmica e Pesquisa.
Orientador: Paulo Roberto de Mendonça Motta. Inclui bibliografia.
1. Televisão - Programas - Brasil. 2. Televisão - Competitividade. 3. Benchmarking (Administração) – Brasil. 4. Desempenho – Administração. I. Motta, Paulo Roberto. II. Escola Brasileira de Administração Pública e de Empresas. Centro de Formação Acadêmica e Pesquisa. III. Título.
CDD – 658.4013
Acknowledgements
This study was financed in part by the Coordenação de Aperfeiçoamento de Pessoal de Nível Superior - Brasil (CAPES) - Finance Code 001.
Resumo
A indústria de mídia global está sendo forçada a evoluir para competir com gigantes da Internet. Para superar o desafio imposto pelas plataformas não-lineares, os executivos de TV precisam confiar em diferentes estratégias para fortalecer suas atividades e alcançar uma vantagem competitiva sustentável. Este estudo sugere que análises de desempenho, como técnica de preferência de ordem por similaridade à solução ideal (TOPSIS) pode ajudar os executivos de TV a tomar decisões sobre os horários dos programas, aumentando a competitividade de seu canal. Utilizamos benchmarking para fazer uma comparação entre o desempenho dos programas e facilitar a tomada de decisões, entendendo quais são os programas mais eficazes. Uma análise de robustez incluiu o NG-model, PCA e GRA para obter insights sobre variáveis contextuais - gênero de programação, daypart, dia da semana e canal. Os resultados indicam que a análise de desempenho é uma ferramenta importante para ajudar os executivos de TV na difícil tarefa de mudar a programação.
Palavras-chave: Indústria Televisiva, Programa de TV, TOPSIS, Análise de Desempenho, Benchmarking.
Abstract
The global media industry is being forced to evolve to compete with Internet giants. To overcome the challenge imposed by the non-linear platforms, TV executives need to rely on different strategies to strengthen their activities and achieve sustainable competitive advantage. This study suggests that performance analysis, such as Technique for Order Preference by Similarity to Ideal Solution (TOPSIS) can help TV executives to make decisions regarding the TV schedules, increasing the competitiveness of their channel. We use benchmarking to make an inter-organization comparison of the performance of one program against others and facilitate decision making by learning which the most effective programs are. A robustness analysis included NG-model, PCA, and GRA to get insights regarding contextual characteristics (i.e., programs’ type, daypart, the day of the week and channel). The results indicate that performance analysis is a compelling tool to help TV executives on the difficult task of changing the TV schedule.
Contents
1. Introduction 7
2. Literature Review 11
2.1. The challenges of the television industry in Brazil 11
2.2. Audience research 12
2.3. TV programs 13
3. Data and Methodology 15
3.1. Data 15
3.2. The MCDM problem and the performance analysis 16
4. Models and estimations 20
4.1. TOPSIS 20 4.2. SVD 22 4.3. Tobit Regression 23 5. Results 24 5.1. TOPSIS 24 5.2. Robustness analysis 26 5.3. Contextual variables 31 6. Conclusion 34 References 37 Appendix I 46
1. Introduction
The nonlinear media imposed many challenges for traditional media groups. Platforms such as Youtube and Netflix allow the consumer to watch movies and series at any time as much they want. Thus, the global media industry is being forced to evolve to compete with Internet giants (Daidj & Egert, 2018). However, despite the enormous competition that the TV industry faces, it still quite relevant. For instance, researchers have indicated that TV advertising increases the consumers' tendency to search branded keywords (Joo, Wilbur, & Zhu, 2016) and even announcements with small audiences increment the search volume in 75% for the advertised brand occurring within two minutes (Du, Xu, & Wilbur, 2017). Thus, practitioners should seek new ways of analyzing audience data to improve their decision-making process. This study builds on the literature to answer two relevant, but not addressed questions: How can decision-makers identify the programs that are performing well and those that are not? What can be done to improve the performance of a program?
A common problem in television programming is to identify which programs should be replaced or modified. The standard procedure is to analyze the ranking of the audience, share, and to see their flow and trend. We suggest that a better approach is to determine how far they fall short of “best practice,” as measured by the ideal solution; and we discuss ways of measuring the ideal solution and apply not only the TOPSIS technique but also, the NG-model, Principal Component Analysis (PCA) and Grey Relational Analysis (GRA) to an audience data set. By doing this, we also take into account all the possibilities of the importance of each criterion; the criteria without correlation; and the reliability of the information with few respondents.
The results show that performance analysis is particularly valuable when the decision maker does not know which variables are the most important, a relatively common situation. Furthermore, the results indicate that SVD TOPSIS have a good balance between equal weights TOPSIS and the other models because the former ones discriminate more the data, but are not so impacted by outliers if we compare to the models that have a long tail. The contribution of the current study lies in the practical implementation of the integration of the singular value decomposition (SVD), TOPSIS, and Tobit regression in a second stage analysis including the NG-model, PCA and GRA; which can be utilized by television executives to determine the appropriate programming strategy.
TV executives have been relying on audience data to better schedule TV programs effectively for decades (Zufryden, 1976), but this is not an easy task since many criteria can be used. The present study uses benchmarking to make an inter-organization comparison of the performance of one program against others and facilitate decision making by learning which are the most effective programs and getting insights regarding contextual characteristics (Bogetoft & Otto, 2011) such as program’s type, daypart - a particular time of day (Mytton, 1999), the day of the week and channel. The benchmarking approach is a systematic comparison of the performance of the units of analyses, which can be firms, business units (Bogetoft & Otto, 2011), and in our case, TV programs.
One common way of analyzing performance is by applying Key Performance Indicators (KPI). However, as emphasized by Bogetoft & Otto (2011), a better approach is to consider multicriteria by employing a benchmarking technique, such as efficiency analyses (Data Envelopment Analysis - DEA and Stochastic Frontier Analysis - SFA). On the other hand, comparing to DEA models, the TOPSIS method has the advantage that weights are under decision-maker discretion and no assumption requiring convexity of data is required (Wanke, Azad, & Barros, 2016b).
Although TOPSIS has not previously been considered in the academic or practitioner literature on television, this approach and its variations have been employed to assess the performance of global third-party logistics service providers (P. Kumar & Singh, 2012), the Indian agro-supply chain (Gupta & Shankar, 2016), to evaluate merger and acquisitions (Akpan, Aik, Wanke, & Chau, 2018) and decisions in reverse logistics (Agrawal, Singh, & Murtaza, 2016). Recently, TOPSIS has been integrated to other methods to evaluate Indians banks (Chitnis & Vaidya, 2018), third-party logistics provider (Bianchini, 2018), and the competitiveness level of companies (Lau, Ip, Lee, & Ho, 2018).
Specifically, TOPSIS has been implemented in the marketing field to model the marketing strategy decision-making problem as a multi-criteria decision-making (MCDM) problem and provided a decision support framework to make and assess the marketing strategies (Wu, Lin, & Lee, 2010); and to improve the quality and effectiveness of decision-making in new product introduction (Kahraman, Büyüközkan, & Ateş, 2007). Nevertheless, to the best of the authors’ knowledge, the TV industry has not been subject of research in the benchmarking literature. One reason may be that quantitative studies in this area usually focus their attention on advertising (Rice, 1987; Wilbur, Xu,
& Kempe, 2013) or modeling viewer preferences and choices of programs (e.g., Solgaard, 1984). For instance, Wilbur et al., (2013) provided empirical evidence that an audience value maximization algorithm can maximize audience value to advertisers. Conversely, the present study focuses on helping decision makers choosing the programs they should improve and, then, it indicates how audience researchers can analyze which contextual characteristics affect the results with a Tobit regression.
The TV industry is a context very different from analyzing since the inputs and outputs are not physical products. Besides, the performance of a program cannot be only measured by revenue because cable TV channels not only profit with TV commercials but also with signatures. Thus, a program with a high audience may not have high commercial revenue, but may be relevant to the viewer and, consequently, can have good performance. One example that revenue and viewers preferences are not related was provided by Wilbur (2008). The author compared the demand of viewers versus advertisers and reported that viewers' two most preferred programs’ type, “action”, and “news”, account for just 16% of network program hours while advertisers' two most preferred types, “reality” and “comedy”, account for 47% of network program hours.
This paper analyzes the efficiency of the 200 programs of the cable TV in Brazil with the higher audience in the 12-17 years-old viewers that live in a household with cable TV access in 2013. We applied TOPSIS to evaluate the programs using its audience, share, and duration as the performance criteria. To choose the weights for the criteria, we interviewed ten specialists of the TV industry, and we processed their answers by employing SVD, following Bi, Zhao, An, & Hu (2018); Gai & Hu (2018); Henry & Hofrichter (1992); Huang, Lin, Ding, & Huang (2018); and Li, Cui, Chen, & Liu (2018).
Further, we compared TOPSIS using equal weights; TOPSIS integrated to SVD; the same approach integrated to bootstrap; NG-model, following Wanke, Pestana, & Chen (2015), and Wanke, Azad, & Barros (2016a); PCA, following Wanke, Azad, & Barros (2016a); and GRA, following Kuo, Yang, & Huang (2008), and Morán, Granada, Míguez, & Porteiro (2006). Finally, the censored Tobit model was applied in the second stage to examine the impact of contextual variables on performance scores, following Wanke, Maredza, & Gupta (2017). As a result, this study provides a tool to help audience researchers to evaluate the performance of the programs and understand the exogenous characteristics - subject to the decision-maker discretion - that affect their performance.
By applying a novel method for the TV industry, the present research can help practitioners to (1) ensure that the right program is being aired at the right time and day
of the week (2) to motivate TV producers to improve the programs’ content; (3) to link budgets and bonus to the performance score. Moreover, the results indicate that the combination of TOPSIS, SVD, and Tobit regression can give insight that cannot be assessed by analyzing a ranking. The techniques employed in this research can also be extended to similar industries. For instance, it would be useful to evaluate the performance of apps, websites, social media pages, and any other product that do not have obvious outputs, such as revenue or volume of production.
The contribution of this paper is twofold. First, it helps TV executives to make strategic decisions regarding program schedule by indicating the most problematic programs and pointing toward more specific means to improve performance, e.g., to change the day of the week to air the program. Besides, this study can help decision makers to choose the best program to start the prime time. Liu, Putler, & Weinberg (2004) stated that a broadcaster’s first program should have a high quality. Notwithstanding, choosing the best program is not easy because many criteria could be used. Thus, our research can help TV executives by providing a method to select the program that has the best performance and, consequently, should be used to start the prime time.
Second, this research reveals that the audience dataset provides variables that can be used as performance criteria by combining TOPSIS, SVD methods, NG-model, PCA and GRA; and that the Tobit regression can reveal which contextual variables are relevant to the program performance. The study provides a framework and an empirical illustration of optimizing programs’ performance for maximizing audience, share, and duration. Therefore, our research introduces a fresh understanding of how these methods can be applied in situations that the analyst does not have clear performance criteria. In addition, this study answers recent calls to alert practitioners and researchers to the practical applications of the MCDM approach (Ferreira, Ilander, & Ferreira, 2019) by creating a relevant tool to analyze the performance of TV programs and bringing lessons to the TV industry of how their products can be improved.
2. Literature Review
The literature review is organized into three parts. The first part introduces the current challenges of the TV industry in Brazil and illustrates the studies in the area. The second section explores the field of audience research and what has been the main concerns both for the industry and scholars. The last section introduces the studies regarding TV programs, expounding the main differences from the present research.
2.1. The challenges of the television industry in Brazil
The television was initiated in 1950 in Brazil, and for many decades, did not have a strong competitor (Fernandes, 2013). By the end of the 20th century, cable TV added
many options to the viewer, but with the development of the Internet, these options increased exponentially. Further, the creation of YouTube revolutionized video consumption because it made it possible for anyone to create and post a video. This way, it was not possible to predict who would be successful in the following week. It also made it easier to have access to piracy, one challenge for TV networks, studios, and distributors. In 2017, YouTube reached 98 million users in Brazil (Google, 2017).
With the popularization of the broadband internet service, the TV networks had a new challenge to overcome: Netflix became popular and the most prestigious platform to watch series (Mariano, 2015). Moreover, the number of hours of online videos consumed per week by Brazilians increased from 8,1 million in 2014 to 19 million in 2018 (Marinho, 2018). To overcome the problem imposed by the non-linear platforms, TV executives need to rely on different strategies to strengthen their activities and achieve a sustainable competitive advantage (Daidj & Egert, 2018). This study suggests that performance analysis can help TV executives to make decisions regarding the TV schedules and, consequently, increase the competitiveness of their channel.
Quantitative studies about the TV industry in Brazil concentrated their efforts on understanding the effects of watching TV on obesity (Wells et al., 2008), divorce (Chong & La Ferrara, 2009), vote (Boas, 2005), and analyzed the failures of the Broadcasting Law (Mohedano, Galhardi, & Igartua, 2016). To the best of the author’s knowledge, none of the studies about the TV industry in Brazil analyze the Brazilian audience data and provide a method to help TV executives to make decisions.
2.2.Audience research
Since the founding of the Media and Communication field, audience research has been central to respond to developments in the media environment by interpreting and explaining the audience data (Jensen, 2019). Recently, recent innovations have been playing an essential role in how television audiences are analyzed, and the industry has been growing efforts to utilize Big Data, a large body of data generated through social media platforms (Kelly, 2019). Consequently, social media analytics is being used to measure television program success and how the advertising budget is allocated across programs (Kosterich & Napoli, 2016). With the availability of previously unprecedented amounts of data to analyze, datafication poses an array of new challenges, but, at the same time, questions about whether audience research is useful are no longer heard (Das, 2019). We argue that the audience dataset still being a critical source to the decision-making process and propose a method of analyzing it by combining TOPSIS, SVD, and Tobit regression to evaluate the program’s performance.
Audience research has been applied in practice to answer how many people are in audience, how often the same people show up in the audience, who are the audience members, how much it costs to reach the audience, if the program attracted the intended audience, how loyal is the audience, what other stations or programs the audience use, how structural factors such as scheduling affect the audience formation, when a program’s cost exceeds its benefits, how effectively a TV channel compete for market revenues, what is the value of a programming investment and a media property, what determines the value of an audience, and what contribution rating makes to revenue (Webster, Phalen, & Lichty, 2006).
On the other hand, audience research has been applied in the academic research to develop predictive and explanatory models of audience behavior that identify patterns related to audience exposure to programs; to understand the channel loyalty, how content characteristics are related to exposure patterns, how production budget relate to audience exposure patterns, what affects the audience transition from one program to the next, and how the audience attention is affected by the fragmentation of the media environment (Napoli, 2011).
Audience data are central to what many media corporations produce, but much of these data are inaccessible to scholars (Gray, 2017). Besides, many scholars that study audience have been focused on the advertising, and whereas advertisers may not be
concerned about how audiences are captured, TV executive needs to understand the dynamics of scheduling and content to maximize audiences delivery and to prevent inadvertent audience losses (McDowell & Sutherland, 2000). We aim to fulfill this gap by being the first to treat audience variables as performance criteria and employing a benchmark approach to identify the performance of the TV programs.
2.3.TV programs
Audience researchers need to be continually analyzing the audience of the programs to induce decisions about their channel’s schedule. Thus, scholars have been proposing methods to understand the program’s audience for decades. Nevertheless, to the best of our knowledge, the present research is the first to assess the performance of TV programs considering multi-criteria and creating a framework that can be employed in any type of TV program.
Zufryden (1976) proposed a stochastic model of consumer behavior to understand how audience choices of TV programs relate to past program choices and experiences. This study is important to predict the audience and take actions in advance when there is a bad forecast. Nevertheless, it does not measure the performance of the programs, but only the trend.
Sabavala & Morrison (1977) also employed a stochastic model to measure the loyalty of programs considering the probability of viewing a program. Although their model was also an estimation of performance, they used survey data and did not consider the contextual variables, and other criteria - that are important to measure the performance of a program, such as duration and share. As emphasized by Figueira, Greco, & Ehrogott (2005), considering a single criterion, “amalgamates the multidimensional aspects of the decision situation into a single scale of measure.”
Similarly, Solgaard (1984) created a model to enable management of TV channels and advertisers to identify the factors which determine viewers’ choices of news programs at a point in time, which can be applied to determine how changes in these factors induce viewers to switch to other news programs. This model considers the respondent’s perception of the quality of the reception of the TV channels and attitude toward program attribute, content, and cast; the image of the anchor, weathercaster, and sportscaster. Notwithstanding, as can be observed, this analysis cannot be generalized to other types of programs.
The more recent study introduces new approaches to the audience analysis. McDowell & Sutherland (2000) adapted the essential components of the brand equity model and supported that the program’s brand equity affects (1) the difference between lead-in program audience size and program audience size; (2) the proportion of lead-in audience that is retained; and (3) the proportion of audiences from other sources that is recruited. This study is important to help TV executives to plan the TV schedule, but it does not measure the overall performance of the program, and it does not consider other contextual variables as the program’s type and the daypart in which it is aired.
Yang, Narayan, & Assael (2006) suggest a Bayesian estimation approach to estimate the preference interdependence of the viewership of television programs between husbands and wives, with important implications to the channel’s marketing strategy, but without contributions to the programming strategy.
Yin, Bai, Chai, & Zhang (2018) propose a new scheme on the analysis of the audience flowing based on the established lingered channel matrix produced by raw viewing data. This study is important to help to reorganize the programs as it makes it easier to identify when they do not maintain the same level of the audience of the previous one. However, because this method only considers the audience, it cannot give an overall performance of the program.
3. Data and Methodology
This chapter is organized into two parts. The first part gives details regarding the utilized data. The second section explores the MCDM problems, examines the benchmarking approach, which methods scholars have been utilized in this approach and explains why the present research applied TOPSIS.
3.1. Data
The data of the present study was extracted from software provided by a research institute that operates in Brazil. It is a rank of the 200 cable programs with the highest audience for 12-17 years-old viewers, an important target in the consumption of non-linear platforms (Piper Jaffray 36th Semi-Annual Taking Stock With Teens, 2018). The institute data is derived from 9 markets (São Paulo, Rio de Janeiro, Belo Horizonte, Distrito Federal, Porto Alegre, Florianópolis, Salvador, Curitiba, and Campinas). The institute measures the ratings with a device connected to the television of the sample and collects the data every minute. Then, the software aggregates the data to make it possible to extract the period the client wants. The data of the present study is the mean of the year 2013.
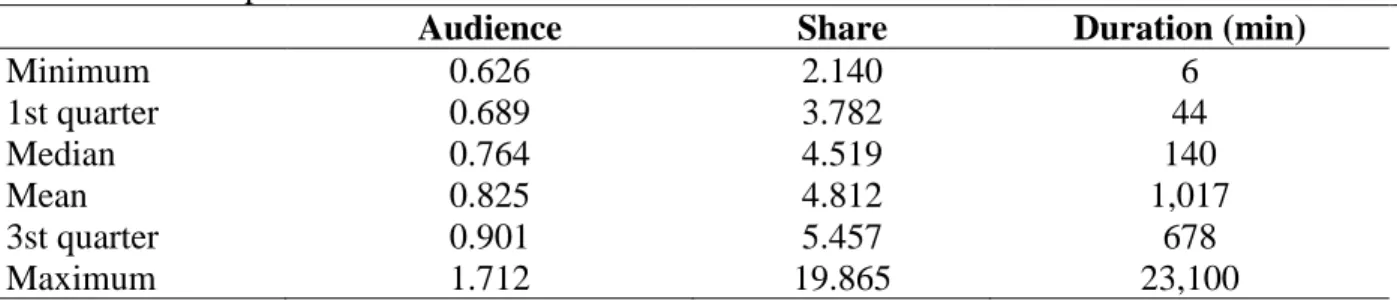
We used the audience, share, and duration as the performance criteria. Table 1 shows the descriptive statistic for these three variables. The audience is the average percentage of people in a given population watching a TV within a given period; the share is the percentage of all viewing that is accounted by each channel (Mytton, 1999); and duration is the total minutes which the program was aired. Audience and share were chosen because they are the most used indices in the analysis of television rating (Yin et al., 2017). Moreover, we also chose the duration as a performance criterion because (1) it is not subject to the decision maker discretion in the case of live events; (2) it is important to fulfill the TV schedule. Thus, the number of minutes of a TV program can be seen as the number of products manufactured in a factory.
Table 1 - Descriptive statistics
Audience Share Duration (min)
Minimum 0.626 2.140 6 1st quarter 0.689 3.782 44 Median 0.764 4.519 140 Mean 0.825 4.812 1,017 3st quarter 0.901 5.457 678 Maximum 1.712 19.865 23,100
Table 2 shows the Pearson correlation matrix. As can be seen, there is a positive but moderate correlation between audience and share, a negative and very weak correlation between audience and duration, and a negative and weak correlation between share and duration. These results show the importance of considering multi-criteria to analyze the performance of a TV program since one variable cannot represent the results of the others.
Table 2 – Pearson correlation matrix
Audience Share Duration
Audience 1
Share .456 1
Duration -.148 -.258 1
We used the channel, type of program, the day of the week and a dummy for prime time as contextual variables. The dummy was created in such a way that prime time=1 means that the program is aired from 7 p.m. to 1 a.m. and prime time=0 otherwise. None of the variables available were considered as input.
To perform the Tobit regression, we created a category of “other types programs” including the types of programs with only one observation (journalism, documentary, tourism, and sports) and we consider it as one of the baselines. The other baselines were Monday and a cartoon TV channel. The model that was considered a baseline was the equal weights TOPSIS.
3.2.The MCDM problem and the performance analysis
Although there are epistemological differences between MCDM and MCDA (multi-criteria decision analysis), these two branches of operational research/management science focus on decision aid (Ferreira et al., 2019). Thus, in this research, we use the
term MCDM. MCDM is an activity which helps to make decisions when there is a set of alternatives, at least two criteria, and, at least one decision-maker, an intuition closely related to the way humans have always been making decisions, that is, despite the diversity of approaches, the basic ingredients of MCDM are very simple (Figueira et al., 2005). As cited by the authors, MCDM takes into account the pros and cons of a plurality of points of view.
Benchmarking is the systematic comparison of the performance of one unit of analysis against other units (Bogetoft & Otto, 2011). According to the authors, one of the goals of benchmarking studies is to facilitate coordination. In the case of the TV industry, it would mean to ensure that the right program is being aired at the right time and channel. Another application of benchmarking is to facilitate incentive provision by altering the behavior. For instance, studio producers may be more motivated to improve their program if they know that their performance is being analyzed. Additionally, their budget and salary plan can be tied to the performance score, which considers the performance of one program compared to their competitors’ performance.
The benchmarking approach has been employed in the Marketing field to assess the relative efficiency of first-mover firms (Murthi, Srinivasan, & Kalyanaram, 2006); sales-force size (Horsky & Nelson, 2008); individual stores within a chain (Gauri, Pauler, & Trivedi, 2008; Thomas, Barr, Cron, & Slocum, 1998); aquariums (V. Kumar, Sharma, Donthu, & Rountree, 2015); and bank branches (Kamakura, Mittal, de Rosa, & Mazzon, 2002). It also has been utilized to identify physicians that are the best prospects for marketing direct intervention (Haughton, Haughton, Kelly-Hawke, & Moriarty, 2000), and how much more of insurance can be potentially sold to a customer (Kim & Kim, 1999). Recently, it has been applied to determine the relation between marketing expenses and bank’s financial position (Valentyn & Pavlov, 2017) and to examine the impact of perceived social media marketing activities on customer loyalty via customer equity drivers in an e-commerce context (S. Yadav, Pathak, & Gangwar, 2019)
One common difficulty of performance analysis is that competition may limit the sharing of information that could be used for benchmarking. Nevertheless, because research institutes collect data from all relevant TV channels, they have the rare opportunity to compare themselves with their competitors, and, consequently, to boost their learning process.
A decision is intrinsically related to a plurality of points of view, that is, criteria (Figueira et al., 2005). Researchers have applied different methods to solve MCDM
problems, such as DEA (e.g., Azad, Munisamy, Masum, Saona, & Wanke, 2017; Kamakura, Mittal, de Rosa, & Mazzon, 2002; Kumar, Sharma, Donthu, & Rountree, 2015; Murthi, Srinivasan, & Kalyanaram, 2006; Barker, 2019; Thomas et al., 1998; Wanke, Maredza, & Gupta, 2017) and SFA (e.g., Kim & Kim, 1999), methods that analyze the productive frontiers that envelopes a data set to assess the efficiency of the decision making unit (Aye, Gupta, & Wanke, 2018) and which are the two dominant approaches to modern benchmarking analysis.
On the one hand, DEA provides a mathematical programming non-parametrical method of estimating best practice production frontiers and evaluating the relative efficiency of different decision-making units - an entity responsible for converting inputs into outputs (Bogetoft & Otto, 2011). On the other hand, Stochastic Frontier Analysis is a parametric approach based on the econometric theory in which the deviations on the frontier may reflect not only inefficiencies (deterministic frontier) but also noise in the data (Kumbhakar & Lovell, 2000).
We chose the TOPSIS approach because this method is useful when we do not have inputs and outputs, but performance criteria that are considered negative (as the input) and positive (as the output) by the decision maker. In the case of the TV programs, the inputs could be production costs. Nevertheless, this information cannot be gathered since we are analyzing the contents of different TV channels. Therefore, this study only considers the positive performance criteria, which is not possible to be done by using traditional efficiency analysis, such as DEA and SFA.
TOPSIS has been employed to assess the performance of global third-party logistics service providers in a supply chain (P. Kumar & Singh, 2012); to model the marketing strategy as a MCDM problem and provide a five-step decision support framework to assess the marketing strategies (Wu et al., 2010); and to assess the efficiency of the Malaysian Islamic banks (Wanke et al., 2016b). Recently, TOPSIS has been applied to examine the impact of perceived social media marketing activities on customer loyalty via customer equity drivers in an e-commerce context (S. Yadav et al., 2019) to optimize cryo-treated electrical discharge machining variables (Mohanty, Satpathy, Mahapatra, & Singh, 2018), to evaluate the performance of vendors and to select the best one (Mohammed, Harris, & Dukyil, 2019) and the energy efficiency drivers in South Africa (Aye et al., 2018).
Adaptations of TOPSIS such as Fuzzy TOPSIS, interval 2-tuple linguistic TOPSIS (ITL-TOPSIS), and Design of Experiments Prospect Theory-TOPSIS (DoEPT–TOPSIS)
has also been used to solve MCDM problems (e.g., Agrawal et al., 2016; Bilbao-Terol, Arenas-Parra, Alvarez-Otero, & Cañal-Fernández, 2019; Gupta & Shankar, 2016; Kahraman, Büyüközkan, & Ateş, 2007; Kelemenis & Askounis, 2010; Rajak, Niraj, & Kumar, 2016; V. Yadav, Sharma, & Singh, 2018). Whereas TOPSIS requires less effort for data collection and computational processing (Lima Junior & Carpinetti, 2015), these adaptations provide other advantages to the analyses. For instance, Fuzzy-TOPSIS has the advantages of not suffering inversions in the ranking when a new alternative is added, and it is suitable for dealing with qualitative and inaccurate information (Lima Junior & Carpinetti, 2015). ITL-TOPSIS is another adequate approach in the presence of uncertainty and ambiguity within data (Gupta & Shankar, 2016). DoEPT–TOPSIS also overcomes the drawbacks of rank reversal and can be used when it is unclear what weight set should be considered (Bilbao-Terol et al., 2019).
Nevertheless, we performed our analysis by using TOPSIS because (1) we do not have inaccurate or ambiguous data, (2) we had specialists to give weights to the variables, and (3) it is not relevant to fix the order of the ranking in the case of TV programs. Since the audience data is collected daily, the results may frequently vary independently of the approach being utilized.
Recently, researchers have been integrating TOPSIS with other approaches. For instance, Chitnis & Vaidya (2018) integrated SFA and TOPSIS to evaluate Indians banks; Bianchini (2018) provided a two-phase analytical hierarchy process and TOPSIS methodology to evaluate third-party logistics provider; and Lau et al. (2018) proposed a model embracing Hierarchical Holographic Modelling, Fuzzy Analytic Hierarchy Process, and TOPSIS to evaluate the competitiveness level of companies. Similarly, the present research integrates SVD, PCA, GRA, and Tobit regression to evaluate the performance of TV programs and understand the contextual variables that affect them.
Traditionally, MCDM techniques have been popular in the financial sector (Ferreira et al., 2019). This research builds on recent works that applied TOPSIS to non-convectional MCDM problems, such as assessing and ranking the educational quality of free-online instructional videos (Acuña-Soto, Liern, & Pérez-Gladish, 2019); selecting the best vendor considering traditional and resilience criteria simultaneously (Mohammed et al., 2019); and integrating corporate social responsibility valuations with the financial performance of companies (Bilbao-Terol et al., 2019).
4. Models and estimations
This chapter is organized into three parts. The first part explains the TOPSIS technique. The second section explores the SVD method. The last section fleshes out the Tobit regression.
4.1. TOPSIS
TOPSIS is an MCDM technique that chooses the alternative with the shortest distance from the ideal solution and the farthest from the negative-ideal solution (Hwang & Yoon, 1981). Whereas the negative ideal solution maximizes the cost criteria and minimizes the benefit criteria, the positive ideal solution maximizes the benefit criteria and minimizes the cost criteria (Behzadian, Otaghsara, Yazdani, & Ignatius, 2012).
As shown by Wanke et al. (2016), the TOPSIS technique is built upon an evaluation matrix consisting of m alternatives and n criteria with the intersection of each option and criteria given as xij. Thus, one obtains a matrix (xij)mxn,which is firstly normalized from a
regulated matrix R∗=(rij) as demonstrated in Eq. (1).
𝑟𝑖𝑗 = 𝑥𝑖𝑗 √∑𝑚 𝑥𝑖𝑗2
𝑖=1
, 𝑖 = 1,2, … 𝑚 and 𝑗 = 1,2, … , 𝑛
After normalization the weighted normalized decision matrix for performance assessment is calculated, observing Eq. (2).
𝑊 = (𝑤𝑖𝑗)𝑚𝑥𝑛 = (𝑤𝑗𝑟𝑖𝑗)𝑚𝑥𝑛
where wjis the weight given to the criteria j and ∑𝑛𝑗=1𝑤𝑗 = 1.
Then, we determine the worst alternative (the negative ideal assessment unit) 𝐴𝑎 demonstrated in Eq. (3) and the best alternative (the positive ideal assessment unit) 𝐴𝑏 as shown in Eq. (4). 𝐴𝑎 = {min(𝑤𝑖𝑗|𝑖 = 1,2, … , 𝑚) |𝑗 ∈ 𝐽+, max (𝑤𝑖𝑗|𝑖 = 1,2, … , 𝑚)|𝑗 ∈ 𝐽−} = {𝛼𝑎𝑗|𝑗 = 1,2, … , 𝑛} 𝐴𝑏 = {max(𝑤𝑖𝑗|𝑖 = 1,2, … , 𝑚) |𝑗 ∈ 𝐽+, min (𝑤𝑖𝑗|𝑖 = 1,2, … , 𝑚)|𝑗 ∈ 𝐽−} = {𝛼𝑎𝑗|𝑗 = 1,2, … , 𝑛} (1) (2) (3) (4)
where 𝐽+ = {𝑗 |𝑗 ∈ 𝑝𝑜𝑠𝑖𝑡𝑖𝑣𝑒} and 𝐽− = {𝑗 |𝑗 ∈ 𝑛𝑒𝑔𝑎𝑡𝑖𝑣𝑒}, which are a set of positive and negative attributes, respectively.
Next, we calculate the distance 𝑑𝑖𝑎 between the target alternative 𝑖, and the worst condition 𝐴𝑎, as demonstrated in Eq. (5).
𝑑𝑖𝑎 = √∑(
𝑛
𝑗=1
𝑤𝑖𝑗−∝𝑎𝑗)2, 𝑖 = 1,2, … , 𝑚
and the distance 𝑑𝑖𝑏 between the alternative 𝑖 and the best condition 𝐴𝑏, as demonstrated in Eq. (6).
𝑑𝑖𝑏 = √∑𝑛𝑗=1(𝑤𝑖𝑗 −∝𝑎𝑗)2, 𝑖 = 1,2, … , 𝑚
where 𝑑𝑖𝑎 and 𝑑𝑖𝑏 are the Euclidean distance from the target alternative 𝑖 to the worst and best conditions, respectively.
Further, we calculate the similarity of alternative 𝑖 to the worst condition (the inefficient best conditions).
𝑆𝑖 = 𝑑𝑖𝑎|(𝑑𝑖𝑎+ 𝑑𝑖𝑏)
where 0 ≤ 𝑆𝑖 ≤ 1, 𝑖 = 1,2, … , 𝑚
𝑆𝑖 = 0, if and only if the alternative solution has the worst condition. 𝑆𝑖 = 1, if and only if the alternative solution has the best condition.
Lastly, we rank the alternatives according to 𝑆𝑖, where a higher value of 𝑆𝑖 indicates a better solution with respect to higher performance levels.
To choose the weights for the criteria, we interviewed ten specialists from the TV industry to understand the importance of the three criteria. Specifically, they were asked: In a scale from one to five in which one represents “not important,” three is neutral, and five represents “very important,” how do you classify the importance of the audience, share, and duration to a program? The specialists work for the two more relevant communication groups in Brazil (Globo and Record), are allocated in different units (network, cable TV and video-on-demand), in various departments (market intelligence, (6) (5)
media, programming, content, etc.) and have different job roles (coordinator, manager, consultant, etc.).
We ran the TOPSIS with three different weights. In the first, all the weights are equal. In the second, we used the SVD approach to determine the weights. In the third, we also used the SVD approach, but we performed bootstrap to resample 50 times the weights and provide an averaged result. Both SVD results were normalized. The R code employed in this study can be found in Appendix I.
4.2. SVD
The richness of the data provided by the media research institutes leads to the task of choosing the weights of each criterion. To do that, we employed the SVD method after interviewing specialists to assess the importance of the criteria used. According to Gai & Hu (2018), SVD is an orthogonalization method of matrix decomposition in linear algebra. The singular values of matrices have better stability and have both proportion invariance and rotation invariance. Thus, singular values can reflect the features of eigenvectors very well. For a linear correlation matrix of rows or columns, it can be transformed into a linearly independent one by multiplying an orthogonal matrix on its left and right side, respectively. For a real matrix, 𝐴𝑚×𝑛, whose rank is 𝑟, if there exist two
orthonormal matrices, 𝑈 and 𝑊, and another diagonal matrix, 𝐷, they satisfy Eq. (7), which is called the SVD of the real matrix 𝐴𝑚×𝑛.
𝐴𝑚𝑥𝑛 = 𝑈𝑚𝑥𝑚𝐷𝑚𝑥𝑛𝑊𝑛𝑥𝑛𝑇 = ∑ 𝛿𝑟𝑖 𝑖𝑢𝑖𝑤𝑖𝑇 𝑈𝑇𝑈 = 𝐸
𝑚𝑥𝑚 𝑊𝑇𝑊 = 𝐸𝑛𝑥𝑛
In Eq. (7), 𝑈𝑚𝑥𝑚 = [𝑢1, 𝑢2, … , 𝑢𝑚], 𝐷𝑚𝑥𝑛 = [∆𝑟𝑥𝑟0 00] , ∆𝑟𝑥𝑟= 𝑑𝑖𝑎𝑔(𝛿1,
𝛿2, … , 𝛿𝑟), 𝑊𝑛𝑥𝑛 = [𝑤1, 𝑤2, … , 𝑤𝑛], 𝑟 = min(𝑚, 𝑛), and 𝛿1 (𝑖 = 1,2, … , 𝑟) are singular values of the real matrix 𝐴𝑚𝑥𝑛. 𝛿𝑖 = √𝜆𝑖, 𝜆1 ≥ 𝜆2 ≥ ⋯ ≥ 𝜆𝑟 ≥ 0, are the eigenvalues of
ATA. Under the restrictions of 𝜆1 ≥ 𝜆2 ≥ ⋯ ≥ 𝜆𝑟 ≥ 0, the singular value of the matrix (𝛿1, 𝛿2, … , 𝛿𝑟) is unique. The results of the SVD method were used to estimate the TOPSIS model.
Then, we used the Tobit regression to see the effect of the contextual variables (channel, gender, the day of the week, and prime time dummy) on the performance score of the programs.
4.3. Tobit Regression
A common approach to explore the possible causes of the variations in efficiencies is to use the Tobit regression in second-stage analyses – analyses performed after the development of a benchmarking model – (Bogetoft & Otto, 2011). This model was first used by Tobin (1958) to estimate the relationships for limited dependent variables and is used in our study because the performance score of the programs is between 0 and 1. Therefore, we use the Tobit model for censored regression to understand why some programs have a better performance than others, as demonstrated in Eq. (8).
𝑦𝑖∗ =𝑥𝑖′𝛽 + 𝜀𝑖 𝑦𝑖 = { 𝑎, 𝑖𝑓 𝑦𝑖∗ ≤ 𝑎 𝑦𝑖∗ 𝑖𝑓 𝑎 < 𝑦𝑖∗ < 𝑏 𝑏 𝑖𝑓 𝑦𝑖∗ ≥ 𝑏 }
where y* is unobserved variable, 𝑥𝑖′ is a vector of explanatory variables, 𝛽 is a vector of unknown coefficients and 𝜀𝑖 is the error term.
5. Results
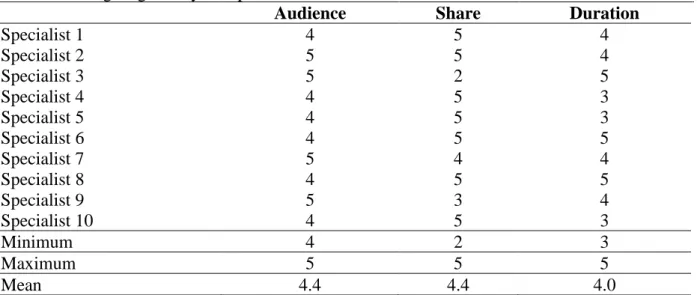
5.1. TOPSISAs Table 3 shows, on average, the three variables (audience, share, and duration) are almost equally important, according to the specialists. This result exemplifies why it is difficult to choose only one variable to determine whether the program has a good performance. Therefore, it reinforces the relevance of using an MCDM approach to assess the performance of the programs. Moreover, the results show that although the duration is not a common variable used to measure the performance of a TV program, it is almost as important as the most used variables – audience and share. Additionally, the results reveal that while the audience varied only from four to five, the share varied from two to five and the duration from three to five, which may indicate that the arithmetic mean is not a useful parameter to adopt.
Table 3 - Weights given by the specialists
Audience Share Duration
Specialist 1 4 5 4 Specialist 2 5 5 4 Specialist 3 5 2 5 Specialist 4 4 5 3 Specialist 5 4 5 3 Specialist 6 4 5 5 Specialist 7 5 4 4 Specialist 8 4 5 5 Specialist 9 5 3 4 Specialist 10 4 5 3 Minimum 4 2 3 Maximum 5 5 5 Mean 4.4 4.4 4.0
Next, we analyzed the results from SVD and Bootstrap SVD. As Table 4 shows, they do not diverge. Both give a weight of more than 80% for the audience, more than 10% for the share and less than 10% for the duration.
Table 4 - Normalized SVD Weights
Audience Share Duration
SVD 0.812 0.125 0.063
Bootstrap SVD 0.825 0.130 0.045
In contrast, the SVD results change the performance score dramatically when comparing with the TOPSIS using equal weights because the formers give much more importance to the audience. Thus, the programs that have a higher audience are also
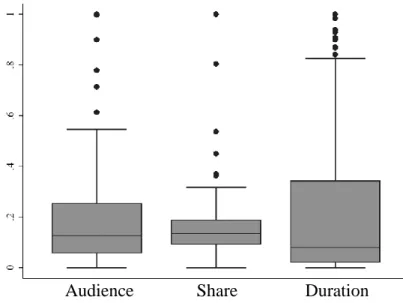
considered more efficient. On the other hand, the equal weights TOPSIS considered the most efficient program the one which contained the higher duration, because its duration is much higher (Table 1, Max=23,100) comparing to the others (Table 1, Mean=1,017). As Figure 1 shows, even after normalizing the weights, the duration maintained its dispersion.
Figure 1 – Normalized performance criteria
Therefore, the Top 5 programs with higher performance in the equal weights’ analysis had a duration above 10,000 min. Figure 2 illustrates the difference in the scores between equal weights and SVD. The program with the best performance for the SVD score is the 23rd for the equal weight score. On the other hand, Figure 3 shows how the results of SVD and Bootstrap SVD were similar.
SVD
Equal weights
Figure 2. SVD versus equal weights scores
SVD
Figure 3. Bootstrap SVD versus SVD
B o o ts tr ap SVD
None of the analyses gave the highest scores to programs with the highest share. The first reason is that it is a homogeneous variable; as a consequence, it was not as important as the duration in the equal weight analysis. The second reason is that this variable was not so crucial for the SVD weights as the audience was. Notwithstanding, even though the share and duration were not determinant to make a program reaching a high or low score in the SVD analyses, it helped to change the order of the programs when we compare with the audience rank. For instance, the Top 1 program concerning the audience was the second both in the SVD and bootstrap rank because they also considered its share and duration.
When we compare the programs with the best and worst performance in the equal weight analysis, we see that the main difference between them is the duration (Top 1=23,100 Bottom 1=86), whereas the audience (Top 1=0.78, Bottom 1=0.64) and share (Top 1=3.84, Bottom 1=2.34) are similar. On the other hand, when we compare the programs with the best and worst performance in the SVD analysis, we see differences in the audience (Top 1=1.71, Bottom 1=0.63), share (Top 1=11.65, Bottom 1=2.14), and duration (Top 1=30, Bottom 1=374). In the Bootstrap SVD analysis, the programs with the best and the worst performance were the same as in the SVD analysis.
5.2. Robustness analysis
Then, we performed a robustness analysis to compare the three TOPSIS approaches to eight other indicators. This way we could also take into account: (1) all the possibilities of the importance of each criterion; (2) the criteria without correlation; (3) the reliability of the information with few respondents. From indicator 1 to 6, we standardized the three criteria and used a weighted average, performing the NG-model. The seventh model we employed was PCA. The last model employed was GRA.
5.2.1. NG-model
NG-model converts all criteria measures into a scalar score and applies the classification based on the calculated scores using the ABC principle (Ng, 2007). The advantage of this approach is that the weights are automatically generated when the model is optimized, that is, they are not subjective as TOPSIS, in which weights were specified by the specialists (Wanke et al., 2015). We followed Wanke et al. (2015) and used combinatorial analysis to generate the full universe f combinations where the criteria are
ranked in different orders of importance. Specifically, the model was run 3! = 6 times for the full set of criteria combinations in different orders of importance. For instance, as Table 5 shows, indicator 1 consider that audience is the most, and the duration is the least important criterion. In all times, the summation of the weights for the criteria was equal to one, observing the constraints of the linear program.
According to Wanke et al. (2016a), in the NG-model, we first transform all measures to a baseline for purposes of comparison, using the transformation:
𝑦𝑖𝑗− 𝑚𝑖𝑛{𝑦𝑖𝑗} 𝑚𝑎𝑥{𝑦𝑖𝑗} − 𝑚𝑖𝑛{𝑦𝑖𝑗}
The Ng-model converts all measurement in a 0 −1 scale for all items. To facilitate the ranking under multiple criteria, we define a nonnegative 𝑤𝑖𝑗which is the weight of contribution of performance of the ith item under the jth criteria to the score of the item. The criteria are assumed to be ranked in descending order, such that wi1 ≥ wi2 ≥ ... ≥ wij
for all item i. The Ng-model for aggregation purposes is given as follows:
max 𝑆𝑖 = ∑ 𝑦𝑖𝑗𝑤𝑖𝑗 𝐽 𝑗=1 s. t. ∑ 𝑤𝑖𝑗 = 1 𝐽 𝑗=1 wi1 ≥ wi2 ≥ ... ≥ wij wij ≥ 0, i=1,…, I & j=1,…, J 5.2.2. PCA
PCA, created by Pearson (1901), transforms possibly correlated variables into a number of uncorrelated variables and explaining the variance structure of a data matrix through linear combinations of variables, reducing the data to a few principal components, which generally account for 80–90% of data variance (Wanke et al., 2016a). In this case, we used the same weight for the three criteria, as can be seen in Table 5. Per Wanke et al. (2016a), let the random vector X = [ X1 , X2 ,..., Xp ] (i.e., the original criteria
were chosen to be aggregated) have the correlation matrix C with eigenvalues λ1 ≥ λ2 ≥... ≥
λp ≥ 0 and normalized eigenvectors 𝑙1, 𝑙2,..., 𝑙𝑝 Consider the linear combinations, where
the superscript t represents the transpose operator:
(9)
(10)
𝑋𝑃𝐶𝑖 = 𝑙𝑖𝑡𝑋 = 𝑙1𝑖𝑋1+ 𝑙2𝑖𝑋2+ ⋯ + 𝑙𝑝𝑖𝑋𝑝 𝑉𝑎𝑟(𝑋𝑃𝐶𝑖) = 𝑙𝑖
𝑡𝐶𝑙
𝑖 𝑖 = 1,2, … , 𝑝
𝐶𝑜𝑟𝑟𝑒𝑙𝑎𝑡𝑖𝑜𝑛(𝑋𝑃𝐶𝑖, 𝑋𝑃𝐶𝑘) = 𝑙𝑖𝑡𝐶𝑙𝑖𝑘, 𝑖 = 1,2, … , 𝑝, 𝑘 = 1,2, … , 𝑝
The principal components are the uncorrelated linear combinations X PCi , X PC2 ,…, XPCp
ranked by their variances in descending order.
5.2.3. GRA
GRA, created by Ju-Long (1982), was documented to be efficient for solving an MCDM problem (Kuo et al., 2008) and it is appropriate for solving the complex interrelationships between multiple factors and variables (Morán et al., 2006). In our specific case, GRA was suitable because we had a small number of specialists choosing the weights. We discriminated the importance of the audience and the share in relation to duration. As explained in section 3.1, the duration is the more ambiguous of the three indicators because it is subject of kurtosis and plateau since there is a higher variation and more extreme data.
According to Morán et al. (2006), in the GRA, data are first pre-processed to normalize the raw data for analysis. Considering a grey system where a set of variables 𝑦𝑖depend on certain independent factors 𝑥𝑗, all the possible combination of normalized results 𝑥𝑖𝑗can be expressed if the performance characteristic is the higher the
better as:
𝑥𝑖𝑗 = 𝑦𝑖𝑗− 𝑚𝑖𝑛𝑗𝑦𝑖𝑗 𝑚𝑎𝑥𝑗𝑦𝑖𝑗− 𝑚𝑖𝑛𝑗𝑦𝑖𝑗
where yij is the ith result for the jth specialist. Or if the performance characteristic is
the lower, the better pattern, as:
𝑥𝑖𝑗 =
𝑦𝑖𝑗 − max
𝑗 𝑦𝑖𝑗
min
𝑗 𝑦𝑖𝑗− max𝑗 𝑦𝑖𝑗
The grey relational coefficient, ξij , is calculated to express the relationship between the ideal (best) and the actual normalized results
(13)
(15) (11) (12)
ξij = min 𝑖 min𝑗 |𝑥𝑖 0 − 𝑥 𝑖𝑗| + 𝜁 max 𝑖 max𝑗 |𝑥𝑖 0− 𝑥 𝑖𝑗| |𝑥𝑖0 − 𝑥𝑖𝑗| + 𝜁 max 𝑖 max𝑗 |𝑥𝑖 0− 𝑥 𝑖𝑗|
where 𝑥𝑖0is the ideal standardized result for the ith performance characteristic and 𝜁 is the so-called distinguishing coefficient (0 ≤ 𝜁 ≤ 1).
The overall evaluation of the multiple variables is based on the grey relational grade, which is computed by averaging the grey relational coefficient corresponding to each performance characteristic,
ϒ𝑗 = 1
𝑀∑ 𝜉𝑖𝑗
𝑚
𝑖=1
where ϒ𝑗is the grey relational coefficient for the jth specialist, and m is the number of performance characteristics (variables).
5.2.4. Results of the robustness analysis
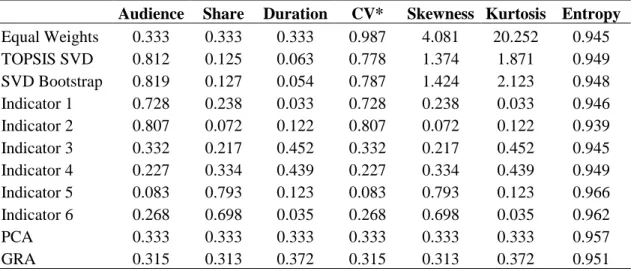
As can be seen in Table 5, both SVD and Bootstrap SVD TOPSIS have an intermediary value for the coefficient of variation, skewness, and kurtosis. Moreover, all models have a large and similar entropy, meaning that they comprehend many effects factor on their evaluation.
Table 5 – Weights of the criteria and statistics of the indicators
Audience Share Duration CV* Skewness Kurtosis Entropy
Equal Weights 0.333 0.333 0.333 0.987 4.081 20.252 0.945 TOPSIS SVD 0.812 0.125 0.063 0.778 1.374 1.871 0.949 SVD Bootstrap 0.819 0.127 0.054 0.787 1.424 2.123 0.948 Indicator 1 0.728 0.238 0.033 0.728 0.238 0.033 0.946 Indicator 2 0.807 0.072 0.122 0.807 0.072 0.122 0.939 Indicator 3 0.332 0.217 0.452 0.332 0.217 0.452 0.945 Indicator 4 0.227 0.334 0.439 0.227 0.334 0.439 0.949 Indicator 5 0.083 0.793 0.123 0.083 0.793 0.123 0.966 Indicator 6 0.268 0.698 0.035 0.268 0.698 0.035 0.962 PCA 0.333 0.333 0.333 0.333 0.333 0.333 0.957 GRA 0.315 0.313 0.372 0.315 0.313 0.372 0.951 *Coefficient of Variation
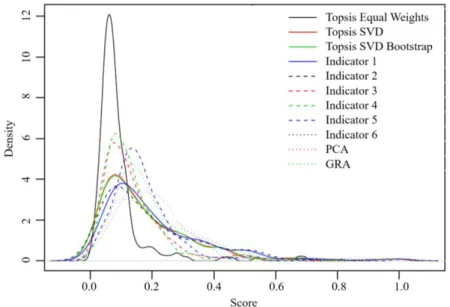
Figure 4 illustrates the density of each model. The equal weight TOPSIS is too concentrated with small dispersion and small differentiation between the scores. Both (16)
SVD and Bootstrap SVD TOPSIS are more asymmetrical than equal weights, and they consider more extreme effects since the kurtosis is greater. However, SVD and Bootstrap SVD TOPSIS do not give so much weight to very extreme events, such as indicator 1, PCA and GRA, which have a very long tail.
Figure 4 – Indicators: Density versus scores
Thus, SVD and Bootstrap SVD TOPSIS have a good balance between equal weights TOPSIS and the other models because the former ones discriminate more the data, but are not so impacted by outliers if we compare to the models that have a long tail. In sum, SVD and Bootstrap SVD have the best balance between kurtosis and asymmetry and, as expected, revealed to be the best approach to do this performance analysis. As illustrated in Figure 5, the TOPSIS indicators are those that can reflect all dimensions of analysis of the indicators.
5.3.Contextual variables
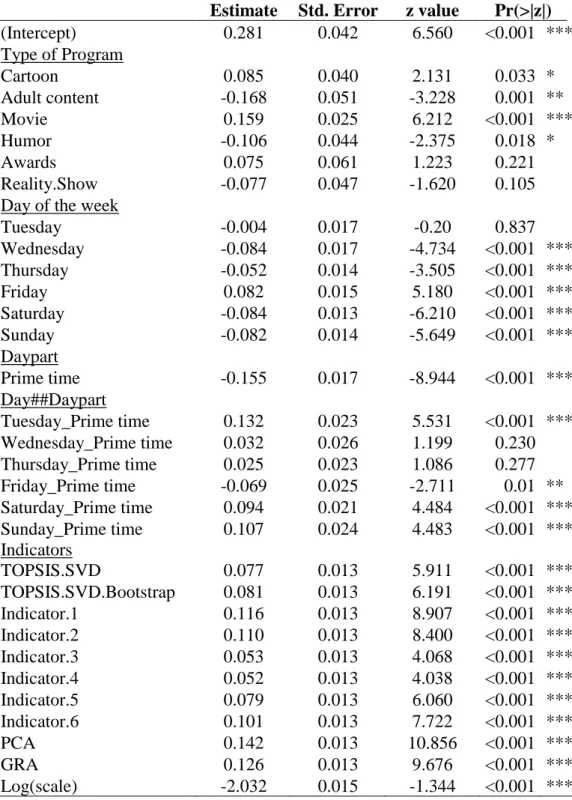
Further, we analyze the results of the Tobit regressions by considering the scores of all the models above and using them as dummies in which 1 means that the score derived from the model and 0 otherwise. As Table 6 shows, cartoon (β=.085, p=.033) and movie (β=.159, p<.001) are positively significant while adult content (β=-.160, p=.001) and humor (β=-.100, p=.001) were negatively significant. The only channel positively significant (β=.181, p=.001) is specialized in action and crimes series.1
Friday was the only day of the week that was positively significant (β=.082, p<0.01), while prime time was negatively significant (β=-.155, p<0.01). Although it seems odd to have prime time as an adverse contextual variable, Table 7 shows that the only standardized variable that has a higher mean in the prime time is the duration. Since the duration is the sum of the minutes aired the whole year, it makes sense that constant programs are broadcasted during prime time, while programs that are being tested and are usually discontinued are aired in the other dayparts. On the other hand, the share of the programs is higher in the other dayparts because the networks have a very strong prime time in Brazil. Furthermore, there is almost no difference between the audience in the prime time and in the other dayparts. Hence, the share of the programs was responsible for making the prime time to be a negatively significant daypart.
Moreover, when we analyze the interaction, we see a different scenario: the prime time of Thursday (β=.133, p<0.01), Saturday (β=.094, p<0.01) and Sunday (β=.108, p<0.01) are positively significant, whereas the prime time of Friday is negatively significant (β=-.069, p<0.01).
Table 6 - Tobit regression
Estimate Std. Error z value Pr(>|z|)
(Intercept) 0.281 0.042 6.560 <0.001 *** Type of Program Cartoon 0.085 0.040 2.131 0.033 * Adult content -0.168 0.051 -3.228 0.001 ** Movie 0.159 0.025 6.212 <0.001 *** Humor -0.106 0.044 -2.375 0.018 * Awards 0.075 0.061 1.223 0.221 Reality.Show -0.077 0.047 -1.620 0.105
Day of the week
Tuesday -0.004 0.017 -0.20 0.837 Wednesday -0.084 0.017 -4.734 <0.001 *** Thursday -0.052 0.014 -3.505 <0.001 *** Friday 0.082 0.015 5.180 <0.001 *** Saturday -0.084 0.013 -6.210 <0.001 *** Sunday -0.082 0.014 -5.649 <0.001 *** Daypart Prime time -0.155 0.017 -8.944 <0.001 *** Day##Daypart Tuesday_Prime time 0.132 0.023 5.531 <0.001 *** Wednesday_Prime time 0.032 0.026 1.199 0.230 Thursday_Prime time 0.025 0.023 1.086 0.277 Friday_Prime time -0.069 0.025 -2.711 0.01 ** Saturday_Prime time 0.094 0.021 4.484 <0.001 *** Sunday_Prime time 0.107 0.024 4.483 <0.001 *** Indicators TOPSIS.SVD 0.077 0.013 5.911 <0.001 *** TOPSIS.SVD.Bootstrap 0.081 0.013 6.191 <0.001 *** Indicator.1 0.116 0.013 8.907 <0.001 *** Indicator.2 0.110 0.013 8.400 <0.001 *** Indicator.3 0.053 0.013 4.068 <0.001 *** Indicator.4 0.052 0.013 4.038 <0.001 *** Indicator.5 0.079 0.013 6.060 <0.001 *** Indicator.6 0.101 0.013 7.722 <0.001 *** PCA 0.142 0.013 10.856 <0.001 *** GRA 0.126 0.013 9.676 <0.001 *** Log(scale) -2.032 0.015 -1.344 <0.001 *** Signif. codes: 0 ‘***’ 0.001 ‘**’ 0.01 ‘*’ 0.05 ‘.’ 0.1 ‘ ’ 1 Table 7- Prime time versus other day parts
Prime time Other day parts
Variable Mean Std. Dev. Min Max Mean Std. Dev. Min Max
Audience .185 .164 0 .613 .183 .192 0 1
Share .097 .060 0 .238 .181 .122 .014 1
When we compare the programs with the best and worst performance in the equal weight analysis, we see that the main difference between them is the duration (Top 1=23,100 Bottom 1=86), whereas the audience (Top 1=0.78, Bottom 1=0.64) and share (Top 1=3.84, Bottom 1=2.34) are similar. Analyzing the contextual variables, we see that the Top 1 was aired from Monday to Friday and the Bottom 1 was aired only on Wednesday, a negatively significant variable in the Tobit regression. Additionally, whereas the Bottom 1 was broadcasted during prime time, the Top 1 was not.
Nevertheless, the results change dramatically in the SVD analysis. Firstly, the main difference between them is the audience (Top 1=1.71, Bottom 1=0.65) and share (Top 1=11.65, Bottom 1=3.10), whereas the duration is similar (Top 1=30, Bottom 1=48). Secondly, analyzing the contextual variables, we see that the Top 1 was aired on Sunday and the Bottom 1 on Saturday, although both variables are negatively significant in the Tobit regression. As in the equal weight analysis, the Bottom 1 was broadcasted during prime time, and the Top 1 was not. Both programs are cartoons, a type of program that was positively significant in the Tobit regression. In the Bootstrap SVD analysis, best and the worst performance were the same as in the SVD analysis.
Comparing the ranking of all the models, we see that all programs with the best performance are cartoons. However, they are aired from Monday to Friday to the equal weights TOPSIS, on Sunday to the SVD TOPSIS models and on Saturday to the others. None of the programs with the best performance are aired on the primetime. Analyzing the Bottom 1 programs, we see that only in the cases of the SVD analyses and indicator 1 the Bottom 1 is a cartoon. In other cases, the Bottom 1 is a movie, although this a type of program that is positively significant. This conclusion demonstrates the importance of the Tobit regression to assess the effect of the contextual variables since the results cannot be evaluated by looking at the ranking.
6. Conclusion
This is a time of constant transformation in the entertainment industry. Executives are relying more than ever on data analysis to make better decisions. Performance analysis has been used in many fields to solve MCDM problems. The performance of programs is one of the cases in which this analysis can be utilized. This study employed the TOPSIS method to assess the performance of the programs, SVD to select the weights given for each criterion, and the Tobit regression to investigate which contextual characteristics influence the performance score, including the equal weight TOPSIS, SVD TOPSIS, Bootstrap SVD TOPSIS, NG-model, PCA and GRA.
This research introduces a fresh understanding of how TV decision makers can use benchmarking analysis to measure the performance of programs. TOPSIS was fundamental in this analysis because, in the television data, many variables can be used as criteria for the performance of a program. Thus, we employed TOPSIS to show how an MCDM problem can be solved using the audience, share, and duration as the performance criteria.
By inspecting the weights given by the specialists, we see that although the weights had a similar average, their range was different. This conclusion has two implications. First, it indicates that it is essential to use a method (such as TOPSIS) that consider the weights of the criteria. Second, it reveals that SVD is relevant in this kind of analysis to assess the importance of each criterion because it could capture the nuances of the answers given by the specialists. It is important to emphasize that, for academic purpose, we interviewed specialists. Conversely, for practical use, audience researchers should choose the weights according to the company’s goal.
Finally, Tobit regression revealed to be fundamental to assess the effect of the contextual variables on the performance. By including the NG-model, PCA, and GRA, we could not only assess the distance from the positive and negative ideal solution, but also, we took into account all the possibilities of the importance of each criterion; the criteria without correlation; and the reliability of the information with few respondents. Furthermore, the combination of contextual variables in the regression, changed the results that could be found by looking at the ranking.
It is important to note that we used a Tobit regression in the second-stage analysis following the recommendation of Bogetoft & Otto (2011) and Hoff (2007). However, future research could test the same approach of the present study by comparing our results
with the procedure proposed by Simar & Wilson (2007), with a bootstrap procedure to improve statistical efficiency in the second-stage regression.
By applying these tools, practitioners can conclude what can be done to improve the performance of the programs. Also, the performance scores can be used as KPIs and be tied to the producer’s remuneration. Lastly, the scores may indicate which programs should start the prime time (Liu et al., 2004). The results reveal that this analysis is a compelling tool to help TV executives on the difficult task of changing the TV schedule. Although the approach used in the study can be applied in other contexts, the contextual variables that were considered positive or negative cannot be generalized. The results may vary according to the country evaluated, the public and year analyzed, among other factors. Future research can examine how these characteristics change according to the context.
Further works can also incorporate the programs’ costs as inputs and commercial revenues as outputs to make the analysis more complete. Nevertheless, it is fundamental to show that the study can be conducted without the costs of the programs since they are more difficult to assess because the institute software does not provide them. Therefore, to use these criteria, the analysis needs to be done as an inter-organization comparison, that is comparing the TV programs of the same company.
Future research can extend this work by adding more criteria, such as social media posts, production costs, and metrics of the online videos. Another future direction could be to apply the method utilized in this study to videos of the TV channels’ online platform and to analyze websites and apps performance. Lastly, it is important to emphasize that in cases that qualitative variables are used, such as the importance of a soccer championship, the analyst should use the Fuzzy-TOPSIS approach, following Lima Junior & Carpinetti's (2015) recommendation.
Studies concerning television audience usually have implications to the Marketing strategy either for the advertisers (e.g., Liu, Putler, & Weinberg, 2004; Olson & Thjømøe, 2012; Du, Xu, & Wilbur, 2017) or for the TV channels (e.g., Yang, Narayan, & Assael, 2006). Nevertheless, the present research provides a tool that can be used to increase the effectiveness of the programming strategies by using as many criteria are available and necessary. Future research could investigate other ways to increase the assertiveness of the TV schedule.
The increased challenges faced by companies forces analysts to seek out for new approaches and methodologies that facilitate the decision-making process, including
performance analyses and the identification of critical success factors via multiple criteria (Ferreira et al., 2019). We uniquely applied SVD, TOPSIS, and Tobit regression to assess the performance of TV programs and comprehend the effect of the contextual variables. Hence, the proposed methodology proved to be of value by the simplicity of application and the importance for the sector.