MASTER
FINANCE
MASTER´S THESIS
DISSERTATION
Determinants of the returns on equity of largest
Portuguese public limited companies
Miguel Sapiro Vaz Josue
MASTER
FINANCE
MASTER´S THESIS
DISSERTATION
Determinants of the returns on equity of largest
Portuguese public limited companies
Miguel Sapiro Vaz Josue
Supervisor: Professor Maria João Coelho Guedes,
i
This study analyzes the impact that financial ratios, divided into profitability, efficiency solvency and liquidity, have on the Return on Equity (ROE) while as well as studying how the ROE variated, for a universe of 5000 Portuguese Public Limited Companies according to the sales volume between 2009 and 2013. For that purpose the Multiple Linear regression model with panel data is used. The results vary across sectors. Hence, the sample was split between financial and non-financial firms. Except for Current Ratio, all the remaining financial ratios show statistic positive significance for the non-financial firms ROE. The findings concerning the financial firms indicate that only Debt to Equity (solvency), Lagged ROE (profitability) and Current Ratio (liquidity) are not statistically significant, while the remaining financial ratios show statistic positive significance with ROE.
Key Words: Profitability; Efficiency; Solvency; Liquidity; Panel Data; Return on Equity;
ii
First off I would like to thank my Professor Maria João Coelho Guedes for the incredible patience, for guiding me through this process and for the ability to encourage her students to never give up and keep pushing forward in order to exceed expectations.
To my friends, parents and brother who were my confidents and supported me when things weren’t going as expected.
Last but not least, a special thanks to my girlfriend Maria. Without her, I certainly would have not come this far.
iii
Índice
Abstract ... i
Acknowledgments ... ii
Table of Contents ... iii
List of Tables and Annex... iv
List of Abbreviations ... v
Introduction ... 1
2. Literature Review ... 2
2.1. Utility of Financial Ratios ... 2
2.2.1. Particular Importance of Return on Equity ... 5
2.2.2. Shareholder view of the Return on Equity ... 6
2.2. Determinants of Return on Equity and the Hypothesis ... 7
3. Data and Methodology... 10
3.1. Variables Definition ... 12 3.1.1 Dependent Variable ... 12 3.1.2 Independent Variables ... 12 3.2. Methodology ... 15 4. Results ... 16 4.1. Descriptive Statistics ... 16 4.2 Regressions Results ... 18 4.3. Financial vs Non-Financial ... 23 4.3.1. T-test ... 25
4.3.2. Financial vs Non-Financial Regressions ... 26
6. Conclusions ... 29
6.1. Final Conclusions ... 29
6.2. Limitations ... 31
6.3. Suggestions for further researches ... 31
7. References ... 32
iv
Table I – Companies by CAE ... 11
Table II – Independent Variables ... 14
Table III – Descriptive Statistics and Correlation Variable Matrix ... 17
Table IV – Hausman Test ... 18
Table V – Regressions Results... 21
Table VI – Regression Results ... 22
Table VII – Descriptive Statistics and Correlation Variable Matrix of Financial sector ... 24
Table VIII – ROE financial mean variation ... 25
Table IX –T-Test for the means between Financial vs Non-Financial... 26
Table X – Financial vs Non-Financial Regression ... 28
v
CAE - Classificação Portuguesa de Actividades Económicas
FE – Fixed Effects
GDP – Gross Domestic Product
IES - Informação Empresarial Simplificada
IMF – International Monetary Fund
OLS – Ordinary Least Squares
RE – Random Effects
ROE – Return on Equity
STATA – Statistics and Data Χ2 - Chi-square Statistics
1
Introduction
The aim of this dissertation is to study determinants of Return on Equity (ROE) with regard to Portuguese Public Limited Companies between 2009 and 2013. ROE is a financial ratio used for comparisons between companies within and from different industries, in order to assess profitability and to enable shareholders to identify and compare investment opportunities and establish which are best suited to their return requirements (Popov & Roosenboom, 2009). There is currently great demand for equity, as “Security analysts issue far more buy than sell recommendations because all customers are potential buyers” (Jacobs & Levy, 1993, page. 58). In case of Portugal, there is also growing demand for investment in the equity of Portuguese companies (Domingos, 2010). Even with this increase in demand for equity, investors are still more cautious when choosing which Portuguese companies to invest because of the 2008 world crisis. The financial stability of Portuguese companies was greatly affected by the crisis. This is the context in which this dissertation analyzes how the ROE ratio of the Portuguese companies has performed since the 2008 financial crisis and what were the main determinants that influenced the variation of ROE, so that Portuguese companies understand how to react in order to improve ROE in a future financial crisis.
ROE is influenced by different determinants that describe distinct aspects of a company (Boyd et al., 2007). The determinants used to analyze ROE in this dissertation are Debt to Equity, Asset to Equity, Net Profit Margin, Asset Turnover, Current Ratio, lagged value of ROE and ROE risk. These determinants relate to solvency, profitability, efficiency, and liquidity. Debt to Equity and Asset to Equity ratios were calculated for solvency. The lagged value of ROE [(t-1)ROE] and Net Profit Margin were calculated for
2
profitability. For liquidity and efficiency, Current Ratio and Asset Turnover were respectively calculated. This dissertation analyzes, in a period of financial instability, how the level of debt (solvency) incurred by Portuguese companies and its cost efficiency and profitability measures impacts on ROE. Using the same determinants, a separate analysis was performed concerning only the ROE for the financial sector, since this sector has an important role in Portugal when financing the Portuguese economy (Domingos, 2010).
In all sectors of activity it was observed that all the determinants are positively significant with ROE. Contrary to the expected, the determinants which reflect liquidity did not show any significance with the model.
The dissertation is organized in various sections. The Literature Review and the corresponding hypothesis are presented in chapter 2; chapter 3 describes the data to be used, their variables and the methodology; chapter 4 analyzes the results between the financial sector and the remaining sectors, while chapter 5 concludes with findings, limitations of the dissertation and with suggestions for further research.
2. Literature Review
2.1. Utility of Financial Ratios
ROE is an important financial ratio and according to Abdel et al., (2012, page. 115), a financial ratio “(…) can be defined as a relationship between two individual quantitative financial information connected with each other (…) and this connection is considered as a meaningful financial indicator”. Financial ratio is an important tool to analyze the financial statements and to ensure financial control. Since financial
3
statements are usually lengthy, it is more efficient to pick the correct variables for pre-defined ratios that describe the strengths and weaknesses of a company´s financial situation (Tugas & Cisa, 2012). Financial control is imperative for the sustainability of any company but “the qualitative aspects of a business are far more appellative than financial record keeping and analysis (…) there is much evidence that a lack of financial control is often a quick path to business failure” (Liesz, 2002, page. 1).
The financial ratios are used with the primary objective of evaluating companies’ performance. Financial ratios also concentrate information regarding business quality measurement and the decision making process that will be of assistance when evaluating a company (Zager, 2006).
Altman (1968) explains that detecting difficulties and financial struggles inside a company is more manageable and easier when using financial ratios. However with the proper use of distinct ratios, it is possible and easy to make comparisons across companies, within and between industries or within the firm itself (Delen et al., 2013). A similar explanation is also given by Nissim & Penman (2001) where financial ratios can specify and measure the differences between individual and benchmark comparable peers in order to identify what is causing negative or positive differences in their financial and operational performance.
Financial ratios are also divided into four different categories: profitability, liquidity, solvency and efficiency (Gibson, 1982). Each of those categories can help predict and study the financial situation of any company (Altman, 2012). Financial liquidity is viewed as the ability of a company to meet its short term liabilities in due time, via
4
recourse to high-liquidity liquidity assets, which are termed current assets (Bolek & Wilinski 2012).
Profitability is described as the ability of any firm to make a profit from its business activities, which will show how efficiently a company uses its resources in order to create value (Trivedi, 2010).
Solvency “(…) indicates the company´s ability to repay its debts in a liquidation scenario. Unlike liquidity, solvency is related to both long and short term assets and liabilities-.” (Guimarães & Nossa, 2010, page. 47);
Efficiency describes how efficient a company is when managing its assets and exists when “(…) a firm reaches the optimal size for its industry and that produces the optimal mix of products given the prices of their production factors.” ( Amel et al., 2004, page. 6).
According to Damodaran (2007, page. 11) ROE “(...) focuses on just the equity component of the investment. It relates the earnings left over for equity investors after debt services costs have been factored in to the equity invested in the asset”. However, ROE does not detail information about how much cash will be returned to the shareholders but rather states whether a company can generate profit on its equity investment (Berman et al., 2013). Therefore, this makes ROE one of the most important financial indicators that investors use in order to assess whether their investments are profitable or not (Dietrich & Wanzenried, 2009).
5
Associating profitability with ROE when studying any firm´s financial situation, it is possible to provide information regarding cash flow potential, repayment capacity and an analysis of the overall wealth that the firm is capable of generating (Hine & Thilmany, 1998). However although profitability is a measure of a company’s wealth and vitality, it is also subject to various indirect factors such as its strategy, products, reputation, and personnel performance or others, in order to make a correct assessment regarding the company´s financial situation (Schönbohm, 2013).
2.2.1. Particular Importance of Return on Equity
ROE can be used to assess a company´s profitability or to apply benchmark comparisons. The importance of ROE is well-established because it will help explain what and how the company can change in order to increase its profitability. Greater importance is given to ROE because it is commonly used by investors when evaluating stock purchases and assessing the corporate performance (Acheampong, 2000). Nonetheless, the interpretation of ROE is not so direct and there are some variables that influence ROE calculation that the company cannot control directly, such as the tax paid or the company´s borrowing costs (Pagratis et al., 2014). ROE also does not consider the particular risk of a company and only assesses the possible returns it can generate from invested capital. This is seen as a drawback because investors care as much about risk as about benefits (Gadoiu, 2014). Besides when ROE is used as a measure of performance and as a way of determining a manager´s remuneration, this can encourage encourage them to invest in projects, which have higher than expected ROE, though those projects can be very risky for companies (Gadoiu, 2014). This usage
6
of ROE is seen as a major disadvantage and misleads possible investors and shareholders (Gadoiu, 2014).
ROE should be both a comparison tool and a performance indicator. The importance of a ratio that can describe the financial situation of a company is that it makes it possible to avoid an uncontrolled situation and respective failure. Having a higher ROE is also a way to attract investors in a company´s share. Equity influences corporate earnings and facilitates the execution of new projects without the need for indebtedness (ABI, 2013).
2.2.2. Shareholder view of the Return on Equity
ROE can be described as the percentage of current profit that a company will make according to its invested capital. ROE is therefore identified as a common financial ratio that is used when comparing the financial performance of competitors. ROE does not describe the amount of cash to be returned to the shareholders, as this depends on the company´s decision regarding the payment of dividends (Berkalne & Zelgave, 2014). As ROE is a profitability ratio that is primarily used to evaluate company´s performance, it is a powerful tool with which investors can identify those companies in which it is more propitious and advantageous to invest (Arzac, 1986). Shareholders therefore also view ROE as an important ratio for the analysis of the trade-off between risk and the performance that their invested capital will generate. There are shareholders who are interested in new projects that could increase a company´s value in the long term, but which can also cause an immediate decrease in ROE due to the sacrifice of present earnings in the anticipation of future earnings (Lesáková, 2007).
7
Therefore such an immediate decrease of ROE does not directly imply poor performance.
2.2. Determinants of Return on Equity and the Hypothesis
The factors that affect the variation of ROE and the extent to which certain determinants can affect the level of ROE are important. The different solvency, liquidity, profitability and efficiency determinants which are used to analyze the variation of ROE are based on the similar work of (Boyd et al., 2007). For Boyd et al. (2007, page. 208) “(…) firm effects, such as efficiency, liquidity, profitability, and solvency, are controllable and their effect is the result of managerial decisions and directors policy”. The solvency ratios are used to assess how capital structure and bankruptcy risk affects the firm’s ROE (Yusuf et al., 2014). The efficiency ratio takes into consideration how the efficient usage of the firm´s assets influences ROE. The liquidity ratio is used to explain how the firm´s short-term financial obligations influence ROE, while the profitability ratios describe how an increase or decrease in the operating margins affects ROE.
The determinants used in this dissertation that affect ROE are therefore Debt to Equity, Current Ratio, Asset Turnover, Net Profit Margin, Asset to Equity, Lag value of ROE ( ROEt-1) and standard deviation of ROE (ROE Risk).
The Debt to Equity, as a solvency ratio is usually a description of the capital structure of a firm and financial leverage. “(…) Financial Leverage is a measure of how much a company uses debt and equity to finance its assets, (…) as debt increases, financial leverage increases” (Rehman, 2013, page. 2). The amount of additional risk depends
8
on the amount of leverage, measured by the firm’s market value debt-equity ratio (Berk et al., 2014). Achieving an optimal value for companies’ capital structure means a possible increase in their financial performance and profitability (Yusuf et al., 2014). Evidence from Mwangi et al. (2014), shows that the Debt to Equity ratio has a negative effect on ROE. Phan (2013) also established a negative influence between Debt to Equity and ROE. This means that with an increase in the debt financing levels there is an associated decrease in ROE (Mwangi et al., 2014). These findings lead to the first hypothesis:
H1: Debt to Equity ratio is negatively associated with ROE
Current ratio is a liquidity ratio and describes the ability of companies to meet their short-term obligations and compares the firm´s current assets to its current liabilities (Mohammed & Kim-Soon, 2012). Its importance is translated into the ability for the firm to pay its short-term debt with its short term/current assets Mohammed & Kim-Soon (2012), and in which way such obligations affect ROE (Demerjian, 2007). Evidence from Adagye (2015) and Mohamad & Saad (2010) shows that Current Ratio has a negative association with ROE. Moreover Saleem & Rehman (2011) and Boyd et al. (2007) also explain that Current Ratio has a negative association with ROE, which leads to the second hypothesis:
H2: Current ratio is negatively associated with ROE
Asset Turnover is an efficiency ratio, which is calculated as the sales over total assets and describes the ability of companies to generate sales by using their assets Moyer et al. (2007). The higher this ratio, the more efficient a company is when generating
9
higher returns Moyer et al. (2007). According to Pouraghajan (2012), variable Asset Turnover is positively associated with ROE. Moreover, in Amos et al. (2014) and Boyd et al. (2007) there is also evidence of a positive association between Asset Turnover and ROE. That assumption leads to the third hypothesis:
H3: Asset Turnover is positively associated with ROE
Net Profit Margin is a profitability ratio and is the ratio between income before tax and sales. It concerns the effectiveness of the management team and reflects how much profit a company earns per dollar of its total sales (Ross, 2008). A significant positive association between ROE and the Net Profit Margin has been identified (Boyd et al. 2007; Circiumaru et al. 2010; Boldeanu & Pugna 2014). Leading to the fourth hypothesis
H4: Net Profit Margin is positively associated with ROE
Boyd et al. (2007) explains that Asset to Equity measures the inverse of the percentage of assets that can be claimed by shareholders. Asset to Equity is a description of the company’s capital structure and solvency. Usually the higher the value of this ratio the riskier the company will be (Pellika, 2009). Pagratis et al. (2014, page. 3) consider that “(…) a way to increase ROE is to increase the ratio of total assets to equity”. Leading to the fifth hypothesis:
H5: Asset to Equity ratio is positively associated with ROE
The lag value of ROE [ROE(t-1)] describes how past managerial actions, with regard to
10
value of ROE is used to control possible inter-temporal instabilities of the forecasting model (Esplin et al., 2010). Evidence in Boyd et al. (2007) suggests a positive association between lagged ROE and ROE. Likewise Esplin et al. (2010) and Goddard et al. (2004) also establish a positive association between lagged ROE and ROE which leads to the sixth hypothesis:
H6: Lag value of ROE is positively associated with ROE
The ROE Risk measures the variability of ROE over time. According to Boyd et al. (2007) greater risk leads to a higher value of ROE. Also “the extreme focalization on ROE may drive managers to take higher risks” Mossu & Petit-Romec (2013, page 19), which leads to the seventh hypothesis:
H7: Roe Risk is positively associated with ROE
3. Data and Methodology
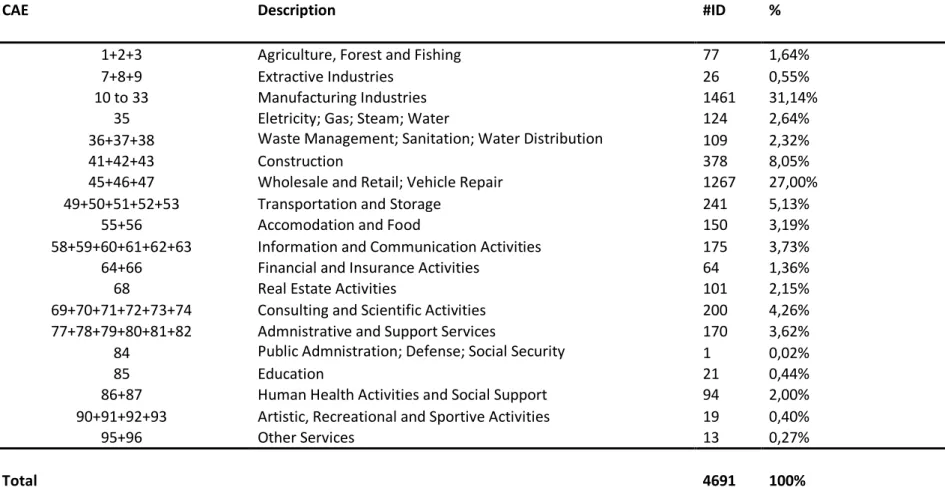
The initial sample comprises the 5000 largest Portuguese Public Limited Companies in terms of total sale, for the period 2009 to 2013. The data was collected from IES (Informação Empresarial Simplificada) and provided by Informa D & B. From the initial dataset, 5964, observations were dropped due to inconsistency, namely, those that presented negative Owner Equity and negative Net Income values, as the ROE would be positive, which would distort the results. The final sample comprises 4691 firms representing a total of 19036 observations. Table I shows that the most representative industry is manufacturing which accounts for 31,14%, of the sample. While the Public Administration and Defense; Compulsory Social Security sector represents 0,02% of
11
Table I – Companies by CAE
CAE Description #ID %
1+2+3 Agriculture, Forest and Fishing 77 1,64%
7+8+9 Extractive Industries 26 0,55%
10 to 33 Manufacturing Industries 1461 31,14%
35 Eletricity; Gas; Steam; Water 124 2,64%
36+37+38 Waste Management; Sanitation; Water Distribution 109 2,32%
41+42+43 Construction 378 8,05%
45+46+47 Wholesale and Retail; Vehicle Repair 1267 27,00%
49+50+51+52+53 Transportation and Storage 241 5,13%
55+56 Accomodation and Food 150 3,19%
58+59+60+61+62+63 Information and Communication Activities 175 3,73%
64+66 Financial and Insurance Activities 64 1,36%
68 Real Estate Activities 101 2,15%
69+70+71+72+73+74 Consulting and Scientific Activities 200 4,26%
77+78+79+80+81+82 Admnistrative and Support Services 170 3,62%
84 Public Admnistration; Defense; Social Security 1 0,02%
85 Education 21 0,44%
86+87 Human Health Activities and Social Support 94 2,00%
90+91+92+93 Artistic, Recreational and Sportive Activities 19 0,40%
95+96 Other Services 13 0,27%
12
3.1. Variables Definition
The dependent variable is ROE. The independent variables are: the lagged value of ROE (Return on Equity(t-1)), Asset to Equity, Debt to Equity, Asset Turnover, Net Profit
Margin, Current Ratio, ROE Risk and the control variables SIZE and CAE. The natural logarithm was taken into consideration in order to deal with different scales.
3.1.1 Dependent Variable
The ROE ratio is the dependent variable. This variable has important information when assessing the profitability of a company.
Similar to Loi & Khan (2012) ROE is calculated as: ROE = 𝑁𝑒𝑡 𝐼𝑛𝑐𝑜𝑚𝑒
𝑂𝑤𝑛𝑒𝑟𝑠 𝐸𝑞𝑢𝑖𝑡𝑦 (1)
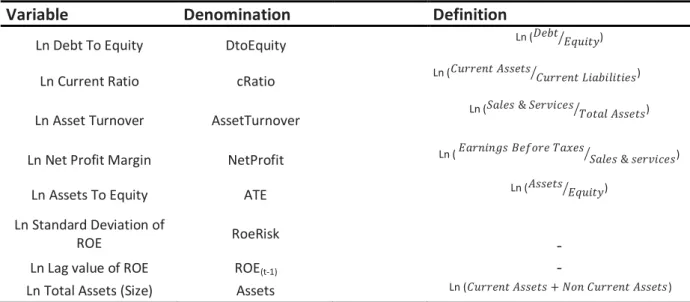
3.1.2 Independent Variables
The independent variables used in this dissertation are based on the work by Boyd et al. (2007). The definitions of the variables are summarized in Table II.
The Debt to Equity ratio is usually described as a financial leverage performance indicator. It is used to evaluate the order and extent to which a company is financed by debt or equity (Gallo & Vilaseca, 1996). The ratio is defined as follow:
13
Current ratio is a liquidity ratio. By analyzing how current ratio varies, it is possible to evaluate if the company is using debt or equity to finance its current assets (Boyd et al., 2007). Current Ratio can be used to reflect the association between liquidity and profitability ( Berk & DeMarzo,2011). The ratio is defined as follow:
Current Ratio = 𝐶𝑢𝑟𝑟𝑒𝑛𝑡 𝐴𝑠𝑠𝑒𝑡𝑠
𝐶𝑢𝑟𝑟𝑒𝑛𝑡 𝐿𝑖𝑎𝑏𝑖𝑙𝑖𝑡𝑖𝑒𝑠
(3)
Asset Turnover ratio is important when analyzing the impact of sales & services on the company´s profitability (Jansen et al., 2012). It is considered to be an efficiency ratio and measures how efficiently a company will generate sales and service revenues according to its assets (Domeika, 2008). The ratio is defined as follow:
Asset Turnover = 𝑆𝑎𝑙𝑒𝑠&𝑆𝑒𝑟𝑣𝑖𝑐𝑒𝑠𝑇𝑜𝑡𝑎𝑙 𝐴𝑠𝑠𝑒𝑡𝑠 (4)
The Net Profit Margin Ratio is a profitability ratio and it is used to describe the relationship between ROE and Return on sales. In order to establish a positive value for this ratio, companies should primarily focus on the relation between their sales and their corresponding operating costs in order to increase their operating margins (Cho, 1999).The ratio is defined as follow:
Net Profit Margin = 𝐸𝑎𝑟𝑛𝑖𝑛𝑔𝑠 𝐵𝑒𝑓𝑜𝑟𝑒 𝑇𝑎𝑥𝑒𝑠
𝑆𝑎𝑙𝑒𝑠 𝑎𝑛𝑑 𝑆𝑒𝑟𝑣𝑖𝑐𝑒𝑠 (5)
Assets to Equity is a solvency ratio, which is the inverse of the more frequently used of Equity to Assets ratio. It also measures the firm´s leverage position and evaluates the amount of equity to be used to finance investments (Boyd et al, 2007). The ratio is defined as follow:
Assets to Equity = 𝐴𝑠𝑠𝑒𝑡𝑠
14
ROE Risk is an important variable and was added to describe the standard deviation of ROE and is a risk variable that “(…) measures variability of ROE over time” (Boyd et al., 2007, page. 206). ROE Risk is the average standard deviation calculated between two years over the period of 2009 and 2013.
ROERisk = Standard Deviation (Return on Equity)
The lag value of the Return on Equity [ROE(t-1)], is used in order to account for the possible influence that past values of ROE and past managerial decisions have on the variation of ROE (Boyd et al., 2007).
The control variable Size is ln total Assets, used to account for possible economies of scale and to analyze how the dimension of each company affect its profitability (Boyd et al., 2007). As stated by Liargovas & Skandalis (2005, page.10 ).“(…) the size of the firm is an important factor as it influences its competitive power”.
Table II – Independent Variables
Variable Denomination Definition
Ln Debt To Equity DtoEquity Ln (𝐷𝑒𝑏𝑡 𝐸𝑞𝑢𝑖𝑡𝑦⁄ )
Ln Current Ratio cRatio Ln (𝐶𝑢𝑟𝑟𝑒𝑛𝑡 𝐴𝑠𝑠𝑒𝑡𝑠 𝐶𝑢𝑟𝑟𝑒𝑛𝑡 𝐿𝑖𝑎𝑏𝑖𝑙𝑖𝑡𝑖𝑒𝑠⁄ )
Ln Asset Turnover AssetTurnover Ln (𝑆𝑎𝑙𝑒𝑠 & 𝑆𝑒𝑟𝑣𝑖𝑐𝑒𝑠 𝑇𝑜𝑡𝑎𝑙 𝐴𝑠𝑠𝑒𝑡𝑠⁄ )
Ln Net Profit Margin NetProfit Ln ( 𝐸𝑎𝑟𝑛𝑖𝑛𝑔𝑠 𝐵𝑒𝑓𝑜𝑟𝑒 𝑇𝑎𝑥𝑒𝑠⁄𝑆𝑎𝑙𝑒𝑠 & 𝑠𝑒𝑟𝑣𝑖𝑐𝑒𝑠)
Ln Assets To Equity ATE Ln (𝐴𝑠𝑠𝑒𝑡𝑠 𝐸𝑞𝑢𝑖𝑡𝑦⁄ )
Ln Standard Deviation of
ROE RoeRisk -
Ln Lag value of ROE ROE(t-1) -
15
3.2. Methodology
A multiple linear regression analysis was used, on unbalanced panel data, using for that purpose the statistic program STATA 12.1. In this dissertation two models are used. Equation 8 has the lagged value of the dependent variable [ROE(t-1)] and the
equation 7 does not. This distinction was made in order to evaluate whether the performance of (t-1) period plays an important role in explaining the performance of the current period t.
The dependent variable is the same in both models, whereas the independent variables are different. Hence in equation (8) the lagged value for ROE (t-1) is considered.
Two different models were proposed, in order to study this impact on ROE:
lnROEit = α +β1lncRatioit + β2lnATEit + β3lnNetProfitit + β4lnAssetTurnoverit +
β5lnDtoEquityit + β6lnROERiskit + β7lnAssetsit + 𝑢it (7)
lnROEit = α +β1lnROEi(t-1) + β2lncRatioit + β3lnATEit + β4lnNetProfitit +
β5lnAssetTurnoverit + β5lnDtoEquityit + β7lnROERiskit + β8lnAssetsit + 𝑢it (8)
In which Index i corresponds to the firm (𝑖 = 1,…, 5000) and t concerns the number of years (t = 2009,...,2013).
16
The models will be estimated using the Ordinary Least Square method (OLS), the Fixed
Effects method (FE) and the Random Effect method (RE). A Hausman test Hausman
(1978) was performed to assess the choice between FE and RE. If the null hypothesis is rejected, the appropriate model is the FE. Likewise if the null hypothesis is not rejected, the appropriate model is RE. The STATA robust option was used in all the final regressions, in order to deal with the presence of possible heteroscedasticity.
4. Results
4.1. Descriptive Statistics
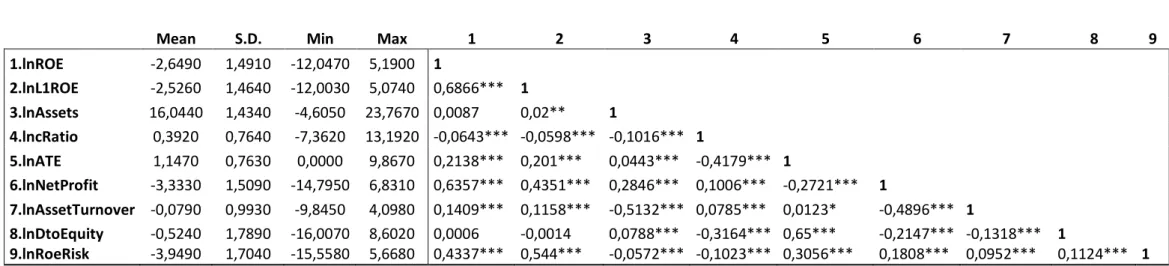
Table III presents the descriptive statistics and correlation between the variables (in ln). The same analysis made to the non- ln variables transformation is in the Annex I. In annex I, the non-ln ROE mean of all sample observations is 0,1810 (18,10%) which means that every euro of shareholders equity, generates 0,1810 euro.
Regarding the correlation between the dependent and the independent variables there is only one significant negative correlation between the lnROE and lncRatio. So far as the significance of the correlations with lnROE is concerned, only lnAssets and LnDtoEquity do not appear to be statistically significant. Also the lnDtoEquity is not statistically significant with the lagged value of ROE. The ln ROE (t-1) and ln ROE RISK
appears to have a positive and significant correlation with the dependent value of ROE which is the same result as analyzed in the dissertation of Boyd et al. (2007).
17
Table III – Descriptive Statistics and Correlation Matrix
Mean S.D. Min Max 1 2 3 4 5 6 7 8 9
1.lnROE -2,6490 1,4910 -12,0470 5,1900 1 2.lnL1ROE -2,5260 1,4640 -12,0030 5,0740 0,6866*** 1 3.lnAssets 16,0440 1,4340 -4,6050 23,7670 0,0087 0,02** 1 4.lncRatio 0,3920 0,7640 -7,3620 13,1920 -0,0643*** -0,0598*** -0,1016*** 1 5.lnATE 1,1470 0,7630 0,0000 9,8670 0,2138*** 0,201*** 0,0443*** -0,4179*** 1 6.lnNetProfit -3,3330 1,5090 -14,7950 6,8310 0,6357*** 0,4351*** 0,2846*** 0,1006*** -0,2721*** 1 7.lnAssetTurnover -0,0790 0,9930 -9,8450 4,0980 0,1409*** 0,1158*** -0,5132*** 0,0785*** 0,0123* -0,4896*** 1 8.lnDtoEquity -0,5240 1,7890 -16,0070 8,6020 0,0006 -0,0014 0,0788*** -0,3164*** 0,65*** -0,2147*** -0,1318*** 1 9.lnRoeRisk -3,9490 1,7040 -15,5580 5,6680 0,4337*** 0,544*** -0,0572*** -0,1023*** 0,3056*** 0,1808*** 0,0952*** 0,1124*** 1
The dependent variable is the LnROE meaning ln (Return on Equity) while ln (Assets) is a control/size independent variable. LnL1ROE is the ln of the lagged value of ROE which is also an independent variable.
The remaining independent variables are the Current ratio (lncRatio), Assets to Equity (ln ATE), Net Profit Margin (LnNetProfit), Asset turnover (LnAssetTurnover), Debt to Equity (ln DtoEquity) and the Standard deviation of Return on Equity (lnRoeRisk).
The lnROE , lnl1ROE and lnNetProfit are profitability ratios and lncRatio is a liquidity ratio. The lnATE and lnDtoEquity are variables which describe the capital structure and financial leverage of a firm. The lnAssetTurnover is a ratio which describes the efficiency of a company. The lnAssets is a control variable
18
4.2 Regressions Results
The two models (8) and (9) are estimated using the OLS, and FE. The VIF test was also performed and shows that the variables do not have any multicolinearity problems.
Table IV shows the Hausman Test (1978) for the two regressions. The results shows that H0 hypothesis is rejected for the two regressions, which means that the most
appropriate model is FE and not RE.
Table IV – Hausman Test
Dependent Variables
Prob > χ2 Χ2
LnROE(7) 0,0000*** 136,9700
LnROE(8) 0,0000*** 502,1300
*, **, *** represents the statistical significance of 10%, 5% and 1% respectively
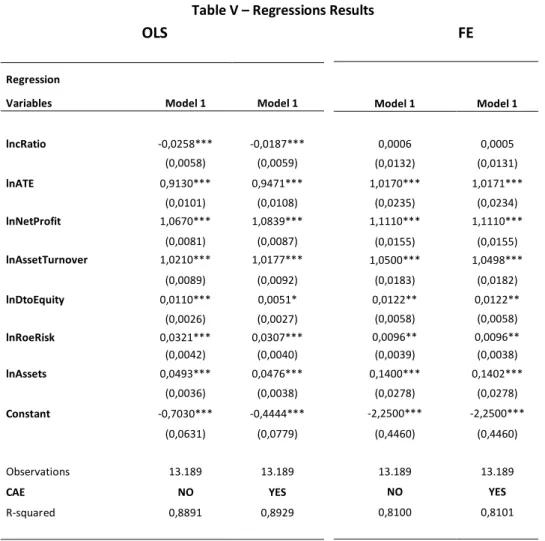
Table V and VI shows the regression results for both models. Table V analyses the regression results without the lagged value of ROE whereas table VI analyses the results with the lagged value of ROE incorporated in the model. Each of the regressions shows one column without CAE and the other column with CAE.
Concerning Table VI , the main difference is how the independent variable ln ROE(t-1)
affects the dependent variable in the FE regression and whether it improves the R2. Regarding the R2, there is a small increase concerning regression in table V, and all variables are statistically significant at 1% with the exception of the ln Current Ratio (non-significant) and the ln Debt to Equity (only significant at 10%). Therefore the
19
following hypothesis analysis will be analyzed according to the FE regression in Table VI.
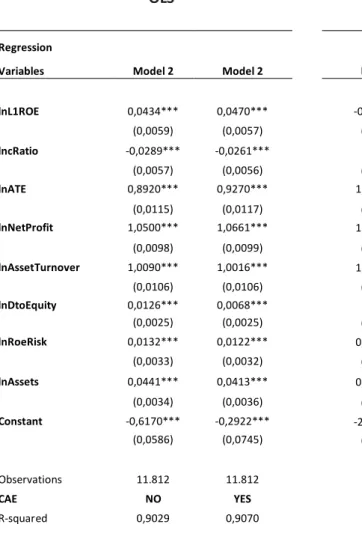
The results in table VI for the regression with the lagged value of ROE, shows that the ln Debt to Equity is positively significant at 10%, while all remaining variables are all positively significant at 1 %, which means that are able to explain the variation on ln ROE. The ln Debt to Equity has a positive coefficient, which means that an increase of this ratio will positively influence ln ROE variation. The previous result suggests that the capital structure of a firm has a strong influence on ROE, and the more debt the firm uses when comparing to equity, the higher will be ROE. Hence, hypothesis H1 is rejected.
The ln Current Ratio (liquidity ratio) is not statistically significant regarding regression in table VI with and without CAE. This result is inconsistent with the results obtained by Boyd et al. (2007) who concludes that Current Ratio is negatively significant. Therefore no interpretation of the ln Current Ratio can be made. Therefore, there is no support for hypothesis H2.
The ln Net Profit Margin (profitability ratio) and ln Asset Turnover (efficiency ratio) have both positive and significant coefficients confirming H3 and H4. The same conclusion, regarding the ln Net Profit Margin and ln Asset Turnover coefficient, is analyzed in Boyd et al. (2007) and Pouraghaian(2012). An increase in the Net profit Margin, means a reduction in the company´s costs and an increase in its net income (which is the numerator of the ROE formula) which will, for that reason, positively influence the final ROE. The positive value for the ln Asset Turnover coefficient is also
20
achieved in Amos et al. (2014) and means that an increase in the efficiency of company´s operations, also influences net income and leads to an improvement of the firm´s profitability (ROE).
The variables ln Asset to Equity and ln Roe Risk have both a positive and significant coefficients with the dependent variable ln ROE. This interpretation means that greater risk leads to higher ROE. While the capital structure of a firm, more precisely the proportion of Assets to Equity, explains that a higher value for this ratio means an increase in the firms leverage which leads to the positive association with ROE. Thus confirming H5 and H7.
The ln SIZE has a positive and significant coefficient, similar to the study of Anbar & Alper (2011). This result indicates that an increase in the total size of the company (Assets) generates higher profitability. Most similar results were achieved regarding the variables in the column without CAE.
Analyzing the ln ROE(t-1), there is evidence of a negative influence on the dependent
variable, which in turn rejects H6. This negative influence does not show that if past ROE is high, ROE will also be high in the following period.
Concerning the main difference between the OLS and FE of model 2 in Table VI is the respective ln ROE (t-1). Its coefficient in the OLS is positive and significant; leading to the
same conclusion as of Boyd et al. (2007), which states that past variation of the company´s profitability will positively influence ROE.
21
Table V – Regressions Results
OLS FE
Regression
Variables Model 1 Model 1
lncRatio -0,0258*** -0,0187*** (0,0058) (0,0059) lnATE 0,9130*** 0,9471*** (0,0101) (0,0108) lnNetProfit 1,0670*** 1,0839*** (0,0081) (0,0087) lnAssetTurnover 1,0210*** 1,0177*** (0,0089) (0,0092) lnDtoEquity 0,0110*** 0,0051* (0,0026) (0,0027) lnRoeRisk 0,0321*** 0,0307*** (0,0042) (0,0040) lnAssets 0,0493*** 0,0476*** (0,0036) (0,0038) Constant -0,7030*** -0,4444*** (0,0631) (0,0779) Observations 13.189 13.189 CAE NO YES R-squared 0,8891 0,8929 Model 1 Model 1 0,0006 0,0005 (0,0132) (0,0131) 1,0170*** 1,0171*** (0,0235) (0,0234) 1,1110*** 1,1110*** (0,0155) (0,0155) 1,0500*** 1,0498*** (0,0183) (0,0182) 0,0122** 0,0122** (0,0058) (0,0058) 0,0096** 0,0096** (0,0039) (0,0038) 0,1400*** 0,1402*** (0,0278) (0,0278) -2,2500*** -2,2500*** (0,4460) (0,4460) 13.189 13.189 NO YES 0,8100 0,8101
Note: Robust standard errors in parentheses.
*, **, *** represents the statistical significance of 10%, 5% and 1% respectively Ln ROE is the dependent variable of both models
22
Table VI – Regression Results
OLS FE
Regression
Variables Model 2 Model 2
lnL1ROE 0,0434*** 0,0470*** (0,0059) (0,0057) lncRatio -0,0289*** -0,0261*** (0,0057) (0,0056) lnATE 0,8920*** 0,9270*** (0,0115) (0,0117) lnNetProfit 1,0500*** 1,0661*** (0,0098) (0,0099) lnAssetTurnover 1,0090*** 1,0016*** (0,0106) (0,0106) lnDtoEquity 0,0126*** 0,0068*** (0,0025) (0,0025) lnRoeRisk 0,0132*** 0,0122*** (0,0033) (0,0032) lnAssets 0,0441*** 0,0413*** (0,0034) (0,0036) Constant -0,6170*** -0,2922*** (0,0586) (0,0745) Observations 11.812 11.812 CAE NO YES R-squared 0,9029 0,9070 Model 2 Model 2 -0,0261*** -0,0261*** (0,0047) (0,0047) -0,0132 -0,0132 (0,0152) (0,0152) 1,0300*** 1,0300*** (0,0217) (0,0217) 1,1340*** 1,1340*** (0,0061) (0,0061) 1,0840*** 1,0840*** (0,0173) (0,0173) 0,0108* 0,0108* (0,0064) (0,0064) 0,0120*** 0,0120*** (0,0033) (0,0033) 0,1350*** 0,1350*** (0,0220) (0,0220) -2,1460*** -2,1460*** (0,3522) (0,3522) 11.812 11.812 NO YES 0,9039 0,9039
Note: Robust standard errors in parentheses.
*, **, *** represents the statistical significance of 10%, 5% and 1% respectively Ln ROE is the dependent variable of both models
23
In respect to regression in table V, the OLS model presents similar results for FE. Nonetheless, the main difference is that in the OLS, the ln Current Ratio coefficient is negative and statistically significant, regarding which Saleem & Rehman (2011) also assumed the same conclusion. This result means that with the increase of the Current Ratio, there will be less debt financing the company´s assets. The respective effect leads to an increase in the owners’ equity in order to finance its own assets which lead to a reduction in its ROE.
4.3. Financial vs Non-Financial
The previous regressions take all sectors of activity into consideration. In this section, the sample is divided between financial and non-financial. Financial institutions are usually large, complex and more likely to provoke systematic instability (Wyman, 2015). In order to make this distinction, a separation was made between financial observations and other observations based on the financial sector CAE and using the regression of model 2. For that purpose, and according to Instituto Nacional De
Estatistica, INE (2007) the CAE that refers to the financial sectors are the 64, 65 and 66
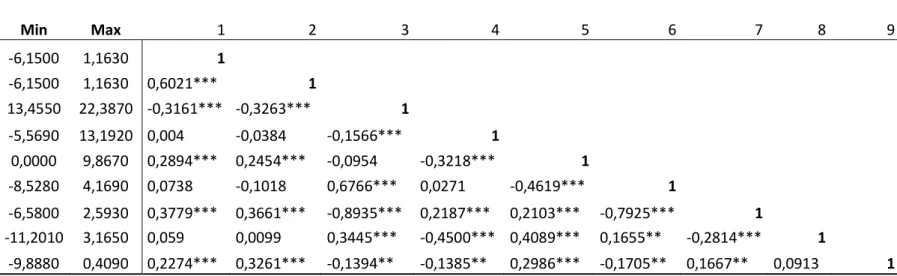
with 283 observations. Table I shows that, companies from sector 64, 65 and 66 CAE constitute 1,36% of the total sample (64 companies). The descriptive statistics of the financial sector companies are in Table VII. The correlation between the dependent and independent variables of the financial sectors, i.e the ln Current Ratio, Ln Net Profit Margin and ln Debt to Equity, with ln ROE are not statistically significant.
24
Table VII – Descriptive Statistics and Correlation Variable Matrix of Financial sector
Note: This table shows the Descriptive statistics and the Pearson correlations of the financial sector. Independent Variables are ln transformed for the financial sector
LnROE remains the dependent variable Total sample of 283 observations
The *, **, *** represents the statistical significance of 10%, 5% and 1% respectively
Mean S.D. Min Max 1 2 3 4 5 6 7 8 9
1.lnROE -1,8710 1,2160 -6,1500 1,1630 1 2.lnL1ROE -1,7360 1,1310 -6,1500 1,1630 0,6021*** 1 3.lnAssets 17,5150 2,0830 13,4550 22,3870 -0,3161*** -0,3263*** 1 4.lncRatio 0,4940 1,6390 -5,5690 13,1920 0,004 -0,0384 -0,1566*** 1 5.lnATE 0,8720 0,9240 0,0000 9,8670 0,2894*** 0,2454*** -0,0954 -0,3218*** 1 6.lnNetProfit -0,4910 2,0380 -8,5280 4,1690 0,0738 -0,1018 0,6766*** 0,0271 -0,4619*** 1 7.lnAssetTurnover -2,0130 2,0840 -6,5800 2,5930 0,3779*** 0,3661*** -0,8935*** 0,2187*** 0,2103*** -0,7925*** 1 8.lnDtoEquity -1,2590 2,2370 -11,2010 3,1650 0,059 0,0099 0,3445*** -0,4500*** 0,4089*** 0,1655** -0,2814*** 1 9.lnRoeRisk -3,5580 1,3740 -9,8880 0,4090 0,2274*** 0,3261*** -0,1394** -0,1385** 0,2986*** -0,1705** 0,1667** 0,0913 1
25
All remaining independent variables such as the ln ROE Risk, ln ROE [t-1], ln Asset Turnover and ln ATE are positively significant with the dependent variable where the ln ROE [t-1] appears to have the strongest correlation with ln ROE.
Table VIII presents the mean of the ROE financial companies between 2009 and 2013. Analyzing table VIII, the ROE financial mean shows a decrease over time. A reason for such decrease is the capital constraints of the new Basileia III tier 1 act that came into force in 2011, in order enforce capital control on banks (Radulescu, 2014). The banks faced pressure on their ROE due to an increase in capital and liquidity costs such as increasing reserves and maintaining a minimum level of capital in their balance sheet (Jayadev, 2013). The new capital, liquidity regulations and interest rates policies enforced by Basel III tier 1 act is working against financial firms, and pressuring their managers to improve operational efficiency and increase ROE (Wyman, 2015).
Table VIII – ROE financial mean variation
Variable 2009 2010 2011 2012 2013
ROE financial sector mean 0,3258 0,2993 0,2906 0,2838 0,2564
4.3.1. T-test
Table IX shows the mean and the t-test In order to test for the difference in means regarding financial vs non-financial. The null hypothesis is the equality of means between the groups.
26
The results indicate a difference in the mean of the financial and non-financial companies for all the variables. The null hypothesis of the mean variables being equal is therefore rejected.
Table IX –T-Test for the means between Financial vs Non-Financial
Variables Financial Non-Financial Pr(|T| > |t|)
LnROE -1,8710 -2,6490 0,0000*** lnDtoEquity -1,2590 -0,5161 0,0000*** lncRatio 0,4940 0,3900 0,0237** lnAssetTurnover -2,0130 -0,0499 0,0000*** lnNetProfit -0,4940 -3,3756 0,0000*** lnATE 0,8720 1,1506 0,0000*** lnRoeRisk -3,5580 -3,9546 0,0005*** lnL1ROE -1,7360 -2,5387 0,0000*** lnAssets 15,5150 16,0440 0,0000*** Note:
*, **, *** represents the statistical significance of 10%, 5% and 1% respectively H0: Equality of means between financial and non-financial firms.
4.3.2. Financial vs Non-Financial Regressions
Table X presents the regression results using the OLS and FE for the Financial against the Non-financial observations. The regression with the lnROE(t-1) variable (model 2)
was used for the financial vs non-financial analysis, as it is the most complete model, because it presented the highest R2 and includes all of the original hypothesis.
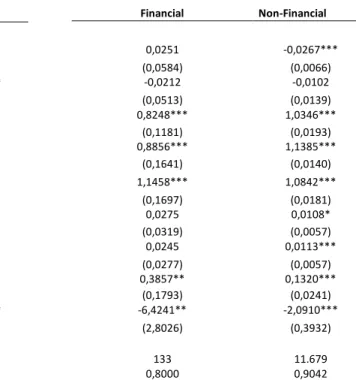
The result according to FE shows that not all variables are statistically significant. Those, which have a direct influence on ln ROE are: Variable ln Assets; ln Asset to Equity; Ln Net Profit Margin and ln Asset Turnover.
27
ln Asset to Equity shows a positive and significant association at 1%, but it has a lower impact on ROE, when compared with the non-financial sectors. The ln Net Profit Margin coefficient of the financial sector is positive but it has also a lower impact on ROE when compared with the non-financial sector. This association concerning the Net Profit Margin means that as the earnings before taxes increase over the total sales, the profitability (ROE) will increase more slowly in the financial sector.
The Ln Asset Turnover shows a positive and significant association on the financial sector ROE. This association means that with an increase of the Asset Turnover, comes an increase in the companies’ operation efficiency, which in turn leads to a positive influence on ROE. The corresponding association implies that cost control policies have a strong impact on the financial firm’s profitability.
Ln Assets is positively significant at 5%. When comparing the effects between the financial and the remaining sectors, ln Assets has a stronger influence on ROE in the financial sector regression. This means that the size of a company in the financial sector influences ROE to a greater extent than in the non-financial sectors. This means that SIZE of a financial sector firm is more crucial to its profitability (Duca,2012).
The main conclusion drawn from this test was that variables concerning profitability, solvency, liquidity and efficiency explain ROE variation in the financial sector to a lesser extent. However, when all remaining sectors are included they achieve a higher R2 and more statistically significant variables.
28
Table X – Financial vs Non-Financial Regression
OLS FE
Robust standard in parentheses
The lnROE remains the dependent variable.
The lnAssetTurnover was removed due to multicolinearity problems after the vif test was performed in the OLS financial regression. *, **, *** represents the statistical significance of 10%, 5% and 1% respectively
Financial Non-Financial 0,0251 -0,0267*** (0,0584) (0,0066) -0,0212 -0,0102 (0,0513) (0,0139) 0,8248*** 1,0346*** (0,1181) (0,0193) 0,8856*** 1,1385*** (0,1641) (0,0140) 1,1458*** 1,0842*** (0,1697) (0,0181) 0,0275 0,0108* (0,0319) (0,0057) 0,0245 0,0113*** (0,0277) (0,0057) 0,3857** 0,1320*** (0,1793) (0,0241) -6,4241** -2,0910*** (2,8026) (0,3932) 133 11.679 0,8000 0,9042 Regression Variables Financial Non-Financial lnL1ROE 0,2472*** 0,0424*** (0,0892) (0,0058) lncRatio 0,2202*** -0,0278*** (0,0604) (0,0057) lnATE 0,8975*** 0,8943*** (0,1190) (0,0115) lnNetProfit 0,5202*** 1,0534*** (0,0650) (0,0096) lnAssetTurnover 1,0109*** (0,0104) lnDtoEquity 0,0059 0,0124*** (0,0389) (0,0026) lnRoeRisk 0,0149 0,0118*** (0,0510) (0,0032) lnAssets -0,4249*** 0,0437*** (0,0500) (0,0033) Constant 5,4448*** -0,2844*** (0,8343) (0,0750) Observations 133 11.679 R-squared 0,6509 0,9029
29
6. Conclusions
6.1. Final Conclusions
The objective of this study was to analyze how the different determinants that describe profitability, efficiency, solvency and liquidity affected the ROE of the 5000 largest Portuguese Public Limited Companies during the period between 2009 and 2013. Separate observations were also made with regard to the financial sector, in order to analyze how the said determinants influenced the specific ROE of that sector.
When all observations are considered, some of the determinants did not produce the results expected. Solvency ratio ln Debt to Equity showed a positive statistically significant association that is contrary to that recorded in the Literature Review. It is concluded that the higher the ln Debt to Equity is, the higher will be the Portuguese companies’ ROE. This suggests that by increasing debt levels in the capital structure, managers are forced to invest in profitable projects that benefit shareholders and mitigate possible agency conflicts while also increasing ROE (Harvey et al., 2000). Debt commits managers to pay out funds on a regular basis and help cut back overinvestment which managers might pursue merely for personal reward (Harvey et al., 2000). There is also a positive association between ln Debt to Equity and ln ROE with regard to the financial sector, but it is not statistically significant.
A more complete regression model was established by adding lagged value ROE. Lagged ROE was negatively statistically significant being such association contrary to
30
what results from the Literature Review. Therefore, a higher value for past ROE does not necessary suggest that future ROE will also be high. Good levels of past profitability will not guarantee that Portuguese companies will achieve better results in the future. Lagged ROE for the financial sector has a positive association with ln ROE but it was not significant. So far as the impact of the liquidity ratio is concerned, ln Current Ratio was not statistically significant with regarding to either the general and financial sectors.
The solvency ratio ln Asset to Equity is statistically significant with a positive association with the general and financial sector ln ROE. This association suggests that an increase in the proportion between Assets and Equity will lead to an increase in the debt levels, suggesting that companies are using debt, rather than equity, to finance its assets. This increase will positively influence ROE. By increasing the debt levels instead of raising equity, companies will avoid diluting the percentage ownership of current shareholders. Also, if ROE is equal to the Net Income over Owner Equity and raising the denominator (equity), will directly make ROE decrease.
As profitability ratios, the statistically significant positive association, in both sectors, with ln Net Profit Margin and ln ROE means that with an increase in the sales profitability (Net Profit Margin), the Net Income immediately increases, which leads to a direct association with the positive variation of ROE. The efficiency ratio ln Asset Turnover also shows a statistically significant and positive association, in both sectors, with ln ROE. The associations regarding the ln Net Profit Margin and ln Asset Turnover
31
with ln ROE imply that reducing unnecessary costs and increasing operational efficiency will positively affect the ROE of Portuguese companies.
6.2. Limitations
A significant limitation that affects this dissertation concerns the 2009-2013 period used for this analysis. The data calculated and the corresponding interpretations are influenced by the European debt crisis that commenced in the early 2009 and continues until the present day. These findings therefore only reflect the unusual financial context of that period. Another limitation concerns the small sample used in this dissertation, because Informa D & B only agrees to deliver a limited amount of data. A larger sample should be considered.
6.3. Suggestions for further researches
It is suggested that future researches regarding the impact of the different financial ratios on ROE, should make more distinctions between additional sectors of activity. It would be relevant to analyze how the determinants selected affect the ROE in each sector, in order to assess which are the most important financial ratios for each sector of activity. Moreover, such studies should be conducted in a normal European debt environment, in order to understand the extent to which the reference period covered by this dissertation influenced its results. It would also be interesting to include macroeconomic variables such as the real GDP growth rate, in order to analyze
32
whether the variation of Portuguese GDP affects the profitability of Portuguese companies.
7. References
Acheampong, Y. J. (2000). International Variation in Return on Equity in the Food and Beverage Industries. Journal of Agricultural and Applied Economics,32(2), 383-392.
Altman, E. I. (1968). Financial ratios, discriminant analysis and the prediction of corporate bankruptcy. The journal of finance, 23(4), 589-609.
Amel, D., Barnes, C., Panetta, F., & Salleo, C. (2004). Consolidation and efficiency in the financial sector: A review of the international evidence. Journal of Banking & Finance,
28(10), 2493-251
Anbar, A., & Alper, D. (2011). Bank specific and macroeconomic determinants of commercial bank profitability: empirical evidence from Turkey. Business and
Economics Research Journal, 2(2), 139-152.
Arzac, E. R. (1986). Do your business units create shareholder value? Harvard Business
33
Association of British Insurers. (2013) Encouraging Equity Investment. Facilitation of
efficient equity capital raising in the UK market, Available from: https://www.ivis.co.uk/media/5926/ABI-Encouraging-Equity-Investment-report-July-2013.pdf
Berk, J., DeMarzo, P., Harford, J., Ford, G., Mollica, V., & Finch, N. (2014).Fundamentals
of corporate finance, 3rd Ed. New York: Pearson Education
Berman, K., Knight, J., Case, J. (2013). Financial Intelligence. A Manager’s Guide to Knowing What the Numbers Really Mean, Revised Edition. Woodland Hills: Business Literacy Institute, Inc.
Boldeanu, D. M., & Pugna, I. B. (2014). The analysis of the influence factors affecting the performance of pharmaceutical companies. Theoretical and Applied Economics,
18(7 (596)), 23-42.
Bolek, M. (2013). Dynamic and static liquidity measures in working capital strategies.
European Scientific Journal, 9(4).
Bolek, M., & Wili'nski, W. (2012). The influence of liquidity on profitability of Polish construction sector companies. e-Finanse: Financial Internet Quarterly,8(1), 38-52.
34
Boyd, S., Boland, M., Dhuyvetter, K., & Barton, D. (2007). Determinants of return on equity in US local farm supply and grain marketing cooperatives. Journal of Agricultural
and Applied Economics, 39(1), 201-210.
Cho, D. (1999). The Impact Of A Price Cut On Net Income And Profit Margin. Journal of
Financial and Strategic Decisions, 12(2), 83-94.
Cîrciumaru, L. D., Siminica, M., & Marcu, N. (2010). A study of the Return on Equity for the Romanian industrial companies. Annals of University of Craiova–Economic Science
Series, 2, 38.
Damodaran, A. (2007). Return on capital (ROC), return on invested capital (ROIC) and
return on equity (ROE): Measurement and implications, Available from:
http://ssrn.com/abstract=1105499
Dauda Ibrahim Adagye. (2015) Effective working capital management and the profitability of quoted banks in Nigeria. European Journal of Accounting Auditing and
Finance Research Vol.3, No.2, 97-107
Delen, D., Kuzey, C., & Uyar, A. (2013). Measuring firm performance using financial ratios: A decision tree approach. Expert Systems with Applications, 40(10), 3970-3983.
35
Demerjian, P. R. (2007). Financial ratios and credit risk: The selection of financial ratio covenants in debt contracts, Available from: http://ssrn.com/abstract=929907
Dietrich, A., & Wanzenried, G. (2009). What determines the profitability of commercial
banks? New evidence from Switzerland, Available from:
http://ssrn.com/abstract=1370245
Domeika, P. (2008). Creation of the Information system of enterprise fixed asset accounting. Inzinerine Ekonomika-Engineering Economics, 5, 7-15.
Domingos, H. M. (2010). Private Equity Transactions in Portugal. Policy Paper 10/03,
April 2010, Contraditório, 2-24
Esplin, A., Hewitt, M., Plumlee, M., & Yohn, T. (2010). Disaggregating operating and financing activities versus disaggregating unusual and/or infrequent income items: implications for forecasts of future profitability. Indiana University, United States of America (Working paper).
Gadoiu, M. (2014). Advantages and Limitations of the Financial Ratios Used In The Financial Diagnosis Of The Enterprise. Scientific Bulletin-Economic Sciences, 13(2), 87-95.
Gallo, M. A., & Vilaseca, A. (1996). Finance in family business. Family Business Review,
36
Gibson, C. (1982). Financial ratios in annual reports. The CPA Journal, 52(9), 18-29.
Goddard, J., Molyneux, P., & Wilson, J. O. (2004). The profitability of European banks: a cross‐sectional and dynamic panel analysis. The Manchester School, 72(3), 363-381.
Guimaraes, A., & Nossa, V. (2010). Working capital, profitability, liquidity and solvency of healthcare insurance companies. BBR-Brazilian Business Review,7(2), 37-59.
Harvey, C. R., Lins, K. V., & Roper, A. H. (2000). The Effects of Capital Structure on Extreme Agency Problems. Duke University, United States of America (Working paper).
Hausman, J.A. (1978). Specification Tests in Econometrics. Econometrica, 46 (6), 1251– 1271.
Herciu, M., Ogrean, C., & Belascu, L. (2011). A Du Pont Analysis of the 20 Most Profitable Companies in the World. International Conference on Business and
Economics Research, 1 (1.58), 45-48.
Hine, S., & Thilmany, D. D. (1998). Financial Ratios: What They Say about Your Business. Colorado State University, Department of Agricultural and Resource Economics (Working paper).
37
INE, (2007) Classificação Portuguesa das Actividades Económicas. Lisboa: INE. Retrieved from https://www.ine.pt/ine_novidades/semin/cae/CAE_REV_3.pdf
Jacobs, B. I., & Levy, K. N. (1993). Long/short equity investing. The Journal of Portfolio
Management, 20(1), 52-63.
Jansen, I. P., Ramnath, S., & Yohn, T. L. (2012). A Diagnostic for Earnings Management Using Changes in Asset Turnover and Profit Margin. Contemporary Accounting
Research, 29(1), 221-251.
Jayadev, M. (2013). Basel III implementation: Issues and challenges for Indian banks.
IIMB Management Review, 25(2), 115-130.
Joos, P., & Joos, P. (1998). The prediction of ROE: fundamental signals, accounting recognition, and industry characteristics. INSEAD France (Working paper).
Lesáková, Ľ. (2007). Uses and limitations of profitability ratio analysis in managerial practice. In International Conference on Management, Enterprise and Benchmarking 259-264.
Liargovas, P., & Skandalis, K. (2010). Factors Affecting Firm Competitiveness: The Case of Greek Industry. European institute Journal, 2(2), 184-197.
38
Liesz, T.J. (2002), Really modified DuPont analysis: five ways to improve return on equity. The Economics review, Vol. 81, (3), 231-243.
Loi, T. H., & Khan, A. A (2012). Determinants of firm growth: evidence from Belgian companies. University of Gent, Belgium (Working paper).
Lussier, R. N. (1996). Reasons why small businesses fail: and how to avoid failure. The Entrepreneurial Executive, 1(2), 10-17.
Mohamad, N. E. A. B., & Saad, N. B. M. (2010). Working capital management: The effect of market valuation and profitability in Malaysia. International Journal of
Business and Management, 5(11), 140.
Mohammed, A. A. E., & Kim-Soon, N. (2012). Using Altman’s model and current ratio to assess the financial status of companies quoted in the Malaysian stock exchange.
International Journal of Scientific and Research Publications, 2(7), 1-11.
Moyer, R. C., McGuigan, J., Rao, R., & Kretlow, W. (2011). Contemporary financial management, 12th Ed. Cengage Learning.
Moussu, C. and A. Petit-Romec, (2014). RoE in Banks: Myth and Reality, Available from: http://ssrn.com/abstract=2374068.
39
Mwangi, L. W., Makau, M. S., & Kosimbei, G. (2014). Relationship between Capital Structure and Performance of Non-Financial Companies Listed In the Nairobi Securities Exchange, Kenya. Global Journal of Contemporary Research in Accounting, Auditing
and Business Ethics, 1(2), 72-90.
Nissim, D., & Penman, S.H. (2001). Ratio analysis and equity valuation: from research to practice. Review of Accounting Studies, 6, 109-154.
Pagratis, S., Karakatsani, E., & Louri, H. (2014). Bank leverage and return on equity targeting: intrinsic procyclicality of short-term choices. Bank of Greece, Greece (Working Paper No 189).
Pellika, J. R. K. (2009). Comparing lodging REITs using DuPont analysis: Evaluating
shareholder equity, Available from:
http://digitalscholarship.unlv.edu/thesesdissertations.
Phan, K. C. (2013) Factors Affecting Profitability (Case of Consumer Products Companies of Thailand). International Conference on Innovations in Engineering and Technology, 163
Popov, A. A., & Roosenboom, P. (2009). Does private equity investment spur innovation? Evidence from Europe. European Central Bank (Working Paper No 1063)
40
Pouraghajan, A., Malekian, E., Emamgholipour, M., Lotfollahpour, V., & Bagheri, M. M. (2012). The relationship between capital structure and firm performance evaluation measures: Evidence from the Tehran Stock Exchange. International journal of Business
and Commerce, 1(9), 166-181.
Prowse, S. D. (1998). The economics of the private equity market. Economic
Review-Federal Reserve Bank of Dallas, 21-34.
Radulescu, M. (2014). The Impact Of The Basel Iii Agreement On The Banking Systems.
Scientific Bulletin – Economic Sciences, Vol 13(1),3-10.
Ross, S. A. (2008).Modern financial management, 1st Ed. New York: McGraw-Hill.
Saleem, Q., & Rehman, R. U. (2011). Impact of Liquidity Ratios on Profitability.
Interdisciplinary Journal of Research in Business, 1(7), 95-98.
Schönbohm, A. (2013). Performance measurement and management with financial ratios: the BASF SE case. Institute of Management Berlin, Germany (Working Paper, No 72)
Soliman, M. T. (2008). The use of DuPont analysis by market participants. The
41
Tafri, F. H., Hamid, Z., Meera, A. K., & Omar, M. A. (2009). The impact of financial risks on profitability of Malaysian commercial banks: 1996-2005. International Journal of
Social and Human Sciences, 3(3), 807-821.
Tugas, F. C., & CISA, C. (2012). A Comparative analysis of the Financial ratios of Listed Firms belonging to the Education Subsectors in The Philippines for the Year 2009-2011.
International Journal of Business and Social Sciences,3(21), 173-190.
Trivedi, S. M. (2010). An analysis of financial performance of state road transport corporation in Gujarat. Saurashtra University, India (Working paper).
Vintila, G., & Floriniţa, D. U. C. A. (2012). The Impact of Financial Leverage to Profitability Study of Companies Listed in Bucharest Stock Exchange. Economic Science
Series, 1741-1744.
Witmer, J., & Zorn, L. (2007). Estimating and comparing the implied cost of equity for Canadian and US firms. Bank of Canada, Canada (Working Paper, No 48).
Yusuf, B., Onafalujo, A., Idowu, K., & Soyebo, Y. (2014, June). Capital Structure and Profitability of Quoted Firms: The Nigerian Perspective (2000-2011). International
Institute of Social and Economic Sciences, 922-942.
Zager, K., & Zager, L. (2006). The Role of financial information in decision making Process. Special Edition on Consumer satisfaction,—Global Perspective, 35-40.
42 7.1 Annex
Annex I – Descriptive Statistics with non-ln transformation variables
Mean S.D. Min Max 1 2 3 4 5 6 7 8 9
1.ROE 0,1810 0,0102 0,0000 179,4280 1 2.l1ROE 0,2162 0,0136 0,0000 159,8150 0,0091 1 5.Assets† 5.380,0000 3584 0,0100 2.100.000,0000 -0,0004 0,0003 1 4.ATE 7,3070 1,1139 1,000 19.277,7050 0,0719*** -0,0050 0,0055 1 5.NetProfitMargin 0,2270 0,0128 0,0000 925,6930 0,0077 0,0086 0,0244*** -0,0007 1 6.AssetTurnover 1,3420 0,01274 0,0000 60,2240 0,0229*** 0,0131 -0,0564*** -0,0081 -0,0215*** 1 7.cRatio 55,2900 37,6613 -4,3010 535.913,0000 -0,0011 -0,0001 -0,0010 -0,0004 0,0036 -0,0090 1 8.DtoEquity 2,5050 0,2168 0,0000 5.441,1060 0,0812*** -0,0229*** 0,0032 0,3912*** -0,0007 -0,0209*** -0,0006 1 9.ROERisk 0,0979 0,0085 0,0000 289,3260 0,2888*** -0,7904*** -0,0011 0,0231*** 0,0056 0,0013 -0,0003 0,0688*** 1
Note: Descriptive Statistics of the variables before having the ln transformation. Some variables present a large scale problem as with the value of the assets.
The analysis will give the same final interpretations and conclusions as with the ln transformed variables. *** p<0,01; ** p<0,05; * p<0,10.