M
ASTER OF
S
CIENCE IN
FINANCE
M
ASTERS
F
INAL
W
ORK
PROJECT
EQUITY RESEARCH
:
S
POTIFY
T
OMÁS
S
OUSA
G
UEDES
S
UPERVISOR
:
P
ROFESSOR
P
EDRO
R
INO
V
IEIRA
Abstract
The present Master Final Work is an Equity Research of Spotify Technology.
The choice for Spotify has three key reasons. First, Spotify is changing the way music is consumed by providing accessibility to all music in the world instead of ownership of CD’s or files. Second, applies new technologies to the music market, using machine learning and analytics to understand music and consumers. Third, I am a loyal customer and a music fan who uses Spotify every single day.
An equity research report consists in forecast a stock’s price target for the year end of 2020, and comparing it with the current price in order to conclude if the stock is over valuated or undervalued.
To provide a price target for Spotify, we started to analyse the business model and the company’s strategy and to identify its key drivers of profitability. Additionally, is key to study the macroeconomic framework and the industry where the company acts in order to evaluate its competitive positioning.
Based on the analysis performed and the data gathered, the following step is to determine the assumptions to forecast the company’s accounts for the next 6 years. Once the forecasts are performed, we applied two valuations models in order to obtain the price target: the Discounted Cash Flow method (DCF) and the Subscription Based Companies (SBC) valuation model.
The price target obtained by the DCF was USD178.52, with an upside potential of 34.2%, and USD174.43 for the SBC model, with an upside potential of 31.2%.
Finally, a risk assessment was performed in order to identify the main risks that impact the valuation and the company’s business.
Resumo
Este Trabalho final de Mestrado trata-se de uma Equity Research sobre a empresa Spotify Technology.
A escolha do Spotify prende-se com três razões principais. Primeira, o Spotify está a alterar a forma como a música é consumida, mudando de o paradigma de consume de posse da música, em CD’s ou ficheiros, para acesso a toda a música do mundo. Segundo, é uma empresa que usa as novas tecnologias, como machine learchine e analítica avançada, para compreender quer os consumidores quer a música propriamente dita. E terceiro, sou um cliente fiel e um grande fã de música, que utiliza o Spotify todos os dias.
Uma Equity Reasearch consiste em determinar o preço alvo da ação de uma empresa no final de 2020 e, comparando com o preço atual, determinar se o seu valor está sobreavaliado ou subavaliado. Desta forma, é possível fazer uma recomendação aos investidores relativamente à compra ou venda da ação.
Para calcular o preço alvo do Spotify, iniciámos o relatório com uma análise do modelo de negócio e das estratégias da empresa, de forma a determinar as principais fontes de valor do negócio. Além disso, é fundamental efetuar uma análise macroeconómica e da indústria onde a empresa tem atividade, com vista a avaliar o seu posicionamento competitivo.
Com base nas análises enumeradas e nos dados recolhidos, o passo seguinte foi determinar os pressupostos para efetuar a previsão das contas da empresa para os próximos 6 anos. Após as previsões, aplicamos dois modelos de avaliação de empresas com o objetivo de obter o preço alvo: o modelo Discounted Cash Flow (DCF) e o modelo Subscription Based Companies (SBC). O preço alvo obtido pelo primeiro modelo foi 178,52USD com um potencial de crescimento de 34,2%, enquanto que o segundo modelo obteve um preço alvo de 174,43USD com um potencial de crescimento de 31,2%.
Por fim, foi efetuada uma avaliação de risco de forma a identificar os principais riscos que poderão impactar o preço calculado.
Key words
Music streaming Monthly active users Average revenue per user Churn rate Subscription based companies Wright holders
Index
Abstract ... 2 Resumo ... 3 Key words ... 4 List of figures ... 6 01. Research Snapshot ... 7 02. Business Description ... 803. Management and Corporate Governance ... 13
04. Industry Overview and Competitive Positioning ... 14
05. Investment Summary ... 18
06. Valuation ... 19
07. Financial Analysis... 26
08. Investment Risks ... 28
09. Appendices ... 31
Appendix 1 – World population by region ... 31
Appendix 2 – Music listeners by region ... 31
Appendix 3 – Smartphone adoption by region ... 31
Appendix 4 – Audio streaming adoption by region ... 31
Appendix 5 – Audio streaming addressable market ... 31
Appendix 6 – Spotify MAUs estimation by region ... 32
Appendix 7 – Premium segment ... 32
Appendix 8 – Ad-supported segment ... 32
Appendix 9 – Income Statement ... 32
Appendix 10 – Balance sheet ... 33
Appendix 11 – Cash flow statement ... 34
Appendix 12 – Assumptions detail ... 35
Appendix 13 – Ratio analysis ... 36
Appendix 14 – How Spotify licenses and pays for music rights ... 36
Appendix 15 – Spotify footprint worldwide ... 36
References ... 37
Disclosures and Disclaimer ... 38
List of figures
Fig. 1: Spotify share price evolution (source: Bloomberg) 8
Fig 2: EBIT in EURmn (source: Spotify and author) 8
Fig 3: Weight on revenues per segment (source: Spotify) 9
Fig 4: Weight on MAUs per segment (source: Spotify) 9
Fig 5: Premium subscribers by region in 2018 (source: Spotify) 10
Fig 6: MAUs by region in 2018 (source: Spotify) 10
Fig 7: ARPU in €/month (source: Spotify) 10
Fig 8: Churn rate and premium subscribers (source Spotify) 10
Fig 9: R&D and S&M 11
Fig. 10: Spotify business model 11
Figure 11: Spotify partnerships (Source: Spotify and Author) 12
Fig 12: Shareholder strucutre (source: Markets Insider) 13
Fig. 13: GDP growth rate (source: IMF) 15
Fig 14: Exchange rate impact on revenue growth rate yoy (source: Spotify) 15
Fig. 15: Inflation rate projection (source: Statista) 15
Fig. 16: Global music revenues in USDbn (source IFPI) 15
Fig. 17: % of consumers that accessed unlicensing music (source: IFPI) 16 Fig. 18: Subscribers Market Share Worldwide 2018S1 (source: MIDiA Research) 16 Fig. 19: Podcast advertising revenue worldwide in USDmn (source PWC) 17
Fig 20: 5 Forces of Porter (source: Author) 18
Fig 21: Gross margin (source: Spotify) 18
Fig. 22: Revenues forecast by segment (source: Spotify and author) 19
Fig. 23: EPS (source: Spotify and author) 19
Fig 24: Revenue growth per segment (source: author) 21
Fig. 25: Churn rate (source: author) 21
Fig. 26: % of MAUs who became Premium last 24 months (source: Spotify and author) 21
Fig. 27: monthly ARPU in EUR (source: author) 22
Fig. 28: CAPEX evolution 22
Fig. 29: D&A forecast (source: author estimates) 22
Fig. 30: NWC evolution 22
Fig. 31: FCFF (source: author) 22
Fig 32: EBITDA/Rev (source: Spotify and author) 26
Fig. 33: Profitability per user 26
Fig 34: LTV/ SAC (source: Spotify and author) 26
Fig 35: Gross Margin (source: Spotify and author) 26
Fig 36: ROE (source: Spotify and author) 27
Fig 37: Assets structure (source: Spotify and author) 27
Fig 38: Liquidity ratios (source: Spotify and author) 27
Fig. 39: Capital structure (source: Spotify and author) 27
Fig. 40: Spotify risk matrix (source: Author) 28
Equity Research:
Spotify Technology S.A.
October of 2019 Tomás Guedes ([email protected])Master in Finance
SPOTIFY: The Netflix of Audio
YE2020 price target of 176.47USD | Buy recommendation | Medium risk
7
01. Research Snapshot
The present equity research report supports a price target of USD176.47 for Spotify shares at the end of 2020, which corresponds to an upside potential of 32.7%. Hence, since the share is undervalued, it concludes with a BUY recommendation. The price target is the simple average of two different models that presented similar target prices: USD178.52 using Discount Cash Flow method and USD174.43 using Subscription Based Companies valuation model. We considered a medium-high risk investment due to the uncertain impact that adverse economic conditions might have on Spotify.
Spotify is the market leader of a recent industry – audio streaming service – where competes with the larger tech companies of the world: Apple, Google and Amazon. Subscription payments of Spotify Premium segment is the main source of revenue (89.7%) of the company. For a profitable and sustainable premium segment, Spotify aims to attract and retain customers. To attract new subscribers, Spotify includes free segment, which allows everyone to use the app, but with advertising commercials. In order to retain customers, the company continuously improves the user experience and customer personalization through R&D investment, leveraged the data collect from subscribers.
Despite Spotify has been presenting negative results, this analysis considers that the company will benefit from high scale gains in the long term.
32.7% 0 50 100 150 200
250 Fig 1: Spotify share price evolution (Source: Bloomberg)
Last Price Target price Current price $133.00 $176.47
This report is published for educational purposes by Master students at ISEG and is not an investment recommendation. This report must be read with the Disclosures and Disclaimer at the end of this report.
Appendices that support this report may be obtained from author upon request. -120,0 -20,0 80,0 180,0 280,0 380,0
Fig 2: EBIT in EURmn (source: Spotify and author)
8
02. Business Description
Spotify Technology S.A. is a digital audio distributer that provides on-demand access to millions of music tracks and podcasts. Its ambitious goal is to provide all the world’s music instantly to everyone, wherever and whenever they want. Spotify works as a social media of music as well, where customers can manage their music library, share songs and self-created playlists with their friends. Furthermore, Spotify’s well known and unique algorithm proposes artists and tracks to customers based on their listening history, making really easy to discover new artists and songs and increasing the customer engagement and experience. Additionally, Spotify provides a wide range of categories of podcasts and a small offer of audiobooks. Spotify is available on an app for smartphones, desktops and tablets and through its website, being currently in 79 countries worldwide (most of Europe, most of the Americas, Australia, New Zealand and parts of Africa and Asia).
Created in 2006 by Daniel Ek and Martin Lorentzon in Stockholm, Sweden, Spotify appeared to disrupt completely the music industry and how music is consumed. The streaming service was launched in 2008 only in Scandinavian countries, while licensing deals with the major labels started to be closed. Rapidly entered in the British market. While the company was growing in European countries, Spotify initiated its commercialization in the US market in 2011, with a key partnership with Facebook, which opened the door of the world to Spotify. With a higher range of content to offer, Spotify experienced an exponential growth between 2012 and 2018, achieving a CAGR of 60% in the number of subscribers. However, Spotify still records operating losses due to the high costs on royalties and low prices. Throughout its history, Spotify acquired some key strategic companies: The Echo Nest, Seed Scientific, CrowdAlbum, Sonalytic, MightyTV, Niland, SoundTrap, Loudr and, more recently, Gimler Media and Anchor. In 3rd April of 2018, Spotify went public with an IPO on the NYSE. The company fiscal address locates in Luxembourg City, despite its headquarters remaining in Stockholm.
Spotify Free
It is a free user service ad-supported. Customers can’t pick the track they want, it has to be played on shuffle mode, and there is a limit of tracks that customers can skip. Additionally, tracks can’t be downloaded, therefore it only can be listen online. Furthermore, customers can’t opt for high quality audio option. Revenue is generated through the sale of audio and video advertising and represented 10.3% of Spotify’s total revenue (Fig. 3) in 2018YE. However, free MAUs (Monthly Active Users) made up more than a half of total MAUs (Fig. 4). This segment recorded continuously negative gross margin, becoming positive in 2017 due to changes in data policies to improve show advertising effectiveness.
Spotify Premium
Paid-for service and the ultimate music experience. Paying customers can listen to music on-demand and offline, by downloading the tracks, on all platforms, in high quality audio and ads free. Additionally, there are two more sub-plans of Premium. Frist, Spotify Family is available for six members maximum and reduces drastically the premium per subscriber. Second, Spotify Student for half the price a college student has access to Spotify Premium, in order to engage young customers to Spotify and to create an important bound and dependence on the app. Revenue is generated through subscription fees, paid directly by subscribers or partners (generally telecom companies). This segment represents 89.7% of total revenues, despite of having a lower weight on total MAUs (46.4%). Its revenue grew at a CAGR of 39.6% since 2015, recording a gross margin of 26.6% in 2018YE.
89,7% 10,3%
Fig 3: Weight on revenues per segment (source: Spotify)
Premium Ad-suported
46,4% 53,6%
Fig 4: Weight on MAUs per segment (source: Spotify)
9 Key Drivers of Profitability
Monthly Active Users (MAUs) and Number of Subscribers
MAUs are the number of users who listened to any track for at least one millisecond in the last thirty days. This indicator is particularly important to Spotify Free: the higher the number of MAUs, the more companies will advertise through Spotify. Additionally, the firm sates that 60% of free users went Premium between 2014 and 2016, making Ad-supported plan a core driver to acquire subscribers. Subscription fees make up the bulk of Spotify’s revenue (Fig. 5 and 6), therefore one main objective is to increase the number of subscribers. Spotify accounts for 96mn subscribers (2018YE), which grew at a CAGR of 62.6% since 2014. Building a large and loyal subscriber base is key in order to leverage a spreading effect of license costs, reducing license costs per user relatively to the average revenue per user.
Average Revenue per User (Fig. 7)
Increasing the number of subscribers is not enough to ensure profitability, it must be sustainable. ARPU of Spotify is continuously decreasing due to family and student plans introduction and to internationalization expansion to countries with lower purchasing power. Therefore, decreasing customer acquisition costs per user allied to an increasing subscriber base, leads to a growing brand value and competitiveness. This dynamic gives a high importance to the scalability of business.
Customer retention (Fig. 8)
Because companies compete for customers, retention plays a key role on subscription-based business model. Retention is evaluated by the churn rate (percentage of subscribers to a service who discontinue their subscription within a given period). When the churn rate is higher/lower than new customers rate, then a company is losing/acquiring subscribers. Companies invest on personalization strategies in order to increase customer loyalty and, consequently, to reduce the churn rate. Spotify Family plan had a significant impact on churn rate, which decreased from 7.7% to 5.2% until 2018, while the number of premium subscribers were increasing by a CAGR of 50.8%.
Content license
Spotify depends on acquiring content licenses from several major and minor content owners and other rights holders in order to provide its service. License music rights are extremely complicated, each country has its own regulations, and are a key part of Spotify business. Spotify gets two classes of licenses. First, Sound Recording License agreements, which cover the rights to a certain recording. In this case, Spotify renegotiated deals with the major record companies in 2017: Universal Music Group, Sony Music Entertainment Group (owner of more than 5% of Spotify shares), Warner Music Group and Music and Entertainment Rights Licensing Independent Network (Merlin) for digital recordings from independent labels. Second, Musical Composition
28 48 71 96 7,7% 6,2% 5,5% 5,2% 3% 4% 5% 6% 7% 8% 0 20 40 60 80 100 2015 2016 2017 2018 Fig 8: Churn rate and premium
subscribers (source Spotify)
Subscribers (Mn) Churn rate 5,16
4,58
4,31 4,09
2015 2016 2017 2018 Fig 7: ARPU in €/month (source:
Spotify)
10%
40% 20%
30%
Fig 5: Premium subscribers by region in 2018 (source: Spotify)
APAC Europe
LATAM North America
12%
36% 22%
30%
Fig 6: MAUs by region in 2018 (source: Spotify)
APAC Europe
10
License Agreements to cover who own the rights to the song, which are divided into performance rights, paid to song publishers, and mechanical royalties paid to songwriters when a song is reproduced (Appendix 14). Royalties are calculated using negotiated rates based on subscription and advertising revenue earned, or usage measure or a combination of both.
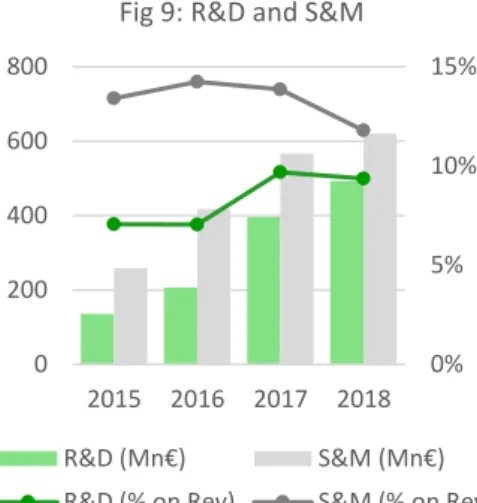
R&D and Sales&Marketing Expenses
Both represented nearly one fourth of the total revenues in 2018 and together play a key role on subscribers acquisition and retention strategy. R&D enhances the functionalities of existing products and allows the creation of new ones, improving the user experience and, consequently, retaining subscribers and reducing the churn rate. Sales and marketing expenses aims to enlarge subscriber base. Both expenses are increasing, but at a slower pace than revenue, reducing their weight on the cost structure (Fig. 9).
Company Strategies
Spotify as a subscription-based company
Spotify provides the major part its service on a subscription basis, guaranteeing a stable cash flow at low distribution costs. A key concept related to this business model is customer franchise, which is the cumulative perspective that customers held after a long exposure to a service (source: Time to Change Your Investment Model by Feng Gu and Baruch Lev). Supported by its streaming content, Spotify has been building its customer franchise through customer acquisition (campaigns and special plans, such as Spotify Family and Spotify Student), engineering (Spotify’s Discover Weekly service provided by its algorithm), brand development and R&D through a high increase of sales and marketing and R&D expenses.
Business scalability
Spotify’s business model supports profitability at scale, therefore its strategy prevails speed of growth instead of efficiency, as is pointed out by Reid Hoffman and Chris Yeh in the book Blitzscaling. The goal is to generate substantial revenues as the number of subscribers expands, improving margins at scale. The introduction of Spotify Family aims this objective. It resulted in an outstanding increase of subscriber base, despite its negative switching effect (already premium subscribers changed to Spotify Family, decreasing their fees). For the next years, Spotify plans to follow two strategic lines in order to achieve business scale:
Business model to acquire and retain (Fig. 10). By increasing its base of subscribers, Spotify collects more data about listening habits of its users. This data can be leveraged to personalize offer in the shape of listening proposes, with new artists, songs and playlists that fits each customer’s music taste. Personalization is key for a better customer experience and, consequently, lower churn rate and more customer acquisition.
Emerging markets as a key target. Monthly payments are different country by country. For instance, Spotify premium is MEP100 (approximately USD5) in Mexico and USD9.99 in the US, creating a Spotify international price index. This pricing strategy of adapt prices according to the local purchasing power suits perfectly in emerging economies due to their high population and low purchasing power. Additionally, these countries haven’t had the strongest digital music environment, but Spotify offers a superior experience and value proposition than piracy. Therefore, emerging markets present one big growth opportunities. In 2018, Spotify expanded its footprint to 79 countries after launching its service across 13 new locations in the Middle East and North Africa (Appendix 15).
0% 5% 10% 15% 0 200 400 600 800 2015 2016 2017 2018 Fig 9: R&D and S&M
R&D (Mn€) S&M (Mn€) R&D (% on Rev) S&M (% on Rev)
Scale Data Persona-lization Learn user listening habits Create more engaging platform Attract and retain more users
11 Expanding Business
Focus on Podcast segment. In February of 2019, Spotify announced the acquisition of two companies related to podcast production: Gimler Media, an advertising and famous podcast creator, and Anchor, an audio platform for podcast creators to share their work. Additional M&A podcast related are expected in 2019, summing a total of USD500mn deals. With this move, Spotify intends to become both the premier producer of exclusive podcasts and the leading platform for podcast creators. Furthermore, it will help the firm to find new users, generate more revenue and increase its margins, since produce and license podcasts is cheaper than music. Moreover, it demonstrates how Spotify is still switched on growth mode and market share gain.
Spotify as a label company. Despite Daniel Ek stated in mid-2018 Spotify is not “acting like a record label”, the natural and logical path for the company is to become one. On one hand, Spotify would decrease drastically its license costs and, on the other, artists would receive a higher share of revenue and maintain their presence on Spotify platform.
Advertising is a trigger for growth
Spotify for Brands is a platform to manage Spotify relationship with advertisers. Through what streaming customers listen, Spotify learns more about them, which leverage the effectiveness of advertising campaigns. Furthermore, Spotify offers a large range of ad experiences allied to measurements of the impact on customers. For example, the Reebok case. Spotify’s app leverages the connection between music and exercise by providing people with playlists made up of the best songs for sports activities, all voted on by people who use the app. Moreover, Reebok also got some of sponsored athletes to choose their favorite workout music.
Spotify Ad Studio is an advertising platform that allows advertisers to create and manage their audio ad campaigns. Ads must be approved by Spotify. Additionally, advertisers can target listeners in terms of location, genre, playlist and fans. By provide ad audio tools, including a voiceover service, Spotify shortens the path between advertisers and the company in an easy and direct way.
Partnering as key part of Spotify’s business model (Fig. 11)
Spotify opted to build a partnership portfolio to compete, increasing its presence on the daily lives of customers. For instance, Spotify partnered with Facebook to enter into the US market, where it was completely unknown. There was a change of each party unique resources: Facebook delivered access to a new channel for Spotify to reach an outstanding number of potential new subscribers, and Spotify delivered an additional value proposition to Facebook by offering legally shareable music.
Relation with artists
Some top artists (e.g. Thom York, Taylor Swift) criticized stream music distribution, particularly regarding how much artists get paid for the streaming of their music. Spotify partnered with Bandpage (online service that integrates an artist’s social media) and created the Spotify for Artists, which is increasing indie musicians’ value. Independent artists often license their music to streaming companies by using third-party distribution companies like TuneCore as intermediary. Spotify’s new strategy seeks to cut those distribution services by allowing artists to license the same music directly to Spotify, decreasing license costs and enlarging the artists’ share of royalties (for example the singer VIAA). Additionally, there is no exclusivity involved and artists maintain ownership of their master recordings, which is rarely the case under label contracts. Moreover, was launched a playlist submission feature, which enables artists, labels, and their teams to submit unreleased music directly to Spotify’s editorial team for consideration for inclusion on owned & operated playlists. Hence, Spotify is working as a door for smaller artists to be known by music consumers. In
-Tesla -Ford -Volvo -BMW
Ride sharing -Uber
Airlines -Virgin America
-Samsung -PlayStation -Philips -Roku -Facebook -Twitter -Bandpage -Tinder Connected devices Social networks
Spotify portfolio partnerships
Car manufacturers
Figure 11: Spotify partnerships (Source: Spotify and Author)
12
mid-2018, there was 200 thousand artist in the platform, twice as much as in the beginning of the year.
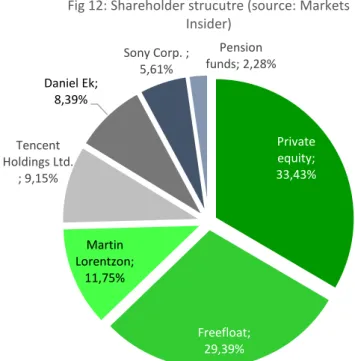
Shareholder Structure
In August of 2019, the shareholder structure of Spotify was composed as shown in Fig. 12. Despite there is not any majority in the shareholders structure, Spotify founders, Daniel Ek and Martin Lorentzon, hold 80.4% of vote rights because their shares have super voting power, allowing both to maintain the control of the company after the IPO. This strategy was used before by Facebook and Alphabet.
Important to mention that one of the big3 music labels, Sony Corp., holds 5.61% of shares. Tencent Holdings Ltd., the Chinese streaming company, holds 9.15%, while Spotify holds 9% of Tencent Music Entertainment, after a share swap agreement in December 2017. Private equity; 33,43% Freefloat; 29,39% Martin Lorentzon; 11,75% Tencent Holdings Ltd. ; 9,15% Daniel Ek; 8,39% Sony Corp. ; 5,61% Pension funds; 2,28%
Fig 12: Shareholder strucutre (source: Markets Insider)
13
03. Management and Corporate Governance
The board is composed by nine members, the two co-founders, Daniel Ek and Martin Lorentzon, and seven independent directors, according to NYSE rules that ensures no conflict of interests between the directors and the company. Additionally, the board has two standing committees: an Audit Committee, to ensure the integrity of the Spotify’s financial statements and to oversight risk management and the company’s performance, and a Remuneration Committee to carry out the Board’s responsibilities regarding the compensation of executive officers. Both committees’ composition includes one non-executive director and two members of the management team. Finally, the Statutory Auditor is Earnest and Young S.A.
The co-founder of Spotify Daniel Ek accumulates the function of CEO and Chairman of the board of directors, being the only executive director. Before Spotify foundation, Mr. Ek founded Advertigo, an online advertising company, and was responsible for various senior roles at Tradera, an auction company lately acquired by eBay. Additionally, was CEO at Stardoll, a fashion and entertainment community for pre-teens. The other co-founder, Martin Lorentzon, is a member of the board and was Chairman between 2008 and 2016. His path went through digital and internet businesses as well. They are both considered non-independent directors. Therefore, both are highly experienced in marketing and digital business and are strongly committed with their Spotify project, which fits perfectly in the firm’s DNA and strategic plan.
Besides Mr. Lorentzon, the other non-executive members are all experienced in technology, innovation and marketing functions, whose inputs can be highly leveraged by Spotify.
The Chairman holds almost one fourth of the company’s shares, making him an important but not a unique piece in the decision making.
It is also important to mention the key role played by Spotify CFO, Barry McCarthy, hired in July of 2015. He served as Netflix from 1999 to 2010, being an expert in digital entertainment and streaming services. His inputs and experience can provide financial stability to Spotify’s growth as it was performed in Netflix.
Fight against piracy
Spotify presents itself as a legal alternative to piracy by creating a sustainable environment for artists and music consumers. The company built a bridge that connects creators and fans that provides artists access to millions of monthly active users worldwide, increasing culture diversity among fans.
IT education
Spotify founders wrote an open letter to Sweden government asking for inclusion of programming in middle school. Furthermore, created Spotify for Developers, allowing any developer to explore audio features and in-depth audio analysis of tracks with data supplied by the company.
14
04. Industry Overview and Competitive Positioning
World Economy Overview – Political and Economic Drivers
Spotify launch coincided with the financial crisis of 2008, therefore its initial growth phase followed the world economy recovery. IMF forecasts indicate that the world economy is stabilizing, despite the negative trend of advance economies’ GDP growth rate (Fig. 13). Since more than 70% of its revenue is generated in North America and Europe, a GDP slow down affects negatively private consumption and customers’ purchasing power. Emerging markets forecasted growth has a large positive impact from China economy. However, this is an inaccessible market for streaming firms due to Chinese online censorship laws and local market saturation (Alibaba, Tencent and Baidu).
Additionally, Spotify may face severe consequences due to political uncertainties worldwide. Since 11% of revenues in 2018Q3 came from the UK, the uncertainty from BREXIT may have high impacts on Spotify revenue. Furthermore, 20% of Spotify subscribers are in Latin America region, which is living in an adverse political and economic framework (Brazil, Argentina, among others).
Exchange rate exposure
Spotify’s global presence exposes the company to exchange rate risk. Fig. 14 shows the impact of currency volatility on year over year revenue growth rate throughout 2018 quarters. Growth rates of the first two quarters were negatively impacted by 11pp and 8pp, respectively. Spotify uses foreign exchange forward contracts to hedge transaction exposure on a case-by-case basis. Recent years’ exchange rates evolution has been favoring Spotify, with EUR recording valorization in terms of other main currencies. For the next years, the political uncertainties referred before can bring a higher volatility into the forex market.
Interest rate
Spotify holds interest-bearing assets, primarily short-term debt securities, exposing the company to interest risk. According to the company sensitivity analysis, if interest rates increase 100bp, then interest income would decrease EUR5mn in 2018Q3. Inflation rate
Since purchasing power is a key driver for Spotify business model, an increase of inflation rate will reduce it and might have a negative impact on the company revenue. Fig. 15 indicates a decrease of inflation rates until the end of 2019, time when the negative trends inverts and starts to grow.
Global Music and Streaming Market Overview
Music industry is recovering from the losses of the past 15 years, since 2017YE total revenue represents only 68.4% of the market’s peak in 1999 (US music market annual revenue fell from USD14.6bn in 1999 to USD6.3bn in 2009). However, RIAA states in its mid-year 2018 report that record industry is “growing again, driven by a competitive paid subscription market”. Streaming services is saving music industry by changing consumption to a new paradigm: accessibility over ownership.
Streaming is boosting the music market (Fig. 16)
Streaming music is an emerging business, making very difficult to evaluate its current and future prospects. In 2017, global music market recorded one of the highest growth rates in twenty years, 8.1%, driven by the continuously outstanding performance of streaming music, which became the single largest revenue source, with a share of 38.2%, after an increasing at a CAGR of 41% since 2008. Note that, the start growing period coincides with the one of Spotify. The other sources of revenue are losing strength to streaming, mainly digital downloads (CAGR of -2.1%), which will lose Apple’s contribution since it plans to exit music downloads by 2019, and physical
11,9 10,4 8,9 8,2 7,6 6,7 6 5,7 5,5 5,2 3,4 3,7 3,9 4,2 4,4 4,3 4 3,8 3,2 2,8 0,3 0,4 0,4 0,6 1 1,4 1,9 2,8 4,7 6,6 1,3 1,3 1,4 1,4 1,6 1,8 1,9 2 2,3 2,4 2008 2009 2010 2011 2012 2013 2014 2015 2016 2017 Fig. 16: Global music revenues in
USDbn (source IFPI)
Synchronisation Revenues Performance Rights Streaming
Digital (excl. Streaming) Physical 1,0% 2,0% 3,0% 4,0% 5,0% 2015 2016 2017 2018 2019F 2020F 2021F 2022F 2023F Fig. 13: GDP growth rate
(source: IMF) Advanced economies Emerging markets World 20% 25% 30% 35% 40% 2018Q1 2018Q2 2018Q3
Fig 14: Exchange rate impact on revenue growth rate yoy (source: Spotify)
Revenue
Revenue (excl. exchange rate impact)
1,0% 2,0% 3,0% 4,0%
Fig. 15: Inflation rate projection (source: Statista)
European Union Euro Area (EA-19) World
15
(CAGR of -8.8%), namely CDs, since the market niche of vinyl increased 13% in the 1st semester of 2018 in the US, according to IFPI (Recording Industry Association of America).
The main reason for the last decade of losses of music industry is piracy. File sharing was introduced in 1999, which coincides perfectly with the decline of music sales in the US. It is estimated that piracy takes away from music stakeholders USD12.5bn per year in revenue. Streaming competes with piracy by providing a more organized and curated product with a better user experience. However, piracy still is a major issue for music industry: 38% of music consumers access unlicensed music (Fig. 17), particularly in emerging markets like India and Mexico still have a 90% piracy rate, meaning that there are a lot of potential consumers who could turn into music streamers.
Technology penetration is key
As smartphones become more advanced, the content consumed on them evolves as well. Smartphones usage base will continue to rise at a CAGR of 7.35% worldwide until 2020. Additionally, 5G introduction allows customers to use internet in densely crowded spaces or locations where bandwidth is low, such as the subway. As these technologies evolve, streaming music will increase in accessibility and quality too. Supply
Record labels are reporting high revenue, since streaming emerged. According to Music Business Worldwide, the known big3 (Sony, Universal and Warner) registered an average revenue of USD19mn a day from streaming services throughout 2018. Despite some artists’ critics, streaming firms rapidly proved them wrong and showed great advantages to artists. When a listener plays a song, the artist gets a tiny amount of money. If a listener adds a song to his own playlist that can mean it will be repeatedly heard over a lifetime. If a song is added to one of Spotify’s playlists, the artist can expect millions of plays. Therefore, streaming brought royalties for eternity, which doesn’t happen on other music products.
Demand (source: Statista – Music streaming outlook)
In 2017, streaming music became the most relevant source of revenue in music industry and forecasts indicate that this positive trend is here to stay. It is expected a clear increase of the number of users of streaming music worldwide, mainly in the US, where is forecasted a CAGR of 7.7% until 2023 and a penetration rate of almost 60% after 2020.
The ARPU is expected to decrease in the US, since revenues increase pace is lower than that of the increase number of users. The competition in the American market is a probable reason for this dynamic, obliging streaming firms to practicing lower prices to capture the maximum number of users as possible. Forecasts indicate that the Worldwide ARPU will decrease as well. Emerging markets are a key target for streaming companies, however, they will have to practice lower prices in order to have a high penetration rate, decreasing ARPU. Additionally, group and special plans may have contributed for this trend as well.
For Europe, revenue is expected to grow at a CAGR of 6.8% with penetration rate achieving 20%. The base of users will increase as well, but with a more stable ARPU comparing with the US.
Competitive Positioning
Streaming music market is highly competitive, for the high number of competitors, and concentrated, since the four largest players represent 75% of the total of subscribers. Spotify is by far the market leader in terms of subscribers, recording a
36% 19% 12% 8% 3% 3% 3% 2% 14%
Fig. 18: Subscribers Market Share Worldwide
2018S1 (source: MIDiA Research)
Spotify Apple Music Amazon Music Tencent Music
Deezer Google Pandora MelOn Others 40% 38% 2017 2018
Fig. 17: % of consumers that accessed unlicensing music
16
market share of 36% in the 1st semester of 2018, almost the double of the second player, Apple Music.
Competitors
We can distinguish the market into kinds of firms. On one hand, streaming music firms are associated to the biggest tech companies in the world: Apple Music, Amazon Music, Tencent Music and Google Play Music allied to YouTube Red. These companies present the huge advantage of being subsidiaries of large resources tech groups, securing other sources of revenues that only streaming firms don’t have. On the other hand, there are other competitors that compete exclusively in the streaming music market: Spotify, Pandora and Deezer.
Podcast market, a growing opportunity (Fig. 19)
Audio streaming firms plan to do to radio shows what Netflix did to TV shows. PWC states in its Global Entertainment & Media Outlook 2018-2022 that podcasting is poised to grow into a nine-figure component of the global media landscape. PWC states that 61% of podcast listeners made a purchase resulting from podcast ads and forecasts a CAGR of around 30% until 2022.
According to podcastinsights.com, 80% of podcast consumers listen to all or most of each podcast episode and follow 7 shows per week on average. Comparing to music listeners, podcast listeners are more loyal, affluent, educated and have a higher purchasing power. Moreover, according to Edison Research, 26% of total Americans and 33% of Americans aged between 25 and 54 listen to podcasts monthly, which is a young audience. Smartphone is the most used device to follow podcasts and its increasing penetration rate forecasts indicate that there will be more potential clients. Hence, this is a market in expansion with positive perspectives for growth.
With Gimlet and Anchor acquisitions, Spotify became the second larger podcasting platform and its data indicates that podcast users spend nearly twice the time on the platform. Spotify forecasts that more than 20% of all its listening will be non-music content, leveraging the opportunity for differentiation through the creation of exclusive content. SWOT Analysis 0 200 400 600 800 1.000 1.200 1.400 1.600
Fig. 19: Podcast advertising revenue worldwide in USDmn
17 5 Forces of Porter (Fig. 20)
Threat of new entrants – Low [2]
In order to offer a complete library to call the attention of customers, streaming firms face a heavy initial investment on content licensing and close deals with a huge number of copyright owners. Since it launched, Spotify spent USD9.76bn in royalties to artists, music labels and publishers. Additionally, this new market didn’t prove to be profitable yet, which increases the risk of investment. Therefore, streaming music market faces high barriers to entry, reducing the threat of new entrants.
Bargaining Power of Suppliers – Low [2]
The launch of streaming firms saved the deteriorated music industry, including labels. The partnering environment lived between Spotify and labels suggests that the role played by each side each side is clearly defined: labels produce, Spotify distributes. Therefore, is unlikely that labels use their power to affect Spotify negatively. For instance, in 2016 Spotify negotiated copyrights agreements with the major four labels in order to reduce its payments. New contract allowed to Spotify to improve its gross margin drastically (Fig. 21), meaning that labels are in fact interested in Spotify economic viability and recognize its importance in music ecosystem. However, equilibrium doesn’t work so well with smaller and independent labels. The rumors about Spotify becoming a label and the streamer new strategy of signing directly with a few indie artists might affect this relationship. On the other side, some artists see this move as good news.
Bargaining Power of Buyers – High [4]
As most subscription business models, customers don’t face any switching costs, which highly increase their bargaining power and forces streaming firms to offer extra value to their streaming services. However, customers are forced to rebuild their playlists if they change their stream provider. At this moment this force didn’t affect much Spotify, since its brand recognition and customer experience are bounding clients to the company.
Threat of Substitute Products – Low [2]
Fig. 16 shows how streaming took over the global music market in high speed way. Therefore, we see clearly a preference of customers for streaming services rather than the traditional ones. However, YouTube represents the major threat for streaming companies. It offers nearly the same content for free, without restrictions and registrations. Moreover, YouTube content is supplied by its users, avoiding the payments directly to copyright owner regarding content licensing. If copyright regulations remain as they are today, YouTube will maintain its operations, while streaming firms will keep struggling to acquire YouTube clients. Additionally, piracy still represents a barrier for streaming firms to grow.
Rivalry Among Competitors – High [4]
With its partnering strategy and strong brand recognition, Spotify achieved the market leader position. However, the company sees some disadvantages comparing with its main rivals. First, streaming is the only source of revenue of Spotify, on the contrary of Apple Music and Amazon Music, which streaming music represents only tiny piece of a giant business. Second, those rivals have much larger amounts of cash ready to be invested if any opportunity appears. Third, because the majority of users play Spotify on smartphones, they download Spotify’s app from Google Play Store and Apple Store, which takes a share of Spotify’s revenue directly to its rivals. For instance, Spotify and Amazon accused Apple for anticompetitive practices due to its subscription policies used to punish third-party music services that use Apple’s platform.
2 2 4 2 4 Threat of new entrants Bargaining Power of Suppliers Bargaining Power of Buyers Threat of Substitute Products Rivalry Among Competitors
Fig 20: 5 Forces of Porter (source: Author)
13,7% 15,4%
20,8%
25,7%
2015 2016 2017 2018 Fig 21: Gross margin (source:
18
05. Investment Summary
As mentioned before, this report conclusion is a BUY recommendation for Spotify shares, with a price target of USD176.47, corresponding to an upside potential of 32.7% comparing to the price verified at 08-29-2019 (USD133.00). There are two main reasons for the company’s undervaluation. First, Spotify’s strategy of prevailing fast growth over efficiency is pressuring its operating margins. For instance, Spotify has never presented a positive EBITDA. Second, as mentioned previously, audio streaming industry did not prove to be profitable yet, which is unattractive to potential investors and creates a pessimism environment regarding Spotify.
Spotify is the worldwide market leader in audio streaming industry, enjoying high first mover gains and, more importantly, high returns for the R&D investments of the past years – the company is building a loyal customer base with low churn rates through continuously user experience improvement. The forecasted increasing number of premium subscribers and MAUs is reflected in the revenue forecast for premium and ad-supported segment with CAGR of 8.7% and 17.2%, respectively (Fig. 22). It is estimated that while business gains scale, margins will improve, turning Spotify into a profitable company.
Moreover, Spotify registered two M&A operations by acquiring Gimlet Media and Anchor, two podcast related companies. This move aims at two objectives. First, increases the podcasts content, enlarging and diversifying Spotify offer which attracts more subscribers. Second and more importantly, the streaming service aims to produce exclusive podcast shows in partnership with the acquired companies. This strategy is similar to what Netflix did with TV shows and movies. For instance, former US president Barack Obama and Michelle Obama are producing a series of podcasts exclusively for Spotify.
Company valuation
In order to perform a firm valuation, we used two methods: Discounted Cash Flow method and Subscription Based Companies valuation method. The table below resumes the output of each valuation model application. To be noted that the results obtained in DCF and SBC are close – which price target differs by USD4.08.
DCF SBC Multiples
EV (in USDmn) 29,247.39 28,578.36 77,000.48
Price target (in USD) 178.52 174.43 204.52
Upside potential 34.2% 31.2% 53.8%
Company risks
The main identified risks are related to the uncertainty related to Spotify capability to achieve a profitable scale level. Additionally, the unknown impact of economic variables, such as, inflation, lost purchasing power, among others, brings another dose of uncertainty in this investment. Key risks impact were computed through a sensitivity analysis and a Monte Carlo simulation.
0,140,28 0,64 1,03 1,44 1,90 2,42 0,00 0,50 1,00 1,50 2,00 2,50
Fig. 23: EPS (source: Spotify and author)
19
06. Valuation
For the company’s valuation, it was applied the following valuation methods:
The Discounted Cash Flow (DCF) was chosen due to the amount of public information available, which allows the estimation of the company’s enterprise value. Additionally, Spotify presents a zero dividend policy and, according to its Annual Report of 2018, it is expected to remain as is.
A valuation method specific to subscription based enterprises, published by Feng Gu and Baruch Lev in the paper Time to change your investment model. The goal to use this investment model is to shift the focus from the operating earnings to the company’s strategic assets, which corresponds to a long term view of the business and its value creation. Additionally, it uses non-GAAP measures, avoiding accounting manipulation in earnings calculations as occurs in DCF valuation. Additionally, for a relative valuation model, the Market Multiples was applied in
order to use a valuation method comparable with Spotify market peers.
Forecast analysis Addressable market
The first step to estimate the addressable was collect the world population data and its growth forecast by region where Spotify holds economic activity: APAC (excluding China), Europe, LATAM and North America. Data is presented in Appendix 1 and was collected from PopulationPyramid.net.
After knowing the population by region, it is required to estimate the share of population who is a music listener. According to IFPI – Music Consumer Insights 2018 report, 70% of inquired people worldwide considers that music is important in their life. We applied this percentage to each region population, given the number of music listeners by region (Appendix 2).
The third step was to estimate the audio streaming adoption by music listeners. According to IFPI – Music Consumer Insights 2018 report, audio streaming adoption by region was the following:
APAC (excluding China) – 55.7%; Europe – 59.7%;
LATAM – 48.2%; North America – 74.5%.
Note that each rate was computed using the audio streaming adoption simple average for the countries included in the inquiry that belong to each area. For instance, North America region is composed by USA and Mexico and each country audio streaming adoption is 68% and 81%, respectively. Hence, North America audio streaming adoption is the average of the two rates presented, corresponding to 74.5% in 2018. The following step is to forecast the audio streaming adoption for the analyzed period. Smartphones are the most used device for listen to streaming services, hence smartphone adoption evolution is considered the main driver for audio streaming adoption. The Global System Mobile Association estimates the smartphone adoption for 2017 and for 2025 by region. Using each rate, we computed the respective CAGR and the smartphone adoption for the years in between (Appendix 3).
In order to apply the smartphone adoption growth to forecast audio streaming adoption, we used the formula below. The results are presented in Appendix 4.
𝐴𝑢𝑑𝑖𝑜 𝑎𝑑𝑜𝑝𝑡𝑖𝑜𝑛𝑇 =
𝐴𝑢𝑑𝑖𝑜 𝑎𝑑𝑜𝑝𝑡𝑖𝑜𝑛𝑇−1∗ 𝑆𝑚𝑎𝑟𝑡𝑝ℎ𝑜𝑛𝑒 𝑎𝑑𝑜𝑝𝑡𝑖𝑜𝑛𝑇
20
By applying the audio streaming adoption to each region music listeners for each year, we achieve the audio streaming potential market by region for the period under analysis (Appendix 5), which corresponds to the Spotify addressable market.
To be noted that China is excluded from this analysis due to its censorship laws and Tencent Music Entertainment strong presence.
MAU estimation
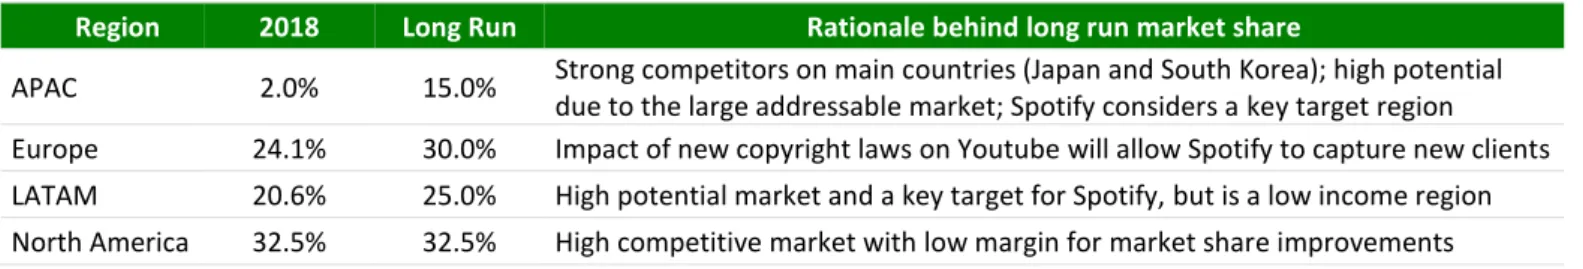
In order to estimate Spotify MAU, it is necessary to estimate Spotify MAU market share by region and apply that share to each region addressable market. In 2018, Spotify market share of MAU (weight of Spotify MAU on the addressable market) was the following (full table is presented in Appendix 6):
Region 2018 Long Run Rationale behind long run market share
APAC 2.0% 15.0% Strong competitors on main countries (Japan and South Korea); high potential due to the large addressable market; Spotify considers a key target region Europe 24.1% 30.0% Impact of new copyright laws on Youtube will allow Spotify to capture new clients LATAM 20.6% 25.0% High potential market and a key target for Spotify, but is a low income region North America 32.5% 32.5% High competitive market with low margin for market share improvements
Each year growth rate was computed dividing the difference between long run and 2018 market share by 8 years (all period dimension). For instance, for APAC market share (15%-2%)/8 years equals 1.6pp, meaning that 2019 market share is equal to 3.6% (2%+1.6pp).
Revenues
Total revenues is the sum between premium segment and ad-supported segment (Fig. 24).
The premium segment (Appendix 7) is the product between the number of premium subscribers and ARPU.
The number of premium subscribers was estimated using the following formula:
Number of premium subscriberst =Number of premium subscriberst-1 * (1 – Churn ratet) +
MAUst-2 * %MAUs who became premium in the last 24 months The formula can be divided into two parts:
First, Number of premium subscriberst-1 * (1 – Churn ratet) represents the number of premium subscribers who did not give up on the service, meaning that they still pay for subscriptions. The target churn rate for music listeners is 5%. Spotify stated in the 1st quarter earnings call that podcast listeners are twice as loyal as music listeners – podcast churn rate of 2.5%. Additionally, Spotify estimates that, in the long run, 20% of total premium subscribers will be exclusive podcast listeners. In conclusion, the target long run churn rate is the following:
5% * 80% + 2.5% * 20% = 4.5% (Fig. 25).
Second, MAUst-2 * %MAUs who became premium in the last 24 months represents the MAUs signed the premium service. The percentage of MAUs who became premium in the last 24 months is a KPI identified by Spotify, which is assumed to decrease 5% year over year, following the trend verified since 2015 when Spotify Family was introduced (Fig. 26).
Spotify’s ARPU has been decreasing since 2015 due to the launch of Spotify Family and the entrance in low income markets. Since these two trends are expected to remain in next years with the entrance in low income markets and the proliferation of Spotify Family, it is considered a long run target ARPU of 3€/month (Fig. 27).
60%
55%50%
45%40% 35%
30%25% Fig. 26: % of MAUs who became Premium last 24 months (source: Spotify and
author) 5,1% 5,0% 4,9% 4,9% 4,8% 4,7% 4,6% 4,5% Fig. 25: Churn rate (source:
author) 0 2.000 4.000 6.000 8.000 10.000 12.000
Fig 24: Revenue growth per segment (source: author)
21
The ad-supported segment (Appendix 8) revenue is the sum of two components: Music ad revenue. The multiplication of the number of MAUs, the average amount
of time each MAU spends on Spotify and the revenue generated per hour listen. According to the Company, each MAU listens to Spotify approximately 25 hours/month or 300 hours/year in 2018. Therefore, the revenue per MAU was 0.02 EUR/hour, which is assumed to be constant over the analyzed period.
Podcast ad revenue. PwC Podcast Advertising Revenue Study forecasts an ad-revenue CAGR of 29.7% for podcast industry (2018F-2022F). We expect that Spotify will collect around 20% of podcast industry revenue until 2022F. It is assumed that the podcast ad revenue grows as the same rate of music ad revenue after 2022F. Cost of Revenues
In 2018, it represented 74.3% of total revenues, meaning a gross margin of 25.7%, which is growing since 2015. Spotify targets a gross margin of 32.5% in the long run. Therefore we assumed a constant grow until the company achieves the target in the terminal period.
Operating Expenses
The long term target ratio for R&D expenses to revenues is 15%, as stated in Spotify Investors’ Day, representing an increase compared to the past years. This trend is caused by the investment on exclusive podcast content and strategy to continuously improve user experience.
Sales and marketing expenses are expected to decrease to a 10% target ratio to revenues, following the trend of recent years. The company’s global positioning and brand value allow Spotify to reduce this expense.
CAPEX (Fig. 28)
In order to accommodate anticipated future growth, Spotify invested in new and existing leased offices spaces €145Mn in 2018 and €200Mn in 2019. According to the Annual Report 18, the Company expects that after the investment, offices are suitable to support future growth. Hence, after 2019, it is assumed a replacement CAPEX of 3% of P&E to represent office materials, namely, IT materials. Note that it seems a low CAPEX spending for the projected growth, however, tech firms do not need machineries or factories, since its investment is focused on R&D.
Depreciations and Amortizations (D&A) (Fig. 29)
Depreciations forecast depends directly on property and equipment account, which is composed by Spotify leased offices, which useful life is 17 years and depreciates in straight line method. Since P&E accounts for €364Mn in 2019YE, including the CAPEX investment, depreciations are considered €21.4Mn per year.
Amortizations are estimated through the average ratio between amortization and intangible assets of the last 3 years, corresponding to an amortization rate of 25.1%. Net Working Capital (NWC) (Fig. 30)
Changes in NWC are expected to increase in next years. This occurs because current assets are linked to revenues and current liabilities are linked to COGS and operational expenses. Since it is predicted that revenues growth faster and costs, the same is predicted regarding current assets and liabilities, implying a decreasing NWC.
0 500 1.000 1.500 2.000 2.500 3.000 3.500 Fig. 30: NWC evolution Current assets Current liabilities NWC 0 10 20 30 40 50 60
Fig. 29: D&A forecast (source: author estimates) Depreciation Amortization 0 50 100 150 200 250
Fig. 28: CAPEX evolution 3,96 3,82 3,68 3,55 3,41 3,27 3,14 Fig. 27: monthly ARPU in EUR
22 DCF Model Valuation
According to the DCF Model application to the forecast performed, the target price for Spotify in 2020YE is USD178.52, corresponding to an upward of 34.2% comparing to the share price in 08-29-2019 (USD133). Hence, Spotify share price is undervalued and is recommend to BUY. The valuation period considered is 6 years plus the terminal value. All DCF Model calculations are explained below.
Note that the calculations performed are in EUR and the share price was converted to USD at an exchange rate of 1.10388, according to XE Corporation website in 08-30-2019.
Free Cash Flows to the Firm (FCFF)
The FCFF were calculated according to the estimates presented before in the forecast analysis topic. The formula used and the corresponding values are presented below.
𝐹𝐶𝐹𝐹 = 𝐸𝐵𝐼𝑇 ∗ (1 − 𝑇) + 𝐷&𝐴 − 𝑁𝑊𝐶, 𝑐ℎ𝑎𝑛𝑔𝑒 − 𝐶𝐴𝑃𝐸𝑋 2020F 2021F 2022F 2023F 2024F 2025F EBIT*(1-t) -97.8 -41.4 19.8 86.9 155.8 232.5 D&A 37.2 45.9 54.3 62.6 70.7 78.8 NWC, change 149.0 -30.6 -9.1 -21.3 4.7 4.8 CAPEX 11.4 11.1 10.8 10.5 10.2 9.8 FCFF -221.0 23.9 72.4 160.3 211.7 296.7
Weighted Average Cost of Capital (WACC)
The WACC rate is the discount rate of the DCF model and was computed as followed: 𝑊𝐴𝐶𝐶 = 𝑟𝐸∗ ( 𝐸 𝐸 + 𝐷) + 𝑟𝐷∗ ( 𝐷 𝐸 + 𝐷) ∗ (1 − 𝑇) 2020F 2021F 2022F 2023F 2024F 2025F Terminal Cost of Equity 7.24% 7.38% 7.05% 6.63% 6.22% 5.84% 5.48% Cost of Debt 4.38% 4.38% 4.38% 4.38% 4.38% 4.38% 4.38% Weight of Equity 39.2% 38.4% 40.3% 42.8% 45.6% 48.6% 51.7% Weight of Debt 60.8% 61.6% 59.7% 57.2% 54.4% 51.4% 48.3% Tax rate 18.0% 18.0% 18.0% 18.0% 18.0% 18.0% 18.0% WACC 5.02% 5.05% 4.98% 4.89% 4.79% 4.68% 4.57%
According to European Union website, the corporate tax rate of Luxembourg, the Spotify fiscal address, is 18%.
Cost of Equity (rE)
The cost of equity is the return required by shareholders in order to invest in a company. In this equity research, the cost of equity was estimated using the CAPM as followed:
𝑟𝐸= 𝑟𝑓+ 𝛽 ∗ (𝑀𝑅𝑃 − 𝑟𝑓)
2020F 2021F 2022F 2023F 2024F 2025F Terminal
Cost of Equity 7.24% 7.38% 7.05% 6.63% 6.22% 5.84% 5.48%
Risk free rate -0.62% -0.62% -0.62% -0.62% -0.62% -0.62% -0.62%
Levered Beta 1.46 1.48 1.42 1.34 1.27 1.20 1.13
Market Risk Premium - USA 5.40% 5.40% 5.40% 5.40% 5.40% 5.40% 5.40%
23
The risk free rate (rf) considered is a AAA rated bond collected from the ECB.
Levered beta was collected from Damodaran: Entertainment industry levered beta wa 1.33 in 2019. Thereafter, it was computed through the formula below:
𝛽𝐿= 𝛽𝑈∗ [1 +
𝐷
𝐸∗ (1 − 𝑇)]
The market risk premium was collected from Pablo Fernandez paper Market Risk Premium and Risk-Free Rate used for 59 countries in2018: a survey. Note that it was considered the MRP of USA because Spotify is listed in New York Stock Exchange. Cost of Debt (rD)
The cost of debt refers to the effective rate a company pays on its current debt. It was calculated using the credit spread method with formula below:
𝑟𝑑= 𝑟𝑓+ 𝐷𝑒𝑓𝑎𝑢𝑙𝑡 𝑆𝑝𝑟𝑒𝑎𝑑𝐶𝑜𝑢𝑛𝑡𝑟𝑦+ 𝐷𝑒𝑓𝑎𝑢𝑙𝑡 𝑆𝑝𝑟𝑒𝑎𝑑𝐶𝑜𝑚𝑝𝑎𝑛𝑦
2020F 2021F 2022F 2023F 2024F 2025F Terminal
Cost of Debt 4.38% 4.38% 4.38% 4.38% 4.38% 4.38% 4.38%
Risk free rate -0.62% -0.62% -0.62% -0.62% -0.62% -0.62% -0.62%
Country Default Spread 0.0% 0.0% 0.0% 0.0% 0.0% 0.0% 0.0%
Credit Risk Spread 5.00% 5.00% 5.00% 5.00% 5.00% 5.00% 5.00%
Country Default Spread
According to Damodaran table (updated in January of 2019) regarding country default spread, Sweden presents a CDS of 0.0%.
Credit Risk Spread
Spotify convertible notes interest rate were 5.0%, which was assumed to be the credit risk spread.
Terminal Value
The long run growth rate of revenues was assumed to 3%. The rationale behind this assumption lays on two considerations. First, the long run inflation for Europe is 2%. Second, it was added 1% because Spotify has the leading technology in the music streaming market which represents an important competitive advantage. On the paper Economic Growth and Equity Investing, Bradford Cornell attributes 1% to the impact of technological advances on economic growth. Additionally, concludes that a long run growth rate of 3% is unlikely in developed countries, however, since Spotify is investing on emerging economies, the company has an additional margin to grow.
Subscription Based Companies (SBC) valuation model
As mentioned before, Spotify provides its service on a subscription basis, ensuring a stable cash flow at low distribution costs.
According to the SBC Model, the target price for Spotify in 2020YE is USD174.43, corresponding to an upward of 31.2% comparing to the share price in 02-28-2019 ($133). Therefore, Spotify share price is undervalued and is recommend to BUY. The valuation period considered is 6 years and does not include the terminal period. As DCF model, the calculations were performed in EUR and were converted to USD at an exchange rate of 1.10388.
24
This valuation model has three components:
𝑆𝐵𝐶 𝑣𝑎𝑙𝑢𝑎𝑡𝑖𝑜𝑛 = 𝑁𝑒𝑤 𝑐𝑢𝑠𝑡𝑜𝑚𝑒𝑟𝑠 ∗ 𝐴𝑣𝑔 𝑐𝑢𝑠𝑡𝑜𝑚𝑒𝑟 𝑑𝑢𝑟𝑎𝑡𝑖𝑜𝑛 ∗ 𝐺𝑟𝑜𝑠𝑠 𝑀𝑎𝑟𝑔𝑖𝑛 𝑝𝑒𝑟 𝑢𝑠𝑒𝑟
New Customers acquired between 2025F and 2018;
The average customer duration, which is given by 1/ Churn rate;
Gross margin per user is given by the total gross margin divided by the number of customers in 2025F.
The table below summarizes the data used to perform the model calculations. To be noted that the discount factor used is the same used in DCF model, meaning that considers a WACC rate of 4.57% for 2025F.
SBC Valuation Model
New customers (between 2025 and 2018) 87.4
Customers in 2018 125.9
Customers in 2025F 213.3
Average customer duration 21.80
Gross Margin per user 18.86
Enterprise Value in 2025F 35,928.06
Discount factor 0.80
Enterprise Value in 2020F 28,578.26
Number of shares outstanding 180.9
Price Target EUR 158.02
Exchange rate EUR/USD (08-30-2019) 1.10388
Price Target USD 174.43
Stock price on 12-31-2018 133.00
% Variation 31.2%
Market Multiples Approach
Before entering into the market multiples approach, is key to consider the following notes. In streaming music market there is no pure comparable to Spotify. On one hand, other only audio streaming companies are much smaller companies compared to Spotify and have different business models (e.g. Pandora). On the other hand, the larger Spotify rivals use audio streaming as a secondary business (e.g. Apple, Google and Amazon), which become impossible to segment properly. Additionally, those companies present different strategies and structures, hindering a comparison to Spotify.
Moreover, we forecast negative values for Spotify EBIT, EBITDA and Earnings in 2019, which results in a negative enterprise value for those multiples. For this reason, the multiple considered was enterprise value to sales.
The peer group was collected from Reuters website and gathers the following companies: Netflix, Facebook, Alphabet and Uber. The enterprise to sales multiple for this peer group is 7.0, as the table below summarizes.
25
Peers EV (USDbn) Sales (USDbn) EV/Sales
Netflix 125.0 15.8 7.9
Facebook 522.9 55.8 9.4
Alphabet 844.1 136.8 6.2
Uber 52.9 11.3 4.7
Average - - 7.0
Source: Yahoo Finance website, data refers to 2018YE
Applying the multiple to Spotify sales of 2018YE, we obtained an enterprise value of USD37bn or a price per share of USD204.59, meaning an upside potential of 53.8%. In conclusion, the market multiples approach states that Spotify stock price undervalued, however in much larger scale than DCF and SBC models.
26
07. Financial Analysis
Business growth and profitability
Fast growth has pressured Spotify operating margins. Fig. 32 shows the EBITDA to Revenues ratio evolution. After the improvements until 2018YE, the ratio declines again due to the expected investment in exclusive podcast creation, becoming positive after 2021.
Despite margin deterioration, it is expected that Spotify continues to invest in growth and scale, because it is a great enabler for margin expansion. As mentioned before in Spotify business model, scale allows Spotify to collect more data and to know more about its customers, which allows a more personalize service, improving the user experience, which attracts and retain customers.
According to Barry McCarthy in Spotify investor’s day, a premium subscriber becomes profitable 12 months after subscription (Fig. 33). This insight shows two issues. First, is key to invest in R&D to increase retention and reduce churn rate through a better user experience, supported by machine learning and artificial intelligence. Second, Spotify is losing money when a new subscriber join the premium segment, which is causing the recent negative results. Hence, the entrance in new markets and the investment in R&D to drive faster growth is a clear investment in margin expansion and profitability in future years.
Fig. 33: Profitability per user (Source: Spotify investor’s day March 2018)
In order to evaluate if the business model is working, Spotify uses the LTV to SAC ratio (Lifetime Value of a Subscriber to Subscriber Acquisition Cost ratio). As long as this ratio is higher than 1, Spotify is increasing its enterprise value by adding one more subscriber, even though the company loses money immediately after he joins the service. Fig. 34 shows a highly positive evolution of LTV to SAC ratio. Below are presented the formulas used to calculate the LTV and the SAC:
𝐿𝑇𝑉 =𝐴𝑅𝑃𝑈 − 𝐺𝑟𝑜𝑠𝑠 𝑀𝑎𝑟𝑔𝑖𝑛 𝑝𝑒𝑟 𝑆𝑢𝑏𝑠𝑐𝑟𝑖𝑏𝑒𝑟 𝐶ℎ𝑢𝑟𝑛 𝑟𝑎𝑡𝑒 𝑆𝐴𝐶 =𝐺𝑟𝑜𝑠𝑠 𝑀𝑎𝑟𝑔𝑖𝑛 + 𝑆&𝑀 𝑒𝑥𝑝𝑒𝑛𝑠𝑒𝑠 + 𝐺&𝐴 𝑒𝑥𝑝𝑒𝑛𝑠𝑒𝑠 𝑁𝑢𝑚𝑏𝑒𝑟 𝑜𝑓 𝑠𝑢𝑏𝑠𝑐𝑟𝑖𝑏𝑒𝑟𝑠 -9,3% -0,8% -1,4%-0,4% 0,5%1,3%2,1% 2,8%3,5% 2017Y E 2018Y E 2019F 2020F 2021F 2022F 2023F 2024F 2025F Fig 32: EBITDA/Rev (source:
Spotify and author)
25,7%26,6% 27,4%28,3% 29,1%30,0% 30,8%31,7% 20,0% 25,0% 30,0% 35,0% 0 2.000 4.000 6.000 8.000 10.000 12.000 2018Y E 2019F 2020F 2021F 2022F 2023F 2024F 2025F Fig 35: Gross Margin (source:
Spotify and author)
Revenues COGS Gross margin (%) 3,4 3,6 3,9 4,0 4,1 4,1 4,2 4,4
Fig 34: LTV/ SAC (source: Spotify and author)