Repositório ISCTE-IUL
Deposited in Repositório ISCTE-IUL: 2018-12-05Deposited version: Post-print
Peer-review status of attached file: Peer-reviewed
Citation for published item:
Gonçalves, F., Pereira, R., Ferreira, J., Vasconcelos, J. B., Melo, F. & Velez, I. (2019). Predictive analysis in healthcare: emergency wait time prediction. In 9th International Symposium on Ambient Intelligence, ISAmI 2018. (pp. 138-145). Toledo: Springer.
Further information on publisher's website: 10.1007/978-3-030-01746-0_16
Publisher's copyright statement:
This is the peer reviewed version of the following article: Gonçalves, F., Pereira, R., Ferreira, J., Vasconcelos, J. B., Melo, F. & Velez, I. (2019). Predictive analysis in healthcare: emergency wait time prediction. In 9th International Symposium on Ambient Intelligence, ISAmI 2018. (pp. 138-145). Toledo: Springer., which has been published in final form at https://dx.doi.org/10.1007/978-3-030-01746-0_16. This article may be used for non-commercial purposes in accordance with the
Publisher's Terms and Conditions for self-archiving.
Use policy
Creative Commons CC BY 4.0
The full-text may be used and/or reproduced, and given to third parties in any format or medium, without prior permission or charge, for personal research or study, educational, or not-for-profit purposes provided that:
• a full bibliographic reference is made to the original source • a link is made to the metadata record in the Repository • the full-text is not changed in any way
The full-text must not be sold in any format or medium without the formal permission of the copyright holders.
Serviços de Informação e Documentação, Instituto Universitário de Lisboa (ISCTE-IUL) Av. das Forças Armadas, Edifício II, 1649-026 Lisboa Portugal
Phone: +(351) 217 903 024 | e-mail: [email protected] https://repositorio.iscte-iul.pt
EMERGENCY WAIT TIME PREDICTION
Filipe Gonçalves1, Ruben Pereira1, João Ferreira1, José Braga Vasconcelos2,3,Fer-nando Melo4, Iria Velez4
1 Instituto Universitário de Lisboa (ISCTE-IUL), ISTAR-IUL, Portugal 2 Universidade Europeia, Laureate International Universities, Portugal. 3 Centro de Administração e Politicas Publicas (CAPP) da Universidade de Lisboa
4 Hospital Garcia da Horta
{fsgsa,rfspa,jcafa}@iscte-iul.pt, [email protected],
{fmelo,iria.velez}@hgo.min-saude.pt
Abstract. Emergency departments are an important area of a hospital, being the
major entry point to the healthcare system. One of the most important issues re-garding patient experience are the emergency department waiting times. In order to help hospitals improving their patient experience, the authors will perform a study where the Random Forest algorithm will be applied to predict emergency department waiting times. Using data from a Portuguese hospital from 2013 to 2017, the authors discretized the emergency waiting time in 5 different catego-ries: “Really Low”, “Low”, “Average”, “High”, “Really High”. Plus, the authors considered as waiting time, the time from triage to observation. The authors ex-pect to correctly evaluate the proposed classification algorithm efficiency and accuracy in order to be able to conclude if it is valuable when trying to predict ED waiting times.
Keywords: Healthcare; Big data; Predictive analytics, Emergency Department
1
Introduction
Emergency departments (ED) are an important and complex area of a hospital and are the major entry point to the healthcare system [1]. With the increase of life expectancy, population aging and bigger amount of health issues, ED tend to have greater demand [2]. If hospitals and more specifically, ED, are not ready, this will increase emergencies crowding, creating a big problem to authorities and hospital management since re-sources are limited. According to the American College of Emergency Physicians (ACEP) “Crowding occurs when the identified need for emergency services exceeds resources for patient care in the emergency department, hospital or both” [3]. Lack of beds, patients in hallways, greater amount of people in the waiting rooms, longer wait-ing times, greater patient length of stay and general patient dissatisfaction are some of the consequences of this phenomenon. It is an international problem and it is vital for hospitals [3] to solve it due to the life-threatening context of the area.
2
ED wait times are the second most referred theme regarding patient experience [4] which indicates that this area requires intervention to increase care quality and resource efficiency to achieve greater patient satisfaction. That can be achieved using Predictive Analytics (PA) which has the potential to improve the operational flexibility and throughput quality of ED services [5]. Waiting time prediction would help clinicians prioritize patients and adjust work flow to minimize time spent [6]. Predictive Analytics allows to predict future events or trends using retrospective and current data [7]. It could be applied in several healthcare areas, taking advantage of the big data in healthcare. According to [8], predictive analytics is a tactic that healthcare organizations should adopt, allowing the stratification of risk to predict outcomes, that in healthcare can be harmful to the patients. Other advantages would be the adoption of more sensor based technologies that would help patients to be more aware about their health, provide life-style suggestions by determining some diseases that he could suffer if he kept the same lifestyle [9], help the management of high risk and high cost patients during hospital care and after discharge follow-up care [8], etc.
In this research, the authors applied Predictive analytics grounded on data collected from a real ED and studied the performance of the Random Forest algorithm to predict patient waiting time.
2
Related work
The authors started by searching about big data in healthcare and predictive analytics applications in healthcare industry. Later, the authors focused on ED waiting time, to understand the variables that can have the most influence on the patient waiting time, plus the used algorithms.
Regarding predictive analytics in the healthcare industry, some authors studied its advantages and possible applications, like M. M. Malik et al [10] that reviewed and analyzed applications of predictive analytics and data mining in the healthcare industry or R. Chauhan and R. Jangade [9] that claim that predictive analytics in healthcare can be beneficial as it would allow for patient disease prediction, fraud detection and cost management initiatives.
Another author that defends predictive analytics importance in the healthcare indus-try is G. Palem [11], defending that predictive analytics can be helpful on various areas of the healthcare industry like “life-sciences, healthcare providers, insurance providers, public health, individuals”. A. T. Janke et al. [5] also defend that predictive systems can be beneficial to the ED. They studied big data and predictive analytics implemen-tation challenges and opportunities and how it could improve the ED patient flow.
The aforementioned models are defined by C. Kaul et al. [12], that defined predictive models as models that “concentrate upon analyzing a set of relevant data and predict a future implication or a meaningful pattern”, analyzing how they can be applied in healthcare, for example, providing alerts about disease outbreaks. They have studied healthcare data stating that 80% of it is unstructured and difficult to analyze.
Some of the authors also analyzed the advantages of predictive analytics but focus-ing on some specific areas. One of those cases is D. W. Bates [8] that provided some
use cases of predictive analytics application on high risk and cost patient management, defining predictive systems as “software tools that allow the stratification of risk to predict an outcome”, defending that, in the future, healthcare organizations will use predictive analytics.
Focusing on ED waiting times, M. Barad et al. [3] studied the ED of an Israeli hos-pital in order to find the reasons for ED crowding. Started by conducting interviews with the clinicians and analyzed the communication between departments. In the re-search, they used the American College of Emergency Physicians definition of ED crowding, “Crowding occurs when the identified need for emergency services exceeds resources for patient care in the emergency department, hospital or both”.
Some authors focused on predicting the ED waiting times, like E. Bruballa et al. [2] that created an agent based simulation to study the patient length of stay, considering it as a major problem for the healthcare system worldwide. They also defend that the existence of information or a recommendation system showing emergency department state information would help avoiding long waiting times in the services.
M. Chong et al. [13] developed a system dynamic model to study the patient flow in the emergency department of a hospital in Hong Kong. They concluded that by increas-ing staff and the amount of beds, the time spent by patients in the ED could be reduced.
Others studied the ED waiting times, using machine learning techniques, like quan-tile regression, Q-Lasso or expectation maximization.
Y. Sun et al. [6] were some of the authors that used quantile regression to develop a model to predict emergency department waiting time, based on triage information. Did not use the predicted mean waiting time since it is affected by possible outliers, instead, predicted “a range of the 50th percentile to the 95th percentile”. They defined waiting time as the “interval from triage end time to the physician’s consultation time”, and considered that the patient flow rates of other acuity levels could impact on other levels since clinicians could move between queues. This developed model ignored patient characteristics which could be a limitation. Other authors that used quantile regression were R. Ding et al. [14] that created a system to predict length of stay in ED. They claim that “providing patients with an expected LoS at triage may result in increased patient satisfaction”. They considered three phases for the length of stay: waiting time, treatment time and boarding time, and used “acuity level, arrival day and time, arrival mode, chief complaint and patient characteristics.” as variables.
Q-Lasso was used by E. Ang et al. [15] to predict ED waiting time, using data from four different hospitals from the United states of America. They defined Q-Lasso as an algorithm that is a combination of the “queueing theory and the lasso method, that uses a penalty to correct estimation errors”.
3
Work Methodology
The work methodology can be divided in three different processes: Data Collection, where the dataset and the correspondent ED is described and analyzed, Data
Pre-Pro-4
cessing, which is the process the data is manipulated towards the waiting time predic-tion and finally, Data-Mining, where the Random Forest algorithm is applied to the previously processed data in order to predict the ED waiting time.
3.1 Data Collection
In this process, the authors describe the data used in this research, that was provided by an ED of a Portuguese hospital and includes registers from January 1 of 2013 to De-cember 31 of 2017. Before the data was provided to the authors of this research, infor-mation that could identify the patient, doctor or nurse of each record was anonymized due to privacy regulations.
This hospital’s ED flow has five main processes: Admission, Triage, Observation, Discharge and Administrative Discharge (Fig 1). The first step occurs when the patient is admitted to the ED, then, in the second process is when the patient is submitted to testing, being categorized according to the Manchester Triage Protocol (MTP) (Table 1). The third step corresponds to the observation, where the patient will be observed by a doctor and treated. The last two steps of this ED flow are correlated, the discharge occurs when a doctor, after evaluating the patient, considers that he is ready to be moved to another hospital, department or even to go home, and finally, the administrative dis-charge, occurs when all the documentation necessary for the patient to leave is approved and the patient leaves the ED.
As aforementioned, this ED is compliant with the MTP, a protocol for hospital triage system, that defines the advisable time limit patients must wait to be treated. Following this, all patients are categorized on five different triage colors: “red”, “orange”, “yel-low”, “green” and “blue”, from the most urgent to the least urgent respectively. In this ED, there is also another category called “others” for the other cases, where the patient doesn’t follow the usual triage system. In this ED, most of the patients are either in green, yellow or “others” categories and on 50% of the cases, the advisable time was exceeded.
Fig. 1. ED flow, in a five strae process Table 1. Manchester Triage Protocol standards
Class Treatment Target Time (minutes)
Red Immediate 0
Orange Very urgent 10
Yellow Urgent 60
Green Standard 120
Blue Non-urgent 240
The ED is divided in three departments: general department (GD), pediatric depart-ment (PD) and obstetrics departdepart-ment (OD).
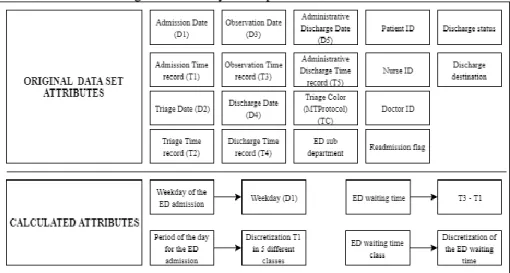
In those four years of records, 672720 patients attended the ED on that hospital. Each record on this dataset contains 20 attributes represented on Fig. 2 with the respective
acronyms. The first 10 are the dates and times for each step of the previously mentioned ED flow, so the date (dd/mm/yyyy) and time (hh:mm:ss) for the admission (D1 and T1 respectively), the triage (D2 and T2 respectively), observation (D3 and T3 respec-tively), discharge (D4 and T4 respectively) and administrative discharge (D5 and T5 respectively). Other attributes are the patient triage color according to the MTP (defined as TC in Fig.2), ED sub-department (DEP in Fig.2), discharge status, discharge desti-nation, readmission flag and an anonymized patient id, doctor id and nurse id.
Fig. 2. Attributes used in this research
3.2 Data Pre-Processing Process
In this process, the authors manipulated the data to analyze it and apply the Random Forest algorithm in order to predict the ED waiting time (section 3.3).
The authors started by removing the attributes that would not be needed according to the goals of the project, like patient, doctor and nurse ids and readmission flag. Rec-ords with null values were also removed, resulting in a cut of 5.1% of the original data.
Then, the authors calculated the weekday where the event took place, based on the admission date (D1 as described in Fig. 2), using the weekday function from excel.
Another important step was to discretize the hour of the day where the event took place, based on the admission time (T1). The authors created six different day periods: 21-3h, 3-7h, 7-12h, 12-15h, 15-19h and 19-21h and then aggregated the events based on those intervals. This allowed to ease the analytical process.
Another calculated attribute was the waiting time. The authors defined patient wait-ing time as the time from admission to observation (T3 – T1 from Fig.2). As expected, the minimum time is 00:00:00h, since the MTP defines that patients classified with red color category should be attended immediately. The maximum waiting time was 9:50:55h and it corresponds to a patient that was has with the green color, while the average waiting time was 00:56:02h.
6
Then, this calculated time was discretized on five different custom waiting time cat-egories: “really low”, “low”, “average”, “high”, “really high”. This process of discreti-zation started with the calculation of the total average waiting time, that was used as reference in order to categorize all the time events. The events that fit the first 20% of the average waiting time (00:00:00 to 00:11:12) were categorized as “really low”. Then, for the second category (“low”) the author categorized the events between 20% and 70% of the average (from 00:11:12 to 00:50:26). For the “average” category, the author used the 20% around the average waiting time, 10 % under and 10% above (00:50:26 to 1:01:38). For the next category, “high”, added 70% of the average waiting time to the average waiting time (01:01:38 to 1:40:51). Finally, the last category, “really high”, was based on the maximum waiting time, since all the events had to be covered. This discretization process is described on Fig. 1. These discretization processes were made using Microsoft Excel 2016.
Fig. 3. ED Waiting time classification
The “Low” category is the category where there are more occurrences on every depart-ment. As expected, on the pediatric department, most of the patients have short waiting times, around 81% of the entries are either “low” or “really low” category. On the other hand, the obstetric department also has a lot of entries with the “low” category (41%), but it is the department where the patients have to wait the most since the “high”, and the “really high” categories represent 46% of the entries.
In terms of triage color, as expected, the most urgent colors have smaller waiting times, for example, on red, which is the most urgent color, 94% of the entries fit into the “low” or “really low” categories. For the blue triage color, the non-urgent cases, 61% of the entries fit on the higher waiting times categories, “high” and “really high” categories.
About the time periods, the “Low” category is the category with more occurrences of every period. During the night periods, 21-3h and 3-7h, there is an increase of the “really high” category events, reaching 25% of the occurrences on the 3-7h period.
The “low” category is also the category with more occurrences on all of the days of the week. During the whole week, the “high” and “really high” categories have more events than the “average” and “really low” categories. On Sundays, there is a clear increase of “really high” category events, covering 28% of all the occurrences.
3.3 The Data Mining Process
The goal was to analyze the waiting times in the ED and to do so, the authors applied Random Forest (RF), using R in R-Studio. The library “rminer” was used to compute
evaluation metrics like accuracy, precision, true positive rates and F1. The varimp func-tion from R was used to analyze the input variables importance.
The Random Forest algorithm builds several decision trees and calculates the mean or majority class for all decision trees. Random Forests are better than decision trees because it will help avoiding overfit by creating smaller subsets of trees, while the de-cision tree algorithm has a unique dede-cision tree, making it denser and deeper, which might cause overfitting.
This algorithm achieved an accuracy of 50.09% (see table 2 for full results). The classes that had more events, “Really low” and “low”, were the ones with better preci-sion. In general, all the classes had low true positive rate except for the “low” category. Since the category “really low” has a good precision, but low true positive rate, we can assume that this low true positive rate is being caused by a big number of false nega-tives, because true positive rate or recall is the number of true positives divided by the sum of true positives and false negatives. The “average” category was expected to per-form the worst since it is the category with the smallest number of events (6.08%). Analyzing the input variables importance, triage color stands as the most important for the desired prediction, reaching an overall of 317, followed by weekday (176.8), day period (161.4) and department (151.8).
Table 2. Random forest results with total average waiting time Class Precision True positive rate F1-score Really Low 66.67 1.34 2.62 Low 51.97 88.72 65.55 Average 50 0.34 0.68 High 28.16 4.23 7.36 Really high 43.60 33.29 37.75
4
Conclusion
The authors conclude that the success of the RF on predicting ED wait times is highly dependent on the amount of available data and how it is discretized. This can be proven by the fact that the categories with the highest number of events have better precision, while the ones with less events have lower precision. Discretizing some of the fields with different methods, like equal areas, should also be explored, since all the possible classes of a certain input, would have the same amount of events, which would avoid having some classes with a low number of events, that as mentioned before can cause low precision results.
Complementing the data with other variables could also improve the predictive ca-pability. For example, it could be useful to add weather information like temperature, precipitation rate or humidity, since those factors can have impact on the ED adherence. Other algorithms like Naïve Bayes or Neural Networks could also be applied, allow-ing to compare the algorithms efficiency and possibly gettallow-ing better results.
8
References
1. Z. Liu, D. Rexachs, E. Luque, F. Epelde, and E. Cabrera, “Simulating the micro-level behavior of emergency department for macro-level features prediction,” in 2015 Winter Simulation Conference (WSC), 2015, vol. 2016–Febru, pp. 171–182.
2. E. Bruballa, A. Wong, F. Epelde, D. Rexachs, and E. Luque, “A model to predict length of stay in a hospital emergency department and enable planning for non-critical patients admission,” Int. J. Integr. Care, vol. 16, no. 6, pp. 1–2, 2016.
3. M. Barad, T. Hadas, R. A. Yarom, and H. Weisman, “Emergency department crowding,” in 19th IEEE International Conference on Emerging Technologies and Factory Automation, ETFA 2014, 2014.
4. J. D. Sonis, E. L. Aaronson, R. Y. Lee, L. L. Philpotts, and B. A. White, “Emergency Department Patient Experience,” J. Patient Exp., p. 237437351773135, Sep. 2017. 5. A. T. Janke, D. L. Overbeek, K. E. Kocher, and P. D. Levy, “Exploring the Potential of
Predictive Analytics and Big Data in Emergency Care,” Ann. Emerg. Med., vol. 67, no. 2, pp. 227–236, Feb. 2016.
6. Y. Sun, K. L. Teow, B. H. Heng, C. K. Ooi, and S. Y. Tay, “Real-time prediction of waiting time in the emergency department, using quantile regression,” Ann. Emerg. Med., vol. 60, no. 3, pp. 299–308, Sep. 2012.
7. I. D. Dinov, “Methodological challenges and analytic opportunities for modeling and interpreting Big Healthcare Data,” Gigascience, vol. 5, no. 1, p. 12, Dec. 2016.
8. D. W. Bates, S. Saria, L. Ohno-Machado, A. Shah, and G. Escobar, “Big data in health care: Using analytics to identify and manage high-risk and high-cost patients,” Health Aff., vol. 33, no. 7, pp. 1123–1131, 2014.
9. R. Chauhan and R. Jangade, “A robust model for big healthcare data analytics,” in 2016 6th International Conference - Cloud System and Big Data Engineering (Confluence), 2016, pp. 221–225.
10. M. M. Malik, S. Abdallah, and M. Ala’raj, “Data mining and predictive analytics applications for the delivery of healthcare services: a systematic literature review,” Ann. Oper. Res., pp. 1–26, Dec. 2016.
11. G. Palem, “The Practice of Predictive Analytics in Healthcare,” no. July 2013.
12. C. Kaul, A. Kaul, and S. Verma, “Comparitive study on healthcare prediction systems using big data,” in 2015 International Conference on Innovations in Information, Embedded and Communication Systems (ICIIECS), 2015, pp. 1–7.
13. M. Chong et al., “Patient Flow Evaluation with System Dynamic Model in an Emergency Department: Data Analytics on Daily Hospital Records,” in Proceedings - 2015 IEEE International Congress on Big Data, BigData Congress 2015, 2015, pp. 320–323. 14. R. Ding, M. L. McCarthy, J. Lee, J. S. Desmond, S. L. Zeger, and D. Aronsky, “Predicting
Emergency Department Length of Stay Using Quantile Regression,” in 2009 International Conference on Management and Service Science, 2009, vol. 45, no. 2, pp. 1–4.
15. E. Ang, S. Kwasnick, M. Bayati, E. L. Plambeck, and M. Aratow, “Accurate Emergency Department Wait Time Prediction,” Manuf. Serv. Oper. Manag., vol. 18, no. 1, pp. 141– 156, Feb. 2016.