REM WORKING PAPER SERIES
Capital Account Liberalization and the Composition of Bank Liabilities
Luís A. V. Catão, Daniel Marcel te Kaat
REM Working Paper 053-2018
October 2018
REM – Research in Economics and Mathematics
Rua Miguel Lúpi 20,1249-078 Lisboa, Portugal
ISSN 2184-108X
Any opinions expressed are those of the authors and not those of REM. Short, up to two paragraphs can be cited provided that full credit is given to the authors.
Capital Account Liberalization and the
Composition of Bank Liabilities
∗
Luís A.V. Catão
†Daniel Marcel te Kaat
‡October 2018
Abstract
Using a sample of almost 600 banks in Latin America, we show that capital account liberalization lowers the share of equity and raises the share of interbank funding in total liabilities of the consolidated banking system. These shifts are mostly due to large banks; smaller banks, instead, increase their resort to retail funding by offering higher average de-posit interest rates than larger banks. We also find significant differences in the behavior of foreign banks and of banks with seemingly greater information opacity. These findings have positive implications for macro-prudential regulation.
Keywords: External Financial Liberalization, International Capital Flows, Bank Funding and Leverage
JEL classification: F32, F36, G21
∗We thank Peter Bednarek, Qianying Chen, Stijn Claessens, Valeriya Dinger, Galina Hale, Alexander Mayer, Ugo Panizza, Alexander Popov, Claudio Raddatz, Christian Upper, Frank Westermann and Joachim Wilde, as well as conference participants at the BIS, at the Workshop on Banking and Institutions (Bank of Finland), at the University of Osnabrück, at the University of Bonn and at the Kiel Institute for the World Economy for valuable comments. We also thank Gian Maria Milesi-Ferretti for providing us with the data on cross-border bank flows.
†Lisbon School of Economics and Management (ISEG), Research in Economics and Mathematics (REM) and Research Unit on Complexity and Economics (UECE), University of Lisbon, Rua do Quel-has 6, 1200-781 Lisboa, Portugal. Email: [email protected]
‡University of Osnabrück, School of Economics and Business Administration, Rolandstr. 8, 49069 Osnabrück, Germany. Email: [email protected]
1
Introduction
Lower controls on a country’s capital account can increase the conditional probability of macro-financial crises by facilitating the accumulation of foreign liabilities (Reinhart and Rogoff, 2008; Gourinchas and Obstfeld, 2012; Catão and Milesi-Ferretti, 2014).1 In ex-amining the channels through which large capital inflows raise crisis risk, various papers have looked at the role of bank lending to the private sector and the government—flows that lie squarely on the asset side of banks’ balance sheets (Popov and Udell, 2012; Jordà et al., 2013; Taylor, 2015; Ongena et al., 2015; Correa et al., 2015; Dinger and te Kaat, 2016; Hoffmann and Stewen, 2016; Temesvary et al., 2018; Morais et al., forthcoming). Little attention is given to banks’ funding structures and how they respond to surges in foreign capital flows. An exception is Bruno and Shin (2015a, 2015b), who show that higher (lower) borrowing by multinational banks from US dollar-denominated wholesale funding markets raise (lower) leverage and lending by local banks during periods of low (high) global interest rates. Their empirical analysis, however, does not look at the role of capital control regulations and focuses on international capital flows across consolidated banking systems employing macro-level data. Thus, they do not examine how changes in capital controls and/or in global liquidity affect the liability structures of distinct tiers of the local banking system, nor how those effects vary with main bank-specific features (e.g., size, foreign ownership and the opaqueness of balance sheets), which are clearly relevant for systemic risk assessment and hence for prudential regulation.
Scarce analysis of the relationship between capital controls and the composition of bank liabilities is also apparent in three other strands of the empirical literature on macro-financial linkages. One strand is that comprised by a handful of studies on the determi-nants of banks’ funding decisions in general, which gloss over how such decisions are affected by international capital controls (Song and Thakor, 2007; Berger and Bouwman, 2009; Dinger and von Hagen, 2009; Hahm et al., 2013; Craig and Dinger, 2014). Another strand comprises numerous works on the effects of capital account liberalization/capital controls on the real economy (Henry, 2003; Voth, 2003; Henry, 2007; Kose et al., 2009; Levchenko et al., 2009; Larrain and Stumpner, 2017), and on the relationship between
ex-1In this paper, the capital account encompasses what the IMF in its Balance of Payments and Interna-tional Investment Position Manual (sixth edition) calls financial account.
ternal financial openness and financial sector outcomes (Daniel and Jones, 2007; Baskaya et al., 2017; Martinez-Miera and Repullo, 2017), none of which zoom in on shifts in the liability composition of banks following capital account liberalization. Finally, there are studies relating capital account liberalization and the funding ratios of non-financial cor-porates in emerging market economies which, by design, exclude bank data (Agca et al., 2007; Lucey and Zhang, 2011).
This paper aims to fill some of this gap in the literature. From a theoretical perspec-tive, capital account liberalization is likely to affect the composition of banks’ liabilities by changing the relative costs of the different types of funding and by facilitating foreign investors to take positions in domestic banks. One might expect that resort to cheaper for-eign borrowing may crowd-out resort to domestic borrowing (and most notably domestic retail deposits) and that greater access to equity financing from abroad may change in-centives to build capital buffers. No less importantly perhaps, the type of investor and his information set may matter even more. In particular, to the extent that information on the domestic bank is more costly or simply unavailable to the foreign investor and that the latter becomes a bigger player in funding markets, the degree of asymmetric information between banks and their investors rises. Such a rise in asymmetric information lowers the cost of funding sources that are less sensitive to information asymmetries, such as short-term debt, relative to long-term debt and equity (Myers and Majluf, 1984). Indeed, evidence from the behavior of broad stock price indices and bond spreads following ma-jor capital account liberalizations is consistent with this conjecture (Stulz, 1999; Bekaert and Harvey, 2000), as is the evidence that short-term debt flows are the dominant type of cross-border capital flows to emerging market economies (e.g., Henry, 2007; Kose et al., 2009).2 From the point of view of the foreign investor’s supply of funds, it should also be expected that banks that are foreign-owned, larger, and with less opaque balance sheets (as proxied for instance by the share of non-performing loans in their portfolio) should experience a stronger push factor relative to others. Overall, there are thus good reasons to expect significant effects on the liability structure of banks.
Employing bank-level data from Latin America over the 1995-2013 period, this
pa-2Studies in non-bank corporate finance also find empirical support for a shift towards short-term debt due to informational frictions that change the relative costs of funding (Stohs and Mauer, 1996; Johnson, 2015).
per examines the evidence and above hypotheses regarding possible connections between capital controls and changes in the funding structures of banks. Latin America is particu-larly suitable for this investigation because extensive liberalization in external capital ac-counts was far-reaching and displayed considerable cross-country heterogeneity through the 1990s and 2000s, aiding identification of its effects on banks’ funding structures using panel data. At the same time, restricting the sample to a single region like Latin America helps filter out the effect of potentially powerful region-specific factors emphasized in Cerutti et al. (2015), which would call for more evolved and (arguably) less consensual model restrictions to help identification of regional factors.
We investigate balance sheet effects by breaking down bank liabilities into equity, re-tail deposits, interbank loans, other short-term debt, bonds and non-interest liabilities, all expressed as ratios over total assets. In light of a distinguished literature on the role of foreign interest rates on capital inflows and financial fragility build-ups in emerging mar-kets, we also partition our sample into capital account liberalization spells during low vs. high global interest rates. Cross-sectionally, we also partition the sample between smaller and larger banks, foreign-owned and domestic banks and those that have seemingly more and less opaque balance sheets—at the same time, we control for other macroeconomic and regulatory influences throughout. To conduct this exercise, a main contribution of this paper lies in a novel data set matching bank-level data from Bureau van Dijk’s Bankscope database for 17 Latin American countries (covering 81% of total bank assets reported in the International Financial Statistics) with the new country-level index of financial open-ness by Fernández et al. (2016) and a host of other macroeconomic controls. Unlike pre-vious indices of capital controls, the Fernández et al. (2016) index distinguishes between regulatory controls on capital inflows vs. capital outflows. This distinction is important as the task at hand is to evaluate the effects of regulatory changes in capital controls on actual external borrowing by domestic banks and the composition of such borrowing.
Our findings are as follows. At the macro-level, we document that a capital account liberalization event, defined as a one-standard deviation (henceforth sd) or higher increase in a country’s de-jure capital account openness index, is associated with lower capital-to-asset ratios and increases in banks’ interbank liabilities. All other liability side variables are mostly unaffected. Regarding causality, we not only provide evidence on the
exo-geneity of capital account liberalization episodes with respect to banks’ funding behav-ior, but also argue that—even if the exogeneity of external financial liberalization were unwarranted—the micro panel heterogeneity of our data corroborates the econometric identification of causal effects. On this basis, we obtain that, in the short-run, a one-sd increase in capital account openness is associated with 0.31 pp reductions in banks’ eq-uity ratios and 0.38 pp higher interbank funding ratios. The respective long-run effects are 1.1 pp (for capital-to-asset ratios) and 2.6 pp (for interbank liabilities). The economic significance of these results has been fleshed out in previous work: according to the ECB (2015), for instance, a one-pp decrease in the Tier 1 capital ratios raises the odds ratio (the probability of distress relative to non-distress) by 35-39% (see also Altunbas et al., 2014). We show further that the significance of these effects is dominated by periods of high real domestic money market interest rate spreads relative to the world’s main financial center—the US. Specifically, the documented shifts in the liability composition of banks are largely a preserve of capital account liberalization measures enacted during periods of low US interest rates. Important results also arise from the interaction of capital account openness with (i) banks’ total assets (to capture that the information availability to outside investors is increasing in bank size); (ii) a foreign ownership dummy (foreign ownership reduces the informational frictions between global investors and banks); and (iii) the ratio of impaired loans relative to equity (banks with lower credit risks typically have a less opaque balance sheet). It turns out that larger, foreign-owned and informationally less opaque banks raise their interbank liabilities and lower their capital-to-asset ratios dispro-portionately more. While the latter possibly reflects their higher regulatory margins to reduce capital ratios, it also appears to reflect wider access to cheaper interbank funding, leading to a substitution of less risky funding (capital) with higher risk funding (interbank borrowing). The result on the greater importance of larger banks in heightening aggre-gate financial risk is broadly in line with the findings of Baskaya et al. (2017), who show that higher credit growth in Turkey is mostly driven by bursts of foreign capital inflows channeled through larger banks, responding to a supply-side capital push external to the country. In contrast, smaller banks increase their reliance on retail deposits in the wake of capital account liberalizations. This seems to reflect lower deposit interest rate offered by larger banks as they can more easily tap external financing sources, leading to the
migra-tion of deposits to smaller banks. Thus, changes in capital controls produce shifts in the liability structures and funding risk across distinct tiers of the domestic banking system.
The remainder of this paper is structured as follows. Section 2 describes the insti-tutional setting and trends in capital account liberalization in Latin America. Section 3 presents the data set and summary statistics and Section 4 the main stylized macro facts. Section 5 lays out the econometric methodology and reports our baseline results. In Section 6, we test whether our baseline results are amplified by less opaque banks. The effects on smaller banks are investigated in Section 7. Section 8 performs various robustness checks. Section 9 concludes the paper.
2
Background Facts
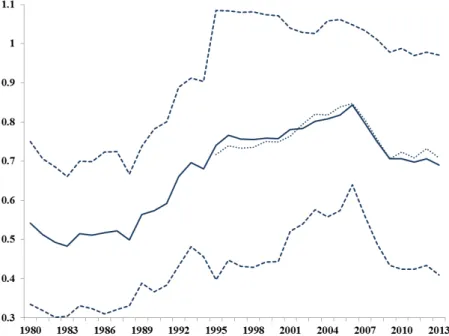
Figure 1 displays the average degree of capital account openness over the period of 1980-2013, and the corresponding one-sd bands around the mean.
Figure 1: The blue solid line displays the average degree of capital account openness (proxied by the overall Schindler index from Fernández et al., 2016) in Latin America over the 1980-2013 period, using the Quinn (1997) index to extrapolate it backwards until 1980. The dashed lines are the corresponding one-sd bands around the mean. The dotted line depicts the inflow-only component of the Schindler index.
The reduction in capital controls in Latin America trended up between the early 1990s through 2007, and has been partly reversed since the onset of the global financial crisis. The wide standard deviation bands also indicate that there is significant cross-country variation in external financial openness. This contrasts with the experience of other emerging market regions of Asia and Central and Eastern Europe, where the cross-country variation was about one-half lower.3
In much of the region, the trend towards greater external financial liberalization has been motivated by a less pressing need to generate external trade surpluses to repay exter-nal debt in the wake of debt write-offs and debt settlement with foreign creditors, which started re-pulling capital back in from the early 1990s. In countries with IMF programs, those were an additional prodding force. Another determinant was a global trend towards external financial liberalization, which started in advanced countries—notably, the US and the UK—earlier in the 1980s. Furthermore, as argued by Brooks (2004), the political orientation of the incumbent government appears to have been a significant determinant of the decision for capital account liberalization. This encompasses the case of Mexico, where some domestic political consensus was finally forged by the newly formed tech-nocratic government to advance with the country’s membership into NAFTA. Since the freedom of capital movements was an important requirement of that trade treaty, the deci-sion to join NAFTA was instrumental to the disbanding of the stringent system of capital controls. Elsewhere in the region, other idiosyncratic elements also played a role. This was the case in Brazil in the early 1990s when, under the liberal orientation of presi-dent Collor de Mello, trade and capital flows were liberalized as a political response to the inefficiency of domestic monopolies, aiming to grant nationals wider access to lower cost/higher quality imported goods and broader opportunities to allocate their savings.4
These considerations suggest that capital account restrictions are exogenous to macroe-conomic covariates, such as the domestic business cycle and the capital inflow cycle in different countries. These considerations are also consistent with econometric tests pre-sented in Fernández et al. (2015) supporting the hypothesis that capital controls have been strikingly a-cyclical in the broad cross-country panel that they examine. Accordingly, it
3For further break-downs of the index by region, sub-indices and sub-periods, see Fernández et al. (2016).
is also reasonable to assume that capital control decisions are mainly exogenous to bank-ing sector behavior, greatly aidbank-ing the econometric identification of the effects of external financial liberalization on banks’ funding decisions. Furthermore, even if this were not the case, the identification strategy underlying our regression analysis, by hinging on the heterogeneity of banks at the micro-level, would ensure the robustness of our results to possible biases arising from the (remaining) endogeneity of capital control regulations to banking sector indicators (see Section 5.1 for further discussion).
3
Data
3.1
Bank-Level Data
Our annual bank-level data spans the 1995-2013 period and the following 17 Latin Amer-ican countries: Argentina, Bolivia, Brazil, Chile, Colombia, Costa Rica, DominAmer-ican Re-public, Ecuador, El Salvador, Guatemala, Mexico, Nicaragua, Panama,5 Paraguay, Peru, Uruguay and Venezuela.6
The variables are constructed from information provided in Bureau van Dijk’s Bankscope database. We mostly include unconsolidated balance sheet data (i.e., Bankscope codes U1 and U2) because consolidated statements might be affected by foreign subsidiaries.7 Af-ter some data cleaning with regard to mergers and implausible observations (e.g., negative equity or liabilities), we obtain a sample of 8,293 bank-year observations.8
Table 1: The Distribution of Banks in our Sample over Time
1995 2000 2005 2010 2013
number of banks 123 463 399 589 569
Table 1 presents the number of financial institutions over time. Bankscope coverage is lower for the 1990s relative to the 2000s, which results in a lower number of banks in our
5Excluding Panama—which serves as a financial center—does not affect our estimates.
6Three Latin American countries (Cuba, Honduras and Puerto Rico) are not covered because of missing data on their degree of external financial openness. We start our sample period in 1995 because both our bank-level data and the measure of capital account openness (the de-jure index of Fernández et al., 2016) are not available before.
7When banks only report consolidated statements, we include these in our regressions.
8We lose 686 observations because of the merger correction. Moreover, 474 implausible observations are dropped.
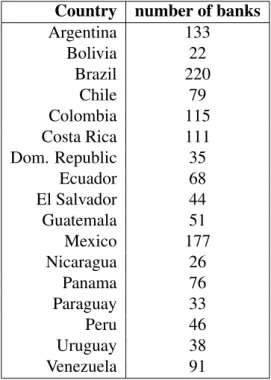
Table 2: The Distribution of Banks in our Sample across Countries Country number of banks
Argentina 133 Bolivia 22 Brazil 220 Chile 79 Colombia 115 Costa Rica 111 Dom. Republic 35 Ecuador 68 El Salvador 44 Guatemala 51 Mexico 177 Nicaragua 26 Panama 76 Paraguay 33 Peru 46 Uruguay 38 Venezuela 91
data set for 1995-1999. As we will show in the sensitivity analysis presented in Section 8, we obtain qualitatively similar results for time sub-periods with a relatively constant number of banks. Further, Table 2 shows that most banks in our sample are located in the three largest economies of Latin America—Argentina, Brazil and Mexico.
We use this rich bank-level data set to break down bank liabilities into equity (CAPITAL), retail deposits (DEPOSIT S), interbank funding (INT ERBANK), other short-term debt (OT HER SHORT − T ERM DEBT ),9 bonds (BONDS)10 and non-interest bearing liabil-ities (NON − INT EREST FU NDS), all expressed as ratios relative to total assets.
Our bank-level data set further contains various explanatory variables that are likely to affect banks’ funding structures. These include bank size (SIZE), defined as the log-arithm of total assets, the ratio of impaired loans less reserves for impaired loans as a proxy for bank risk (RISK) and the share of non-interest income over gross revenues (NONINT EREST INCOME).
9This variable includes all short-term liabilities that are not interbank loans or retail deposits. For in-stance, it includes money market funds and corporate deposits.
10This variable basically includes all traded liabilities. However, long-term bonds with a share of 92% in all traded liabilities, are by far the most critical component.
3.2
Macroeconomic Data
Our main regressor is the degree of capital account openness, proxied by the Schindler inflow index (Fernández et al., 2016). It is a new de-jure index of external financial liber-alization, measuring the strength of capital controls imposed by national authorities based on the IMF’s Annual Reports on Exchange Arrangements and Exchange Restrictions. The index is calculated from 1995 to 2013 as the average of ten disaggregated inflow re-strictions on single asset categories and takes the values between zero (fully liberalized) and one. In our model, LIBERALIZAT ION is calculated as (1-Schindler inflow index) because—due to this transformation—higher values represent external financial liberal-ization, facilitating the interpretation of our results. There are two key advantages of this index. First, it is a de-jure measure of international financial integration. This is benefi-cial relative to de-facto measures (such as capital flows) because the de-jure measure is predominantly determined at the aggregate policy level and is arguably more exogenous to banks’ funding structures. Second, the index by Fernández et al. (2016) reports the openness of capital in- and outflows separately. For the analysis of this paper, focusing on inflow restrictions is beneficial because inflows of foreign capital are likely to be more important than capital outflows in affecting the dynamics of banks’ funding structures.
Apart from the external financial liberalization measure, we also merge different macroe-conomic variables to our bank-level data. Following Dinger and von Hagen (2009) and Gropp and Heider (2010), we expand our data set by real PPP adjusted per capita GDP (PERCAPITAGDP), the percent change in the consumer price index to control for the high inflation rates in many Latin American countries (INFLAT ION) and the real GDP growth rate (GROW T H). We further include the VIX as an additional covariate because it has been shown to be a good proxy for the international supply of capital, especially so in emerging market regions (e.g., Baskaya et al., 2017). Our macroeconomic data set also includes the unemployment rate, stock market volatility, the rule of law, the regulatory reserve and capital requirements and sovereign debt. Yet, as these variables turned out to be statistically insignificant in most of the regressions, we exclude them from the set of macro controls in the regression specifications reported in the remainder of this paper.11
11The insignificance of capital requirements is consistent with earlier research of Gropp and Heider (2010), who show that capital regulation only has a second order importance in determining banks’ capital
Table A.1 (Appendix) provides further specifics of the data.
3.3
Summary Statistics
Table 3 summarizes the main descriptive statistics of the bank-level and macroeconomic variables in our model. The median bank has a capital-to-asset ratio of 12%, a deposit share of almost 59% and an interbank ratio of about 5%. These numbers show that, compared with advanced economies, banks in emerging markets fund a higher proportion of their balance sheet with equity and customer deposits, while interbank funding has a lower importance.12 In addition, other short-term debt has a median share of 4.6%, bonds of 3.6%, and non-interest funding of 3.3%.13
Turning to the other bank-level variables, Table 3 shows that the arithmetic mean of the variable RISK (defined as impaired loans less loan loss reserves over total equity) is equal to 5.1%, implying that, for the average Latin American bank, impaired loans exceed reserves for loan losses. There are also several banks with significant amounts of impaired loans, outstripping 27% of their equity (90th percentile). Further, the low median ratio of non-interest income (25.93%) points to the fact that banks’ business models in Latin America are focused on financial intermediation, so that interest income is the main source of revenue. The share of non-interest income over gross revenues in advanced economies is significantly higher and equal to 40% (e.g., DeYoung and Rice, 2004).
Our main regressor, capital account openness, has a median value of 0.80. Thus, the average bank operates in a country which is externally relatively open. Yet, as pointed out before, the cross-country variation in this variable is far-reaching, including countries that are fully shielded from foreign capital (LIBERALIZAT ION=0) and countries which are fully open (LIBERALIZAT ION=1).
The values for per capita GDP in our sample vary substantially with a 10th percentile of 5,350 USD and a 90th percentile of 17,160 USD. The median inflation rate equals 5.79%. Non-trivial inflation stresses the great importance of controlling for changes in price levels, as they are likely to affect our estimates. Finally, the average real GDP
structures.
12In the euro area, for instance, the average share of customer deposits is equal to 30-40%, wholesale funding has a share of 20-30% and capital ratios are equal to about 6-8% (ECB, 2016).
growth rate is equal to almost 4% and the VIX takes a median value of 22.55%. Table 3: Summary Statistics
Obs. Unit 10th Median Mean 90th SD CAPITAL 8278 % 6.64 11.98 17.57 34.51 16.49 DEPOSITS 7638 % 8.94 58.68 52.16 81.64 26.04 INTERBANK 6677 % 0 4.75 11.17 31.73 15.49 OTHER SHORT-TERM DEBT 6239 % 0 4.59 11.40 33.58 15.85 BONDS 7107 % 0 3.61 10.25 29.50 16.00 NON-INTEREST FUNDS 8259 % 0.57 3.33 6.08 13.51 9.18 SIZE 8278 ln(x) 3.49 6.12 6.18 8.94 2.10 RISK 8278 % -13.85 -0.39 5.10 27.58 30.98 NONINTERESTINCOME 8200 % 2.09 25.89 30.34 66.71 37.06 LIBERALIZATION 8278 - 0.2 0.80 0.68 1.00 0.32 PERCAPITAGDP 8278 - 5.35 11.39 11.27 17.16 4.29 INFLATION 8275 % 2.27 5.79 8.51 16.21 9.65 GROWTH 8278 % -0.61 3.92 3.72 8.22 3.65 VIX 8278 % 12.81 22.55 21.64 31.48 5.99
The first six variables (the dependent variables employed in our analysis) are the bank-level shares of capital, retail deposits, interbank loans, other short-term debt, bonds, and non-interest funds in total assets. The three bank controls added to all regressions are bank size (log of total assets), the share of impaired loans in equity and non-interest income over gross revenues. The macro covariates are the Schindler capital account inflows index, as well as per capita GDP, the inflation rate, real GDP growth and the VIX.
4
Funding Dynamics: Macro Evidence
This section presents the macro-level dynamics of banks’ funding structures around cap-ital account liberalization events, defined as at least a one-sd increase (and no less than a 10-basis points change) in a country’s de-jure capital account openness index by Fer-nández et al. (2016).14 We obtain the aggregate banking sector variables by summing up
14For symmetry reasons, we also examined the macro-level dynamics of banks’ funding structures around capital account de-liberalization events. We do not plot them both because they may not be as representative since there are only five de-liberalization events (where the year-to-year increase in capital controls was no less than one standard deviation) and because these events were concentrated around the global financial crisis of 2008-09. While a symmetric time profile holds for interbank funding (i.e., during de-liberalizations, resort to interbank funding falls), we do not observe the symmetric rise in equity ratios, likely because equity market conditions sharply deteriorated during and in the immediate aftermath of the crisis, making it more expensive for banks to issue equity to fill in for limited interbank borrowing. This is no concern in our multivariate regressions, which control for these effects via the VIX and other macro controls that capture the crisis role in the dynamics of equity ratios.
the bank-level observations (from the Bankscope database) for every country and year. This procedure is justified by the fact that Bankscope data for Latin America is highly representative of the entire banking system. The aggregate total assets from Bankscope cover between 67% (Uruguay) and 100% (Panama) of the total assets provided in the International Financial Statistics (with an average coverage of 81%).
Figure 2: Figure 2 depicts the annual dynamics of the banking sectors’ equity-to-assets ratio, deposits-to-assets ratio, interbank loans-to-assets ratio, other short-term debt-to-assets ratio, bonds-to-debt-to-assets ratio and non-interest funding-to-debt-to-assets ratio around external financial liberalization events, defined as at least a one-sd increase in a country’s capital account openness index by Fernández et al. (2016). The vertical lines display the year of the external financial liberalization event.
interna-tional financial liberalization leads to (i) a one-pp decrease in capital ratios from 10.5%-11% to 9.5%-10%; and (ii) an increase in banks’ shares of interbank funding from 4% to 6%-8%.15 The ratios of retail deposits, in contrast, are unaffected by capital account liberalization, as are the other liability side variables (bonds, other short-term debt and non-interest funding), which exhibit a clear downward trend that is not altered by the events.
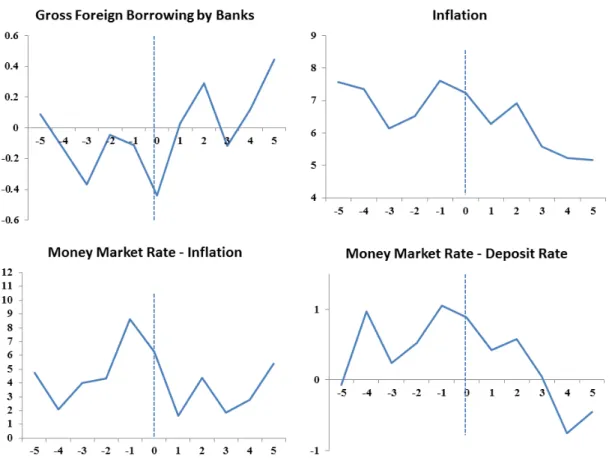
Figure 3: Figure 3 depicts the annual dynamics of gross banking sector capital inflows over GDP, the inflation rate, the real money market rate and the spread between money market and deposit interest rates around external financial liberalization events, defined as a at least one-sd increase in a country’s capital account openness index by Fernández et al. (2016). The vertical lines display the year of the external financial liberalization event.
The rise in interbank borrowing relative to other sources of funds, and particularly to domestic deposits, in turn raises the question on the composition of interbank funding. While Bankscope data does not allow breaking down interbank funding by domestic and
15As interbank funding can be very volatile, in order to reduce the impact of outliers, we drop observa-tions where the interbank ratio has changed by more than 100% (but at least 5 percentage points) from one year to the other. The general dynamics are unaffected by this correction.
foreign sources, there are indications that much of the interbank funding is fed by foreign borrowing—either in the form of borrowing from related offshore banks or by a rise in domestic interbank market liquidity due to capital inflows. This conjecture is corroborated by the northwest panel of Figure 3, which shows that gross foreign borrowing by banks typically trend up in the wake of capital account liberalization. Declining inflation and lower real money market interest rate are also likely contributors to greater buoyancy in the interbank market, in turn reflecting higher capital inflows. No less importantly, the decline in the money market-deposit interest spread in the wake of external financial liberalization is bound to incentivize banks to substitute interbank funding for deposits, consistent with waning importance of the latter relative to the former once controls on capital inflows are loosed.16
In what follows, we build on this prima facie evidence by examining these associa-tions at the micro-level. Apart from aiding econometric identification, the main advantage of the micro-level dimension of our data set is that of shedding new light on the effects across different types of banks, including large vs. small, domestic vs. foreign-owned and those with opaque vs. less opaque balance sheets. This breakdown by banks’ character-istics is clearly important for better understanding of the channels through which capital account liberalization affects systemic fragility and, hence, for the design of prudential regulations.
5
Funding Dynamics: Micro Evidence
5.1
Econometric Specification
We examine the relationship between changes in capital account regulations and banks’ funding structures using the following model:
FU NDINGi jt= αi+ γ ∗ FUNDINGi, j,t−1+ β ∗ LIBERALIZAT IONjt+ θ ∗ Xi jt+ εi jt (1)
16As the spread between money market and deposit rates can be very volatile, in order to reduce the impact of outliers, we drop observations where it has changed by more than 100% (but at least 5 percentage points) from one year to the other. The general dynamics are unaffected by this correction.
The dependent variables in equation (1) are the shares of capital, retail deposits, inter-bank funding, other short-term debt, bonds or non-interest liabilities over total assets of bank i in country j at time t. As is apparent from Figure 2, the aggregate behavior of these variables is suggestive of non-trivial autocorrelation. It therefore seems important to include the lagged dependent variables on the right hand side of equation (1) to help capture the time-series dynamics of banks’ funding structures.17 The coefficient αi is an
individual bank intercept and the vector X includes the bank-level and macroeconomic controls listed in Table 3. The main coefficient of interest in the following analysis is β , which measures the short-run impact of external financial liberalization on banks’ funding ratios. The long-run effects are given by 1−γβ .
OLS yields inconsistent estimates in the presence of individual bank-specific effects. If we simply replace pooled OLS with fixed effects regressions, the estimates may also be non-trivially biased by the presence of the lagged dependent variable once the panel’s time series dimension is not too large (Nickel, 1981). To overcome these issues, we es-timate the equation with the Blundell-Bond system GMM estimator (Blundell and Bond, 1998),18which uses both the variable levels as instruments for the equation in first differ-ences and, additionally, first differdiffer-ences of the variables as instruments for the variables in levels. The existing literature on the determinants of firms’ liability structures shows that the Blundell-Bond estimator is superior to the Arellano-Bond estimator (Arellano and Bond, 1991), in particular because of the high persistence of the dependent variables (e.g., Faulkender et al., 2012; Flannery and Hankins, 2013).
We instrument the regressors with five lags of their levels and first differences, re-spectively.19 Restricting the number of instruments is important because they increase quadratically in T and, therefore, can become very large, overfitting endogenous vari-ables (Roodman, 2009b). The standard errors are corrected by the procedure proposed by Windmeijer (2005). This procedure addresses the potential downward bias of the standard errors that arises when using a large number of instruments in a regression. Its application makes our t-statistics more conservative, leading to more reliable inference.
The regressions are weighted by banks’ total assets. This is important in order to
17This is standard, among others, in Faulkender et al. (2012).
18We rely on the xtabond2 command in Stata (Roodman, 2009a) to estimate these regressions. 19The results are robust to other lag specifications.
adjust our estimates for the oversampling of small banks, which are less of a concern from a financial stability/systemic risk perspective. In addition, it aligns the micro-level results with the previous evidence on aggregate bank funding dynamics—large banks also play a greater role in the aggregate amounts of bank funding.
Following the discussion of Section 2, we treat capital account openness as broadly exogenous to domestic macroeconomic covariates. Yet, as an added insurance to the risk that our results might be contaminated by some endogeneity bias arising from the ability of the banking sector to affect capital account regulations (e.g., via political lobbying), we further corroborate the causal interpretation of our results by estimating the above equa-tion with the Blundell-Bond estimator, but instrumenting the degree of capital account openness with a government’s partisanship indicator and an IMF program dummy, both of which are exogenous to external financial liberalization and likely to be significant drivers of the latter (Section 8).
In addition, even if capital account openness were to be endogenous at the macro-level or at the level of the consolidated banking system, our identification also relies on the het-erogeneity of banks at the micro-level, as some of our empirical tests explore the differ-ences across banks based on an interaction between a country and a bank characteristic. Thus, even if omitted variables at the country-level correlate with LIBERALIZAT ION, inter-bank differences in the sensitivity with respect to external financial liberalization should not be affected. Examining the cross-bank sensitivity to capital account regula-tions also allows us to improve the understanding of how international financial liberal-ization transmits to changes in banks’ funding ratios—an advantage relative to studies relying purely on macro-level data.
5.2
Baseline Results
As is apparent from Table 4, capital account openness is associated with reductions in banks’ capital ratios and higher ratios of interbank funding. Retail deposits, other short-term debt, bonds and non-interest liabilities, in contrast, are not affected significantly by external financial liberalization. This micro-level evidence is consistent with the aggre-gate bank funding dynamics established in Section 4.
In economic terms, an increase in the external financial liberalization index by one standard deviation (about 0.32 in our sample) reduces the capital-to-asset ratios on im-pact by 0.31 pp. The long-run effect is equal to 1.1 pp, as can be gauged by dividing the coefficient of LIBERALIZAT ION by (1-autoregressive coefficient). This is an eco-nomically significant effect since earlier research finds even smaller reductions in banks’ equity ratios to increase the probability of bank distress significantly. For instance, the ECB (2015) finds that a one-pp increase in the Tier 1 capital ratios reduces the odds ratio (that is, the probability of distress relative to non-distress) by 35-39% (see also Altunbas et al., 2014). Turning to the economic significance of interbank borrowing, Table 4 in-dicates that a one-sd increase in external financial liberalization raises banks’ interbank loans by 0.38 pp in the short-run; the long-run effect is equal to 2.6 pp.
Banks’ funding structures are also affected significantly by the set of bank-level con-trols. In particular, larger banks have lower equity ratios and less retail deposits. Risky banks and banks with lower non-interest income are also characterized by lower equity ratios. These results are consistent with earlier findings by Gropp and Heider (2010) or George (2015), among others.
From the macroeconomic covariates, especially inflation rate differences affect banks’ funding structures: a high inflation rate tends to lower banks’ capital ratios and to raise the shares of retail deposits (which are typically of shorter maturities). Higher global uncertainty (higher VIX) is also associated with lower capital-to-asset ratios. Overall, in line with Gropp and Heider (2010), we find most other macroeconomic factors to be insignificantly associated with changes in bank funding structures.
T able 4: Baseline Results (1) (2) (3) (4) (5) (6) CAPIT AL DEPOSITS INTERB ANK O THER SHOR T -TERM DEBT BONDS NON-INTEREST FUNDS CAPIT AL (t-1) 0.712 ∗∗∗ (27.69) DEPOSITS (t-1) 0.933 ∗∗∗ (71.28) INTERB ANK (t-1) 0.855 ∗∗∗ (32.35) O THER SHOR T -TERM DEBT (t-1) 0.775 ∗∗∗ (18.15) BONDS (t-1) 0.924 ∗∗∗ (39.16) NON-INTEREST FUNDS (t-1) 0.755 ∗∗∗ (15.07) LIBERALIZA TION -0.969 ∗∗∗ 0.701 1.198 ∗∗ 0.246 -0.401 0.643 (-3.30) (1.09) (2.31) (0.33) (-0.36) (0.95) SIZE -0.386 ∗∗∗ -0.761 ∗∗∗ 0.074 -0.256 0.637 0.404 ∗∗ (-4.35) (-3.64) (0.60) (-0.90) (1.63) (2.56) RISK -0.014 ∗∗∗ -0.008 0.005 0.035 0.000 0.003 (-3.53) (-0.45) (0.53) (1.48) (0.03) (0.43) NONINTERESTINCOME 0.015 ∗∗∗ 0.049 ∗∗∗ -0.007 -0.009 -0.006 0.000 (4.75) (3.89) (-1.29) (-1.25) (-0.28) (0.02) PER CAPIT A GDP -0.007 -0.005 -0.115 ∗∗∗ -0.075 -0.001 -0.069 ∗ (-0.30) (-0.09) (-2.87) (-0.87) (-0.01) (-1.68) INFLA TION -0.043 ∗∗∗ 0.138 ∗∗∗ 0.003 -0.058 ∗∗∗ 0.018 -0.011 (-3.65) (5.21) (0.28) (-3.11) (0.38) (-0.71) GR O WTH -0.037 0.038 0.032 -0.050 0.173 0.033 (-0.74) (0.46) (0.51) (-0.82) (1.48) (0.62) VIX -0.044 ∗∗∗ 0.002 -0.017 -0.010 0.186 ∗∗ -0.073 ∗∗ (-3.18) (0.04) (-0.39) (-0.34) (2.26) (-2.57) Obs 6877 6370 5383 4918 5694 6854 p (Hansen statistic) 0.160 0.348 0.650 0.902 0.291 0.296 The re gressions are based on annual bank-le v el data o v er the period 1995-2013. The dependent v ariables are the shares of capital, retail deposits, interbank funding, other short-term debt, bonds and non-interest liabilities o v er total assets. The main re gressor is the de gree of capital account openness, proxied by the capital inflo w inde x of Fernández et al. (2016). W e further add se v eral bank-le v el (the log arithm of total assets, the ratio of impaired loans and non-interest income in gross re v enue) and macro (per capita GDP , inflation, GDP gro wth and the VIX) controls. The re gressions are weighted by banks’ total assets and estimated with the Blundell-Bond estimator , using fi v e lags of the v ariables as instruments. W e correct the standard errors by the procedure of W indmeijer (2005). The t-statistics are sho wn in parentheses and p (Hansen statistic) pro vides the p v alues for the Hansen test of o v eridentification restrictions. ∗p < 0 .10 , ∗∗ p < 0 .05 , ∗∗∗ p < 0 .01
In columns (1)-(6), the lagged dependent variables are highly statistically significant with a coefficient between 0.71 (for equity ratios) and 0.93 (for retail deposits). Therefore, retail deposits are more sticky (have higher autocorrelation) than other types of funding (especially capital and other short-term debt). These estimates further imply an adjust-ment speed (1-autoregressive coefficient) of 7%-29%. An adjustadjust-ment speed of about 30% for banks’ capital-to-asset ratios is consistent with that obtained by Faulkender et al. (2012) and suggests that bank capital ratios adjust quickly.
In summary, the results of Section 5.2 suggest that external financial liberalization only affects banks’ equity and interbank ratios significantly. In the remainder of this paper, we will therefore expand on this result and focus on the capital-to-asset ratio and interbank funding as the dependent variables. We further include the share of retail deposits in all of the following regressions because of its overwhelming weight on banks’ balance sheets (with a median value of almost 59% in total assets). The results for the other variables are readily available upon request.
5.3
Controlling for the On- vs. Off-Shore Interest Spread
We have previously shown that capital account openness leads to more interbank funding and less equity. This result is consistent with the notion that, in the wake of external finan-cial integration, short-term debt flows are the dominant form of cross-border capital flows to emerging economies (e.g., Henry, 2007; Kose et al., 2009). Foreign investors, how-ever, should provide disproportionately more short-term funding (i.e., interbank loans) to banks in emerging market regions the lower is the world interest rate. In this sub-section, we therefore expand the baseline analysis by testing whether external financial openness affects the funding structures of banks disproportionately more during periods of high real domestic money market interest rate spreads relative to the world’s main financial center—the US. Since money market rates are mainly driven by the stance of monetary policy, the following analysis also allows us to analyze the interaction of capital account liberalization and monetary policy.
T able 5: Controlling for the Spread between Domestic and F oreign Interest Rates lower domestic inter est spr ead higher domestic inter est spr ead (1) (2) (3) (4) (5) (6) CAPIT AL DEPOSITS INTERB ANK CAPIT AL DEPOSITS INTERB ANK CAPIT AL (t-1) 0.676 ∗∗∗ 0.747 ∗∗∗ (74.43) (19.14) DEPOSITS (t-1) 0.780 ∗∗∗ 0.945 ∗∗∗ (26.38) (74.75) INTERB ANK (t-1) 0.748 ∗∗∗ 0.867 ∗∗∗ (11.30) (33.27) LIBERALIZA TION -0.722 ∗∗ 1.069 0.271 -1.303 ∗∗∗ 0.347 1.432 ∗∗ (-2.09) (1.07) (0.15) (-2.79) (0.36) (2.01) Bank Controls Y es Y es Y es Y es Y es Y es Macro Controls Y es Y es Y es Y es Y es Y es Obs 2617 2426 2030 2758 2508 2359 These re gressions are based on annual bank-le v el data o v er the period 1995-2013. The dependent v ariables are the shares of equity , retail deposits and interbank loans o v er total assets. The main re gressor is the de gree of capital account openness, measured by the capital inflo w inde x of Fernández et al. (2016). W e also add se v eral bank-le v el (the log arithm of total assets, the ratios of impaired loans and non-interest income o v er gross re v enue) and macro (per capita GDP , inflation, GDP gro wth and the VIX) controls. In the first three columns, we restrict the sample to episodes with a lo w domestic real mone y mark et rate relati v e to the US. Columns (4)-(6) restrict the sample to higher interest rate episodes. All the re gressions are weighted by banks’ total assets and estimated via the Blundell-Bond estimator , using fi v e lags of the v ariables as instruments. W e correct the standard errors by the procedure proposed in W indmeijer (2005). The t-statistics are sho wn in parentheses. ∗p < 0 .10 , ∗∗ p < 0 .05 , ∗∗∗ p < 0 .01
To this end, the following analysis splits the sample into episodes in which the real domestic money market rate relative to the US is in the upper half of the distribution and those in which it is in the lower half.20
The attendant results are in line with our hypothesis, indicating that LIBERALIZAT ION has economically and statistically more significant effects during episodes of high do-mestic money market spreads (columns (4)-(6)). Economically, a one-sd increase in LIBERALIZAT ION during these episodes raises the interbank funding ratios by 0.46 pp in the short-run and by 3.4 pp in the long-run. The reduction in banks’ equity ratios is equal to 0.42 pp on impact (1.6 pp in the long-run). These effects are 20%-40% larger than our baseline estimates.
In a nutshell, we document that the effects of external financial liberalization on banks’ funding structures are influenced by the stance of monetary policy at home and abroad. When money market rates in international financial centers relative to emerging market economies are low, capital account liberalizations in the latter are associated with a dis-proportionate decrease in equity and higher interbank funding. These results therefore add to the findings of recent work on the cross-border spill-overs of US monetary pol-icy (Cetorelli and Goldberg, 2011, 2012; Bruno and Shin, 2015a; Ioannidou et al., 2015; Miranda-Agrippino and Rey, 2015; Baskaya et al. 2017; Cerutti et al., 2017; Buch et al., 2018), highlighting also a significant link between monetary policy in the US and the liability composition of banks in peripheral economies.
6
Are the Results Driven by Informationally Less Opaque
Banks?
Following capital account liberalization, foreign investors mainly provide short-term debt funding, rather than equity, to borrowers in emerging markets (e.g., Henry, 2007; Kose et al., 2009). This result is attributed to asymmetric information between both parties. Due to such information asymmetries, the extant literature on the capital structures of non-financial corporates further shows that international/distant lenders prefer borrowers with rich information available to outside stakeholders (e.g., Lucey and Zhang, 2011). In
Section 6, we test whether this evidence on firms also applies to banks, i.e., whether cap-ital account openness also benefits informationally less opaque banks disproportionately more. As these tests explore the differences across banks based on an interaction be-tween a country (capital account openness) and a bank characteristic, the corresponding estimates are less sensitive to the underlying rationale for external financial liberaliza-tion, thus strengthening the causal interpretation of our coefficients. For instance, even if unobservable macroeconomic variables correlate with LIBERALIZAT ION, inter-bank differences in the sensitivity with respect to external financial liberalization should not be affected.
As many empirical studies use size as a proxy for information availability, our first test explores the nexus between external financial integration and funding ratios con-ditional on bank size. If international investors tend to prefer lending to information-ally less opaque banks, we should find a stronger effect of LIBERALIZAT ION on the funding structures of large banks. For the identification of this hypothesis, we enable LIBERALIZAT ION to interact with banks’ total assets. As our regressions are already weighted by banks’ total assets, this test basically examines whether, within the weighted sample of large banks, the largest financial institutions are affected most significantly by capital account liberalization. Attendant results, shown in columns (1)-(3) of Table 6, are consistent with the aforementioned evidence on firms, indicating that especially the shares of equity and interbank funding of the largest banks are affected by capital account liberalization. The difference between smaller and the largest banks with respect to their sensitivity to external financial integration is not only statistically significant, but also economically important: a one-sd increase in LIBERALIZAT ION raises the shares of in-terbank loans of the median bank on impact by 0.08 pp; the same effect for the largest banks at the 99th percentile of the distribution of total assets is equal to 0.35 pp. As a consequence, the long-run effect for the largest banks is also more than four times larger than the corresponding effect for the median bank (2.7 pp vs. 0.6 pp). In addition, the largest 1% of banks also have 0.9 pp lower long-run equity ratios than the median bank when the capital account index increases by one standard deviation.
T able 6: Are the Results Dri v en by Informationally Less Opaque Banks? (1) (2) (3) (4) (5) (6) (7) (8) (9) CAPIT AL DEPOSITS INTERB ANK CAPIT AL DEPOSITS INTERB ANK CAPIT AL DEPOSITS INTERB ANK CAPIT AL (t-1) 0.731 ∗∗∗ 0.708 ∗∗∗ 0.714 ∗∗∗ (24.55) (33.41) (27.29) DEPOSITS (t-1) 0.938 ∗∗∗ 0.937 ∗∗∗ 0.934 ∗∗∗ (65.19) (75.63) (74.02) INTERB ANK (t-1) 0.869 ∗∗∗ 0.852 ∗∗∗ 0.852 ∗∗∗ (34.95) (30.58) (32.91) LIBERALIZA TION -0.305 1.087 0.256 -0.655 ∗ 1.410 ∗ 0.810 -1.036 ∗∗∗ 0.831 1.300 ∗∗ (-1.02) (0.98) (0.59) (-1.70) (1.82) (1.19) (-3.49) (1.53) (2.48) LIBERALIZA TION × T O T AL ASSETS -0.014 ∗∗∗ 0.001 0.015 ∗∗ (-5.22) (0.12) (2.12) LIBERALIZA TION × FOREIGN -1.716 ∗ -2.862 ∗ 1.352 (-1.91) (-1.78) (0.99) LIBERALIZA TION × RISK 0.019 ∗ -0.004 -0.046 ∗∗ (1.68) (-0.08) (-2.18) T O T AL ASSETS 0.002 0.001 -0.002 (1.52) (0.14) (-0.68) FOREIGN 1.248 ∗∗ 0.028 -0.567 (2.25) (0.03) (-1.09) RISK -0.025 ∗∗∗ -0.004 0.032 ∗∗ (-2.76) (-0.09) (2.37) Bank Controls Y es Y es Y es Y es Y es Y es Y es Y es Y es Macro Controls Y es Y es Y es Y es Y es Y es Y es Y es Y es Obs 6877 6370 5383 6515 6053 5124 6877 6370 5383 These re gressions are based on annual bank-le v el data o v er the period 1995-2013. The dependent v ariables are the shares of equity , retail deposits and interbank loans o v er total assets. The main re gressor is the de gree of capital account openness, proxied by the capital inflo w inde x of Fernández et al. (2016), interacted with banks’ total assets, a foreign o wnership dummy and the impaired loans ratios, respecti v ely . W e also add se v eral bank-le v el (the log arithm of total assets, the ratio of impaired loans and non-interest income o v er gross re v enue) and macro (per capita GDP , inflation, GDP gro wth and the VIX) co v ariates. The re gressions are weighted by banks’ total assets and estimated with the Blundell-Bond estimator , using fi v e lags of the v ariables as instruments. W e correct the standar d errors by the procedure proposed in W ind-meijer (2005). The t-statistics are sho wn in parentheses. ∗p < 0 .10 , ∗∗ p < 0 .05 , ∗∗∗ p < 0 .01
Thus, capital account liberalization and the improved access to foreign funding mainly affects the largest banks—a result broadly consistent with Baskaya et al. (2017), who find the impact of capital flows into emerging markets (Turkey) on credit growth to increase with banks’ total assets.
In the next set of tests, we corroborate the role of asymmetric information across banks by examining whether the effects of LIBERALIZAT ION are amplified in foreign-owned banks, assuming that foreign ownership reduces the informational frictions be-tween global investors and banks. For this analysis, we define foreign-owned banks as banks whose equity is to at least 50% owned by a foreign institution, using the own-ership data provided in Claessens and van Horen (2014).21 Columns (4)-(6) document that the effect of LIBERALIZAT ION is indeed conditional on banks being foreign or domestically-owned, revealed by the significant interaction term between LIBERALIZAT ION and FOREIGN for two of the three dependent variables. In particular, external financial liberalization especially reduces the equity ratios of foreign-owned banks. In addition, column (5) documents that domestic banks have higher shares of retail funding in the wake of capital account openness (the LIBERALIZAT ION coefficient is positive and sig-nificant at the 10% level); foreign-owned banks, in contrast, have less retail funding.22
The previous two exercises suggest that foreign investors overproportionally take po-sitions in Latin American banks with a lower degree of asymmetric information—large and foreign-owned banks. Following this evidence, we finally allow the external financial liberalization index to interact with the ratio of impaired loans relative to equity, a fre-quently used measure for the opaqueness of bank balance sheets.23 We hypothesize that a more opaque balance sheet also increases the information asymmetries between domes-tic banks and international investors, thus reducing the effects of LIBERALIZAT ION on banks’ funding structures. Columns (7)-(9) support this hypothesis: whereas the short-run effect of a one-sd increase in LIBERALIZAT ION on the interbank ratios of banks at the 25th percentile of the distribution of asset risk is equal to 0.51 pp, its effect on banks
21We have hand-collected information on the foreign ownership status of banks that are not covered by the data set of Claessens and van Horen (2014).
22This is the sum of LIBERALIZAT ION and LIBERALIZAT ION ∗ FOREIGN.
23See Jungherr (2016). A higher share of impaired loans generally signals that the bank is prone to funding more opaque projects, whose values are subject to substantial degrees of asymmetric information (and, hence, whose recovery of principal and interest, once they fall in default, is also subject to greater uncertainty).
with impaired loans at the 75th percentile is only equal to 0.3 pp. The long-run difference in interbank ratios between both types of banks is even more pronounced (3.4 pp vs. 2 pp). This result suggests that the interaction term is not only statistically, but also eco-nomically significant. Columns (7)-(9) further show that LIBERALIZAT ION has more muted effects on the equity ratios of more opaque banks. Overall, the results presented in this section thus indicate that the effects of external financial integration are amplified in banks with a lower degree of asymmetric information.
7
How Does Capital Account Liberalization Affect Small
Banks?
Table 7 depicts the size distribution of banks in our data set. It shows that 90% of (smaller) banks have a combined asset share of less than 21%. In contrast, the largest 5% of banks in our sample have a combined asset share of 66.5%. As we weighted all of the previous regressions by banks’ total assets, we identified—to a great extent—the implications of capital account liberalization for the largest 5% of banks.
In this section, we document whether and through which channels external financial openness also affects small banks’ funding dynamics, which is important because small banks are typically the main provider of credit to small/more opaque non-financial firms (Berger and Udell, 2002). To this end, we refrain from weighting the observations by total assets in the regressions presented in Table 8.
Table 7: The Distribution of Banks by Total Assets
Size Class Bank-Year Observations Asset Share (in %)
<50% 4139 1.8
50%-90% 3312 19.1
90%-95% 414 12.6
95%-99% 331 30.9
>99% 83 35.6
This table presents the number of bank-year observations for different bank size classes and the corresponding share of assets held by the particular size class (e.g. the first row shows the number of observations of the smallest 50 percent of banks in our sample, as well as their total assets relative to aggre-gate total assets of the whole banking system).
Unlike our baseline analysis, capital account openness leads to significantly higher shares of retail deposits (column (2)) and lower interbank ratios (column (3)) for small banks. These effects are also economically significant: in the long-run, the shares of retail funding increase by 4.2 pp and banks’ interbank ratios decrease by 1.5 pp in the wake of a one-sd increase in LIBERALIZAT ION.
The rise in interbank borrowing for the largest banks and higher retail deposits for small banks, in turn, raise the question on the transmission of global liquidity to the different types of banks. We conjecture that, in response to the lower relative cost of foreign and interbank borrowing (see Section 4), large banks lower their deposit interest rate relative to that of smaller banks, inducing deposit flows to the latter and, thus, making the latter more dependent on retail funding.24
To verify this hypothesis, we continue regressing the average country-level spread of small banks’ deposit interest rate, defined as banks in the lowest 95% of the country-specific distribution of total assets, relative to that of large banks (in the top 5% of the distribution) on the measure of capital account liberalization, controlling for country fixed effects.25 Column (4) shows that external financial liberalization induces large banks to lower their deposit interest rate relative to that of smaller banks, indicated by a positive coefficient on LIBERALIZAT ION, which is statistically significant at the 5% level. In economic terms, a one-sd increase in external financial openness raises the relative deposit rate of small banks (or reduces the relative deposit rate of large banks) by 2.1 pp, which is non-trivial given a median deposit interest rate of 7.4% in our sample. Overall, we therefore establish that small banks benefit indirectly from capital account openness via an increased access to retail deposits.
24This hypothesis is broadly in line with the extant literature on the link between banks’ market power and deposit rates, which shows that smaller (single-market) banks depend disproportionately more on customer deposits and, as a result, attract retail funding by paying a higher relative deposit interest rate (e.g., Barros, 1999; Hannan and Prager, 2006; Park and Pennacchi, 2009).
25The results are robust to employing alternative thresholds to differentiate between small and large banks. Due to few extreme outliers in the deposit spread of small banks, we drop values larger than 50% and lower than -10% in order to ensure that our results are not driven by these unrepresentative outliers.
T able 8: The Ef fects of Capital Account Liberalization on Small Banks (1) (2) (3) (4) CAPIT AL DEPOSITS INTERB ANK DEPOSIT SPREAD SMALL B ANKS CAPIT AL (t-1) 0.765 ∗∗∗ (18.19) DEPOSITS (t-1) 0.921 ∗∗∗ (66.89) INTERB ANK (t-1) 0.742 ∗∗∗ (27.42) LIBERALIZA TION -0.431 1.032 ∗ -1.202 ∗∗ 6.670 ∗∗ (-0.96) (1.76) (-2.36) (2.36) Bank Controls Y es Y es Y es No Macro Controls Y es Y es Y es Y es Country Fix ed Ef fects -Y es Obs 6877 6370 5383 187 Columns (1)-(3) are based on annual bank-le v el data o v er the period 1995-2013. The dependent v ariables are the shares of equity , retail deposits and interbank loans o v er total assets. The k ey re gressor is the de gree of capital account openness, measured by the capital inflo w inde x of Fernández et al. (2016). W e also add se v eral bank-le v el (the log arithm of total assets, the ratio of impaired loans and non-interest income in gross re v enues) and macro (per capita GDP , inflation, GDP gro wth and the VIX) co v ariates. The re gressions are estimated via the Blundell-Bond estimator , using fi v e lags of the v ariables as instruments. W e correct the standard errors by the procedure proposed in W indmeijer (2005). The t-statistics are sho wn in parentheses. Column (4) is based on country le v el data and re gresses the spread of small banks, defined as banks in the lo west 95% of the distribtuion of total assets, relati v e to banks in the top 5%, on capital account openness, controlling for country fix ed ef fects in addition to the set of macro controls. W e emplo y heterosk edasticity rob ust standard errors for the re gression of column (4). ∗p < 0 .10 , ∗∗ p < 0 .05 , ∗∗∗ p < 0 .01
8
Robustness Checks
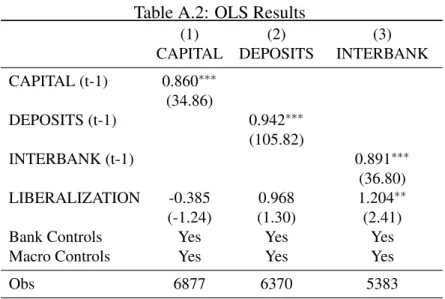
In this section, we present several robustness checks. We start to alter the econometric model by estimating equation (1) via ordinary least squares. As is apparent from Ta-ble A.2, capital account openness is still associated with significantly higher interbank funding ratios. Further, LIBERALIZAT ION also reduces banks’ capital ratios (though the corresponding coefficient is not statistically significant). As in our baseline analy-sis, there is no significant link between capital account openness and the shares of retail deposits. Thus, our main results are broadly robust to OLS estimation.
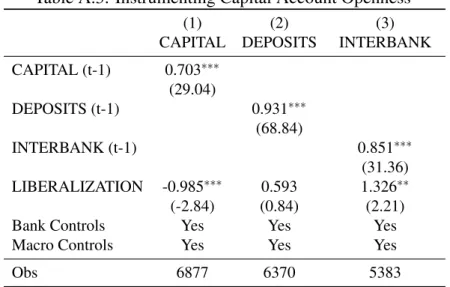
Next, we estimate our model with the Blundell-Bond estimator, but instrument the degree of capital account openness with a government’s partisanship indicator and an IMF program dummy. As argued in Section 2, both variables are exogenous to external financial liberalization and, additionally, significant drivers of the latter. We are thus able to corroborate the identification of a causal relationship between capital account openness and banks’ funding structures. Table A.3 corroborates our baseline estimates: a one-sd increase in external financial liberalization in the short-term increases banks’ interbank ratios by 0.42 pp and reduces banks’ capital ratios by 0.32 pp. Retail deposits, in contrast, are not affected by external financial liberalization at conventional significance levels.
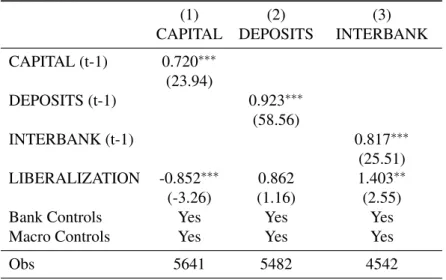
Finally, we adjust the time and bank coverage of our sample. In the time dimension, we estimate equation (1) over two sub-samples. First, using the definitions provided in Laeven and Valencia (2013), we restrict the sample period to non-crisis episodes to cir-cumvent any variation in banks’ funding ratios that is purely driven by financial crises. Second, we drop the years before 1999. Although we lose some variation in the inter-national financial liberalization measure, this adjustment might be important because the Bankscope database has a higher coverage for the period 1999-2013 (see Table 1).26 The attendant results in Table A.4 show that external financial openness is still associated with lower equity ratios and more interbank borrowing. In the bank dimension, we restrict the sample to commercial banks, cooperative banks and savings banks, thus dropping, for instance, governmental institutions from our data set, which might have a different sensitivity to the effects of external financial integration. Table A.5 establishes that this
adjustment does not change any of the coefficients significantly, implying that the dif-ferent types of banks in our sample do not affect our baseline estimates. If anything, restricting the sample to these three types of banks even raises the economic significance of LIBERALIZAT ION with regard to interbank funding ratios (the coefficient increases from 1.2 to 1.4).
9
Concluding Remarks
To the best of our knowledge, this is the first paper that relates changes in capital account controls to the funding structure of banks, employing bank-level data and a sizeable panel of emerging market economies. Recent research on the effects of international financial integration on the banking systems of emerging economies (see most notably Baskaya et al., 2017) have focused on the asset side of banks, rather than on attendant changes in the composition of bank liabilities. This paper shows that this neglect is unwarranted, since relaxations of capital controls are associated with a substitution of interbank funding for equity among large banks—an effect that dominates at the macro-level due to the size concentration of the domestic banking systems in many emerging market economies. We also show that substitution is also significant among foreign and informationally less opaque banks. Further, such effects are stronger during low global interest rate episodes.
These findings complement and provide further support to some of the current wisdom on how international financial integration can increase the propensity for financial insta-bility. All else constant, the average bank will tend to increase its reliance on (short-term) interbank funding with external financial integration. This result suggests that financial institutions are more prone to rollover risks following post-liberalization surges in capital inflows and large current account deficits. Whereas these findings should not be inter-preted as a rejection of the many benefits from international financial integration, they suggest that macroprudential regulations can play a key role as countries open up their capital accounts.
References
[1] A˘gca, ¸S., G. De Nicolò, and E. Detragiache: 2007, ‘Financial Reforms, Financial Openness, and Corporate Borrowing: International Evidence’. IMF Working Paper 07/186.
[2] Altunbas, Y., L. Gambacorta, and D. Marques-Ibanez: 2014, ‘Does Monetary Policy Affect Bank Risk?’. International Journal of Central Banking 10(1), 95–136. [3] Arellano, M. and S. Bond: 1991, ‘Some Tests of Specification for Panel Data: Monte
Carlo Evidence and an Application to Employment Equations’. Review of Economic Studies58(2), 277–297.
[4] Barros, P. P.: 1999, ‘Multimarket Competition in Banking, with an Example from the Portuguese Market’. International Journal of Industrial Organization 17(3), 335–352.
[5] Baskaya, Y. S., J. di Giovanni, S. Kalemli-Özcan, J.-L. Peydró, and M. F. Ulu: 2017, ‘Capital Flows and the International Credit Channel’. Journal of International Economics108(Supp. 1), S15–S22.
[6] Bekaert, G. and C. R. Harvey: 2000, ‘Foreign Speculators and Emerging Equity Markets’. Journal of Finance 55(2), 565–613.
[7] Berger, A. N. and C. H. S. Bouwman: 2009, ‘Bank Liquidity Creation’. Review of Financial Studies22(9), 3779–3837.
[8] Berger, A. N. and G. F. Udell: 2002, ‘Small Business Credit Availability and Re-lationship Lending: The Importance of Bank Organisational Structure’. Economic Journal112(477), 32–53.
[9] Blundell, R. and S. Bond: 1998, ‘Initial Conditions and Moment Restrictions in Dynamic Panel Data Models’. Journal of Econometrics 87(1), 115–143.
[10] Brooks, S. M.: 2004, ‘Explaining Capital Account Liberalization in Latin America: A Transitional Cost Approach’. World Politics 56(3), 389–430.
[11] Bruno, V. and H. S. Shin: 2015a, ‘Cross-Border Banking and Global Liquidity’. Review of Economic Studies82(2), 535–564.
[12] Bruno, V. and H. S. Shin: 2015b, ‘Capital Flows and the Risk-Taking Channel of Monetary Policy’. Journal of Monetary Economics 71, 119–132.
[13] Buch, C., M. Bussière, L. S. Goldberg, and R. Hills: 2018, ‘The International Trans-mission of Monetary Policy’. Federal Reserve Bank of New York Staff Reports 845. [14] Catão, L. A. V. and G. M. Milesi-Ferretti: 2014, ‘External Liabilities and Crises’.
Journal of International Economics94(1), 18–32.
[15] Cerutti, E., S. Claessens, and D. Puy: 2015, ‘Push Factors and Capital Flows to Emerging Markets: Why Knowing Your Lender Matters More Than Fundamentals’. IMF Working Paper15/127.
[16] Cerutti, E., S. Claessens, and L. Ratnovski: 2017, ‘Global Liquidity and Drivers of Cross-Border Bank Flows’. Economic Policy 32(89), 81–125.
[17] Cetorelli, N. and L. S. Goldberg: 2011, ‘Global Banks and International Shock Transmission: Evidence from the Crisis’. IMF Economic Review 59(1), 41–76. [18] Cetorelli, N. and L. S. Goldberg: 2012, ‘Banking Globalization and Monetary
Trans-mission’. Journal of Finance 67(5), 1811–1843.
[19] Claessens, S. and N. van Horen: 2014, ‘Foreign Banks: Trends and Impact’. Journal of Money, Credit and Banking46(1), 295–326.
[20] Correa, R., T. Paligorova, H. Sapriza, and A. Zlate: 2015, ‘Cross-Border Bank Flows and Monetary Policy’. mimeo, Federal Reserve Board.
[21] Craig, B. R. and V. Dinger: 2014, ‘Volatile Lending and Bank Wholesale Funding’. Federal Reserve Bank of Cleveland Working Paper1417.
[22] Daniel, B. C. and J. B. Jones: 2007, ‘Financial Liberalization and Banking Crises in Emerging Economies’. Journal of International Economics 72(1), 202–221.
[23] DeYoung, R. and T. Rice: 2004, ‘How Do Banks Make Money? The Fallacies of Fee Income’. Economic Perspectives Q4, 34–51.
[24] Dinger, V. and D. M. te Kaat: 2016, ‘Current Account Imbalances and Bank Risk-Taking’. mimeo, Osnabrück University.
[25] Dinger, V. and J. von Hagen: 2009, ‘Does Interbank Borrowing Reduce Bank Risk?’. Journal of Money, Credit and Banking 41(2-3), 491–506.
[26] European Central Bank: 2015, ‘Financial Stability Review, November 2015’. Frank-furt a. M.
[27] European Central Bank: 2016, ‘Report on Financial Structures, October 2016’. Frankfurt a. M.
[28] Faulkender, M., M. J. Flannery, K. W. Hankins, and J. M. Smith: 2012, ‘Cash Flows and Leverage Adjustments’. Journal of Financial Economics 103(3), 632–646. [29] Fernández, A., M. W. Klein, A. Rebucci, M. Schindler, and M. Uribe: 2016, ‘Capital
Control Measures: A New Dataset’. IMF Economic Review 64(3), 548–574.
[30] Fernández, A., A. Rebucci, and M. Uribe: 2015, ‘Are Capital Controls Counter-cyclical?’. Journal of Monetary Economics 76, 1–14.
[31] Flannery, M. J. and K. W. Hankins: 2013, ‘Estimating Dynamic Panel Models in Corporate Finance’. Journal of Corporate Finance 19, 1–19.
[32] George, C.: 2015, ‘Bank Size, Leverage, and Financial Downturns’. FDIC Center for Financial Research Paper2015-01.
[33] Gourinchas, P.-O. and M. Obstfeld: 2012, ‘Stories of the Twentieth Century for the Twenty-First’. American Economic Journal: Macroeconomics 4(1), 226–265. [34] Gropp, R. and F. Heider: 2010, ‘The Determinants of Bank Capital Structure’.
Re-view of Finance14(4), 587–622.
[35] Hahm, J.-H., H. S. Shin, and K. Shin: 2013, ‘Noncore Bank Liabilities and Financial Vulnerability’. Journal of Money, Credit and Banking 45(8), 3–36.