ORIGINAL PAPER
The Use of DRAQ5 to Monitor Intracellular DNA
in
Escherichia coli by Flow Cytometry
Filomena Silva&Olga Lourenço&Cidália Pina-Vaz& Acácio G. Rodrigues&João A. Queiroz&
Fernanda Conceição Domingues
Received: 7 December 2009 / Accepted: 15 March 2010 / Published online: 30 March 2010 # Springer Science+Business Media, LLC 2010
Abstract Flow cytometry provides a rapid and high-content multiparameter analysis of individual microorgan-isms within a population. In the past years, several fluorescent stains were developed in order to monitor DNA content distribution and cell-cycle phases, mainly in eukaryotic cells. Recently, due to its low detection limits, several of these fluorescent stains were also applied to prokaryotic cells. In this study, the ability of a novel far-red fluorescent stain DRAQ5 in assessing intracellular DNA content distribution in Escherichia coli DH5α was evalu-ated. The results showed that a DRAQ5-labelled live E. coli suspension can be obtained by incubation of 1×10⁶ cells/ mL with 5 µM DRAQ5 in PBS buffer supplemented with EDTA (pH=7.4) during 30 min at 37 °C. Flow cytometric analysis of fixed E. coli cells revealed that ethanol should be used in detriment of glutaraldehyde for DRAQ5 labelling. After the analysis of RNase and DNase digested samples, DRAQ5 was proven to be a specific DNA labelling stain. The present study demonstrates that the use of DRAQ5 as a DNA-labelling stain provides an easy assessment of intracellular DNA content and cell-cycle phases in Gram-negative bacteria such as E. coli.
Keywords Flow cytometry . Escherichia coli . DNA content . DRAQ5
Introduction
In recent years, the application of flow cytometry to prokaryotic cells has gained more relevance [1, 2]. Although bacteria are relatively difficult to analyze and differentiate by flow cytometry (FCM) owing mostly to their small cell size and similar morphology, this technique has evolved towards a high-throughput capacity of single cell analysis of bacterial populations [3]. This analysis enables the measurement of the distribution of a property or properties within the bacterial population such as DNA and RNA content [4] and bacterial viability [5], which is very helpful in assessing the heterogeneity of the bacterial population.
One of the reasons for heterogeneous bacterial popula-tions results from cell-cycle differences [6]. In bacterial cells, new rounds of chromosomal DNA replication may be initiated before a previous round has been completed. Thus, heterogeneity of DNA content will be larger in prokaryotes when compared with eukaryotes [7]. So, the ability to identify cell cycle position through DNA content analysis is fundamental in applications such as bioprocess monitoring [8] and antimicrobial susceptibility testing [9].
Since the first assays of DNA content in intact cells in order to assess cell cycle phases, a growing number of DNA-binding fluorochromes was made available. Con-ventionally, propidium iodide or ethidium bromide are used to identify intracellular DNA content. However, cells need to be fixed and RNase digested [8,10] which results in more laborious protocols. Furthermore, RNase diges-tion can lead to leakage of intracellular material. Another F. Silva
:
O. Lourenço:
J. A. Queiroz:
F. C. Domingues (*)Centro de Investigação em Ciências da Saúde, Universidade da Beira Interior,
Avenida Infante D. Henrique, 6200-506 Covilhã, Portugal e-mail: fdomingues@ubi.pt C. Pina-Vaz
:
A. G. RodriguesServiço e Laboratório de Microbiologia,
Faculdade de Medicina da Universidade do Porto, Alameda Prof. Hernâni Monteiro,
usual method of DNA-labelling involves the use of bisbenzimide dyes such as Hoechst 33258 and Hoechst 33342 [11,12] that fluoresce bright blue upon binding to DNA, but both require UV excitation. A newly developed far-red cell-permeant high affinity DNA-labelling dye, DRAQ5 (deep red-fluorescing bisalkylaminoanthraqui-none number five), has gained popularity in multipara-metric flow cytometry, due to the absence of spectral overlap with commonly used fluorescent stains such as FITC or GFP [13].
DRAQ5 has been mostly used in eukaryotes [14–16] with very few reports in prokaryotes. Herrero et al. (2006) and Quirós et al. (2007) reported the use of DRAQ5 for total cell count of yeast and Gram-positive bacteria involved in cider fermentation processes. However, the use and properties of this novel fluorescent stain have not yet been exploited in Gram-negative bacteria.
The aim of this study is to describe the ability of DRAQ5 to stain the DNA of Gram-negative bacteria, using Escherichia coli as a model. The possibility of using such stain for the analysis of bacterial cell-cycle is also discussed.
Experimental
Host strain and culture conditions
Escherichia coli DH5 alpha cells were grown in 250 mL shake flasks containing 62.5 mL of semi-defined media [17] in a orbital shaker at 37 °C at 250 rpm.
Cell fixation
Cells were harvested by centrifugation at 10000 x g for 10 min at 4 °C. Cells were washed once in 0.1 M Tris, 2 mM MgCl2buffer (pH 7.4). Ethanol fixation: The cell pellet was resuspended in 300 μL of ice-cold sterile distilled water. A 700 μL volume of ice-cold absolute ethanol was rapidly added, and the suspension was mixed by vigorous pipetting to prevent cell clumping. The sample was then incubated at 4 °C for 30 min for fixation. Fixed samples were analysed immediately or stored at −20 °C until they were stained and analyzed on the flow cytometer. Glutaraldehyde fixation: The cell pellet was resuspended in 400μL of ice-cold sterile distilled water. A 600μL volume of ice-cold 5% glutaraldehyde was rapidly added, and the suspension was mixed by vigorous pipetting to prevent cell clumping. The sample was then incubated at 4 °C for 30 min for fixation. Fixed samples were washed once again in 0.1 M Tris, 2 mM MgCl2 buffer (pH 7.4), immediately stained with DRAQ5 and analyzed on the flow cytometer.
DNase and RNase treatments
Ethanol-fixed cells at a concentration of approximately 1×10⁶ cells/mL (1 mL) were pelleted by centrifugation at 10000 x g for 10 min at 4 °C and ressuspended in one volume (1 mL) of DNase I 1 mg/mL final concentration in 0.1 M Tris, 5 mM MgCl2and 0.1 M NaCl buffer (pH 7.4) [8]. For RNase treatment, cells were firstly incubated with lysozyme 1.67 mg/mL final concentration, for 2 h at room temperature with shaking. After lysozyme treatment, cells were washed twice in 0.1 M Tris, 2 mM MgCl2buffer and incubated with 1.25 mg/mL RNase A in 0.1 M Tris, 5 mM MgCl2 and 0.1 M NaCl buffer (pH 7.4) [18]. Cell suspensions were digested with DNase for 1 h at 37 °C [8] and afterwards with RNase for 3 h at room temperature [18], pelleted by centrifugation at 18,000 × g for 10 min at 4 °C and ressuspended in 0.1 M Tris, 2 mM MgCl2buffer (pH 7.4).
Sample preparation for flow cytometry
Live cells: In order to obtain the most suitable DRAQ5 incubation time, 1x10⁶ E. coli cells were incubated with 5 µM DRAQ5 at 37 °C for several time periods ranging from 15 to 120 min, in the dark, and washed once in PBS buffer (pH 7.4) before flow cytometric analysis. In order to obtain a maximum of stained cells, 1×10⁶ cells/mL were incubated with serial concentrations of DRAQ5, ranging from 1 to 10 µM in PBS supplemented with 4 mM EDTA (pH 7.4). After the washing step, a sample of each suspension was collected for viability assessment by conventional dilution plating.
Fixed cells: In order to obtain an optimal concentration of dye, 1×10⁶ cells/mL were incubated with serial concen-trations of DRAQ5, ranging from 1 to 10 µM in 0.1 M Tris, 2 mM MgCl2buffer (pH 7.4). Cells were incubated at 37 °C for 30 min in the dark and washed once in the same buffer before flow cytometric analysis.
Number of replication origins
To determine the number of replication origins in each cell at a given fermentation time, rifampicin 300 mg/mL plus cephalexin 10 mg/mL were added to cells collected from fermentation. Samples were incubated at 37 °C for 2 h to allow all replication forks to run to completion. After the incubation period, cells were washed twice and ethanol-fixed, as previously described. DNA content of the cells was determined by flow cytometry as described above using the optimal DRAQ5 concentration. The number of chromosome equivalents per cell showed the number of
replication origins that were present at the time of drug addition.
Flow cytometry
DRAQ5 (Biostatus Limited, Leicestershire, U.K.) stock solution (5 mM) was diluted 1:50 with sterile distilled water and stored at 4 °C. Bacterial samples were analysed on a BD Biosciences FACSCalibur. Acquisition was performed with CellQuest™ Pro Software and based on light-scatter and fluorescence signals resulting from 15 mW laser illumination at 488 nm and 635 nm. Light scatter measure-ments were acquired logarithmically, while fluorescence signals were acquired either logarithmically or linearly, depending on the sample. In the case of samples containing live cells, fluorescence data were acquired logarithmically, in order to obtain a higher resolution for low signal intensities; for fixed cells analysis, all fluorescence data were acquired linearly. Signals corresponding to forward and side scatter (FSC and SSC) and fluorescence were accumulated, the fluorescence signal (pulse area measure-ments) was screened by a FL-4 (661 nm) bandpass filter. Threshold levels were empirically set on SSC to further reduce electronic and small particle noise. The flow cytometer was routinely operated at low flow rate setting (12 µL sample/minute), and data acquisition for a single sample typically took 20–30 min. E. coli cells were gated according to FSC/SSC parameters. Data analysis was performed using FCS Express version 3 Research Edition (De Novo Software™, Los Angeles, USA).
Confocal microscopy
E. coli suspensions were deposited in poly(D-lysine)-coated coverslips previously placed in the wells of a 12-well polystyrene plate. The plates were incubated at 37 °C for 45 min to allow the adhesion of E. coli cells to the coverslips. The plates were then washed with PBS buffer and fixed for 10 min at room temperature using 4% paraformaldehyde solution. The plates were washed with PBS buffer and permeabilized for 5 min at room temper-ature using 1% Triton X-100 solution. The plates were washed with PBS buffer and a 7.5 µM DRAQ5 solution was added to the wells. The plates were then incubated at 37 °C for 30 min. The plates were washed with PBS buffer and a 6 µg/mL Fluorescein 5(6)-isothiocyanate (FITC, Sigma-Aldrich) solution was added to the wells in order to stain whole cells. The plates were then incubated at 37 °C for 30 min; afterwards, cells were washed twice and the coverslips were mounted onto glass slides. These slides were then examined under a confocal microscope (x60) in a Olympus FluoView FV10i confocal microscope using the FluoView Ver.2.0b Software.
Results
DRAQ5 staining of live E. coli cells
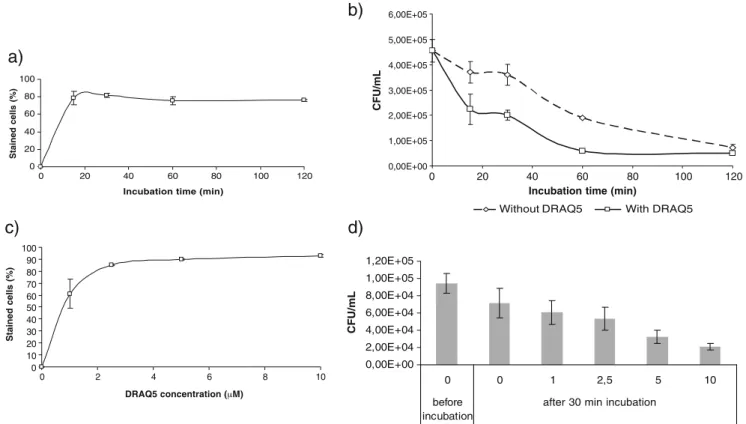
When E. coli cells were incubated with 1 µM DRAQ5 in PBS buffer supplemented with 4 mM EDTA (pH 7.4), the percentage of DRAQ5 stained cells reached a plateau after an incubation time of 30 min (Fig.1a). Incubation of E. coli cells with DRAQ5 caused, however, a reduction in bacterial viability. When E. coli cells were incubated in PBS buffer supplemented with 4 mM EDTA (pH 7.4) without the addition of DRAQ5, as incubation time increased, bacterial viability decreased; between 15 and 30 min of incubation, a plateau of stained cells was observed (Fig. 1b). When a similar E. coli suspension was incubated under the same conditions but with the addition of 1 µM DRAQ5, the behaviour of the cell population was similar to that observed without the addition of DRAQ5 but with a concomitantly higher decrease in bacterial viability (Fig.1b). When E. coli cells were incubated with increasing concentrations of DRAQ5 ranging from 1 to 10 µM, the percentage of DRAQ5 stained cells reached a plateau at a concentration of 5 µM (Fig.1c). As DRAQ5 concentration increased from 1 to 10 µM, bacterial viability decreased to almost four times less with the highest DRAQ5 concentra-tion used (Fig.1d). As DRAQ5 concentration increased, the percentage of stained cells also increased, reaching a maximum of 93% at a concentration of 10 µM (Fig. 1c). Flow cytometric comparison of cell fixation protocols Since DRAQ5 seems to alter the morphology of live E. coli cells and does not stain all the population, we investigated DRAQ5 labelling of fixed cells.
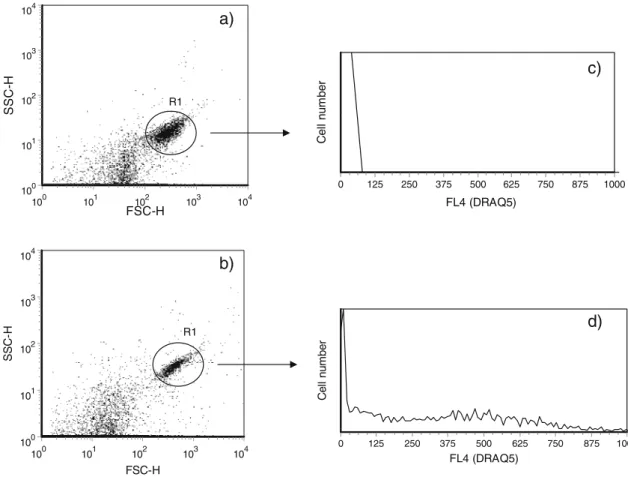
Glutaraldehyde and ethanol are two common fixatives for use in bacterial intracellular component measurements. Despite resulting in very similar populations in terms of light scatter measurements, these two fixatives exhibited very different patterns of fluorescence in the FL4 channel. Ethanol-fixed cells exhibited low fluorescence in the FL4 channel (Fig. 2c), while glutaraldehyde-fixed cells exhibited a mild background fluorescence in the same channel (Fig. 2d) which can cause a poor signal to noise ratio. Attending this finding, DRAQ5 and glutaraldehyde fixation should not be used concomitantly.
Labelling specificity of DRAQ5
In order to demonstrate bacterial DNA specificity of DRAQ5, cells were treated with DNase, RNase and with both these enzymes previously to DRAQ5 labelling. The analysis of light scatter parameters showed that DNase and RNase treatments were effective as indicated by the
decrease in forward and side scatter parameters (data not shown). Despite the fact that DNase treatment yielded a higher FL4 channel fluorescence comparing to treatment with both enzymes, the two histograms were very similar (Fig. 3b and c) to the non-stained population (Fig. 3a). RNase treatment yielded a similar FL4 channel fluores-cence distribution when compared to E. coli cells without treatment (Fig.3dande); nevertheless, RNase-treated cells exhibited peaks with lower CV and lower mean fluores-cence intensity.
The fact that this stain is DNA-specific is further supported by the microscopic evaluation of DRAQ5 and FITC stained E. coli cells where DRAQ5-stained E. coli chromosomes could be observed (Fig.3f).
DRAQ5 labelling of ethanol-fixed E. coli cells
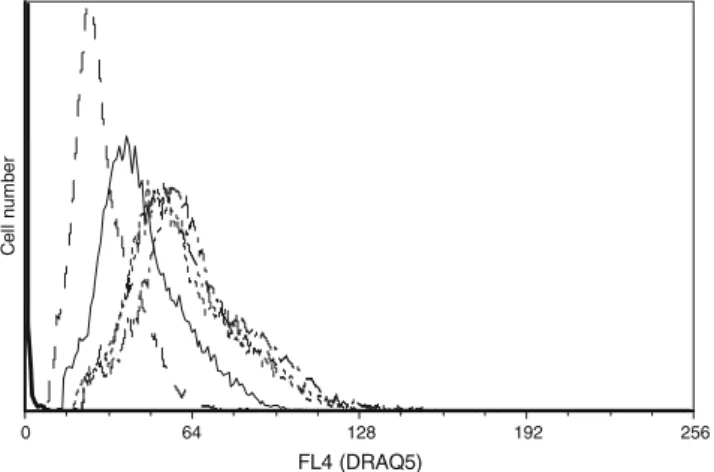
When ethanol-fixed E. coli cells were incubated with serial DRAQ5 concentrations, the fluorescence distribution histo-grams for DRAQ5 concentrations ranging from 5 to 10 µM were very similar (Fig.4). In order to establish an optimal stain concentration, the mean and median fluorescence intensity values were determined. The analysis of the
fluorescence intensity values (62.32) and peak CV values (32%) showed that the optimal dye concentration was reached at 7.5 µM DRAQ5. At concentrations of 5 µM and 10 µM the fluorescence intensity values were lower (56.10 and 57.97, respectively) with higher peak CVs (33% and 34%).
E. coli cell cycle analysis with DRAQ5
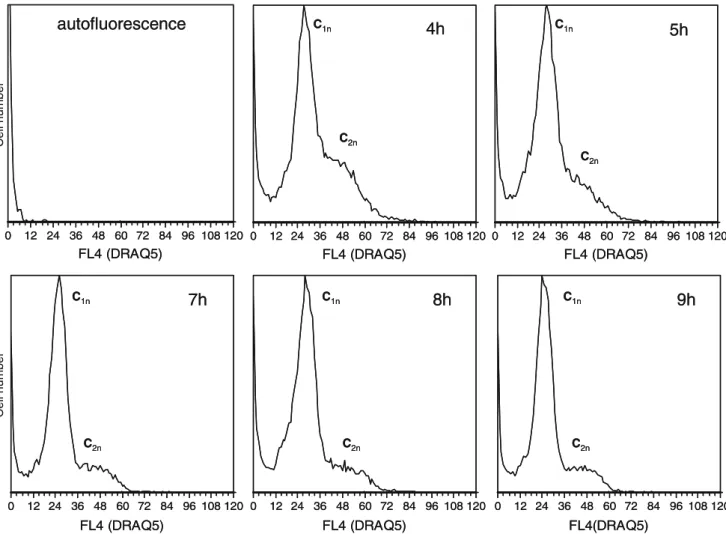
Ethanol-fixed E. coli cells stained with DRAQ5 exhibited a broad fluorescence distribution (Fig. 5), possibly due to population heterogeneity, which did not allow visualizing peaks corresponding to fully replicated chromosomes. In order to evaluate the ability of DRAQ5 to resolve ploidy, cells were incubated with rifampicin and cephalexin. The analysis of fluorescence distribution showed that fluores-cence peaks were sharper and with lower peak CV values (approximately 14%) in treated cells comparing to non-treated cells (32%). When observing the fluorescence distribution histograms resulting from this incubation, two peaks were identified (Fig. 5). The mean fluorescence intensity value of the first peak was approximately 24 units and the mean fluorescence intensity of the second peak was
c)
b)
d)
0 20 40 60 80 100 0 20 40 60 80 100 120Incubation time (min)
Stained cells (%) 0 10 20 30 40 50 60 70 80 90 100 0 2 4 6 8 10 DRAQ5 concentration (µM) Stained cells (%) 0,00E+00 2,00E+04 4,00E+04 6,00E+04 8,00E+04 1,00E+05 1,20E+05 0 0 1 2,5 5 10 before incubation
after 30 min incubation
DRAQ5 concentration (µM) CFU/mL 0,00E+00 1,00E+05 2,00E+05 3,00E+05 4,00E+05 5,00E+05 6,00E+05 0 20 40 60 80 100 120
Incubation time (min)
CFU/mL
Without DRAQ5 With DRAQ5
a)
Fig. 1 Effect of incubation time and DRAQ5 concentration in the percentage of stained cells and bacterial viability: (a) percentage of DRAQ5 stained cells following different incubation times using a fixed DRAQ5 concentration (5 µM), (b) effect of incubation time in bacterial viability with and without the addition of DRAQ5 (5 µM),
(c) percentage of DRAQ5 stained cells in the presence of serial DRAQ5 concentration with an incubation time of 30 min, (d) effect of DRAQ5 concentration in bacterial viability with 30 min of incubation. A total of 20 000 events were collected for this analysis
approximately 48 units (Fig.5), what indicated that these peaks probably corresponded to peaks of cells containing one or two chromosome equivalents. The analysis of treated samples taken from the fermentation at regular time periods showed that the percentage of cells with two chromosome equivalents decreases throughout fermentation time from 30% at 4 h of growth to about 15% at 9 h of growth, leading to an increase of cells with only one chromosome equivalent in the late-exponential and station-ary phases of growth.
Discussion
DRAQ5 has been shown to be able to stain live and fixed eukaryotic cells [19–21] and live Gram-positive bacteria [22, 23]. In this work, the ability of DRAQ5 to stain live and fixed samples of the Gram-negative bacteria E. coli was investigated. As DRAQ5 also proved to be useful in the analysis of the eukaryotic cell cycle [16], it was also studied in addition whether it could resolve bacterial cell cycle phases.
The incubation buffer of choice for live cell staining was PBS supplemented with EDTA in order to permeate the outer cell membrane, thus facilitating the uptake of DRAQ5. The use of this incubation buffer caused a reduction of bacterial viability that could result from the destabilizing effect of EDTA in the bacterial outer mem-brane [24]. The addition of DRAQ5 to E. coli cells resulted in a decrease in viability when compared with cells without DRAQ5 addition. This fact can be due to changes in chromatin structure and impairment of cell cycle progres-sion [25] since, like other DNA fluorescent stains, DRAQ5 is a DNA intercalating agent. The percentage of DRAQ5-labelled live E. coli cells remained almost unaltered following different incubation periods, indicating that DRAQ5 is a time-independent stain and, probably, it is not pumped out from the cells. However, when analysing bacterial viability, the results showed that viability only remained unaltered between 15 and 30 min incubation time, which lead to the choice of an incubation period of 30 min.
DRAQ5-labelling of live E. coli cells proved to be effective at a concentration of 5 µM, yielding about 93% of stained cells. Increasing DRAQ5 concentrations caused a FSC-H SSC-H 100 101 102 103 104 100 101 102 103 104 FSC-H SSC-H 100 101 102 103 104 100 101 102 103 104 FL4 (DRAQ5) C e ll num ber 0 125 250 375 500 625 750 875 1000 FL4 (DRAQ5) C e ll n u mb e r 0 125 250 375 500 625 750 875 1000 R1 R1
a)
b)
c)
d)
Fig. 2 Effect of different fixatives on light scatter measurements and fluorescence distribution. (a) Light scatter measurements of ethanol-fixed E. coli cells, (b) light scatter measurements of glutaraldehyde-fixed E. coli cells. Histograms showing the distribution of DRAQ5
fluorescence intensity (FL4 channel) of fixed E. coli cells without staining using (c) ethanol or (d) glutaraldehyde as fixatives. R1 region corresponded to E. coli cells gating. A total of 20,000 events were collect for this analysis
significant decrease in the viability of E. coli population. In order to obtain higher staining percentage, we tested several incubation buffers with EDTA concentrations up to 10 µM. However, higher staining percentages were not obtained,
resulting in a decrease in bacterial viability (data not shown). The inability to stain 100% of the cells may be due to the fact that the E. coli population probably contained ghost-cells that are not stained with DRAQ5. The results obtained suggest that an optimized protocol for DRAQ5-labelling of live cells should involve the incubation of 1×10⁶ cells/mL with 5 µM DRAQ5 in PBS buffer supplemented with EDTA (pH 7.4) during 30 min at 37 °C. DRAQ5 proved to be specific for bacterial DNA, since DNase treatments yielded a fluorescence distribution similar to that obtained with no DRAQ5 labelling while RNase treatment yielded a fluorescence distribution similar to that of DRAQ5 labelling. Nonetheless, DRAQ5 revealed a weak fluorescence when bound to bacterial RNA.
For DRAQ5 labelling of fixed E. coli cells, ethanol should be preferred as fixative in detriment of glutaralde-hyde, due to the absence of positive fluorescence in the FL4 channel. The titration of fixed E. coli cells (1×10⁶ cells/ mL) with different DRAQ5 concentrations showed that an optimal dye concentration could be achieved with 7.5 µM, based on the values of fluorescence intensity and peak CVs obtained. FL4 (DRAQ5) C e ll num ber 0 64 128 192 256
Fig. 4 Typical histograms showing the distribution of DRAQ5 fluorescence intensity (FL4 channel) in a linear scale using ethanol-fixed E. coli cell suspensions incubated with DRAQ5 concentrations ranging from 0 to 10 µM. A total of 20,000 events were collected for this analysis FL4 (DRAQ5) Cell number Cell number Cell number Cell number Cell number FL4 (DRAQ5) FL4 (DRAQ5) FL4 (DRAQ5) FL4 (DRAQ5)
a)
b)
d)
c)
e)
f)
Fig. 3 Effect of enzyme diges-tion on the DRAQ5 staining of fixed E. coli cells. (a) untreated suspension without staining, (b) stained cell suspension after DNase treatment, (c) stained cell suspension after DNase and RNase treatments, (d) stained cell suspension after RNase treatment and (e) untreated and stained cell suspension, (f) con-focal microscopy images of E. coli cells immobilized on poly (D-lysine)-coated coverslips and incubated with DRAQ5 (red) and FITC (green) as described in the Experimental section. A total of 20,000 events were collected for the flow cytometric analysis
Some authors have described the use of Hoechst 33342 UV-fluorescent stain to assess bacterial cell cycle phases [26]. However, UV radiation causes damages in cellular DNA [27] and benchtop flow cytometers with a UV laser are uncommon in a research laboratory. For these reasons, we further investigated the ability of DRAQ5 to resolve bacterial DNA content. The fluorescence distribution histo-grams obtained with rifampicin plus cephalexin treated E. coli cells showed two peaks, corresponding to one or two chromosome equivalents, attending to the mean fluores-cence values of those peaks. The results obtained demon-strated that this E. coli strain, in the conditions mentioned, has a eukaryotic-like cell cycle, since the cells only possessed one or two chromosome equivalents [28].Similar cell cycle analysis has already been described for other E. coli K-12 derivatives [29] in slowly-growing cultures using other fluorescent stains [17]. Furthermore, the increase in the population of cells with only one chromosome equivalent in late-exponential and stationary phases of
growth is in agreement with proposed models of bacterial growth [30].
Conclusion
The results of this study suggest that DRAQ5 can be successfully used to stain a bacterial population in order to discriminate bacteria from other background particles. Moreover, it was demonstrated that DRAQ5 is able to stain bacterial DNA in ethanol-fixed E. coli cells without the need for additional laborious and expensive enzymatic treatment steps. This work showed evidence that DRAQ5 can be effectively used to monitor bacterial cell cycle since peaks of fully replicated chromosomes can be observed. In conclu-sion, DRAQ5 can be used alone or in combination with other commonly used fluorescent stains such as FITC or antibodies labelled with fluorescent stains, for multiparame-ter analysis of live and fixed Gram-negative bacmultiparame-terial cells. FL4 (DRAQ5) 0 12 24 36 48 60 72 84 96 108 120 FL4 (DRAQ5) 0 12 24 36 48 60 72 84 96 108 120 C1n C2n FL4 (DRAQ5) 0 12 24 36 48 60 72 84 96 108 120 C1n C2n FL4 (DRAQ5) 0 12 24 36 48 60 72 84 96 108 120 C2n FL4 (DRAQ5) 0 12 24 36 48 60 72 84 96 108 120 C1n C2n
4h
5h
7h
8h
FL4(DRAQ5) 0 12 24 36 48 60 72 84 96 108 120 C2n9h
autofluorescence
C1n C1n FL4 (DRAQ5) 0 12 24 36 48 60 72 84 96 108 120 FL4 (DRAQ5) 0 12 24 36 48 60 72 84 96 108 120 C1n C2n FL4 (DRAQ5) 0 12 24 36 48 60 72 84 96 108 120 C1n C2n FL4 (DRAQ5) 0 12 24 36 48 60 72 84 96 108 120 C2n FL4 (DRAQ5) 0 12 24 36 48 60 72 84 96 108 120 C1n C2n4h
5h
7h
8h
FL4(DRAQ5) 0 12 24 36 48 60 72 84 96 108 120 C2n9h
autofluorescence
Cell number Cell number C1n C1nFig. 5 DNA content distributions of E. coli DH5 alpha. Cells were grown in a semi-defined media and sampled for flow cytometry after incubation with rifampicin and cephalexin for 2 h. A total of 20,000 events was collect for this analysis
Acknowledgments The authors would like to thank Biostatus Limited (Leicestershire, U.K.) for kindly providing DRAQ5 stock solution. The authors would also like to thank A. Martinho and E. Cairrão for their help with the preparation and visualization of samples for the fluorescence microscopy study.
This work was supported by FCT, the Portuguese Foundation for Science and Technology (PTDC/EQU-EQU/65492/2006). Filomena Silva acknowledges a PhD fellowship SFRH/BD/41521/2007 from FCT.
References
1. Davey HM (2002) Flow cytometric techniques for the detection of microorganisms. Methods Cell Sci 24:91–97
2. Zahavy E, Heleg-Shabtai V, Zafrani Y, Marciano D, Yitzhaki S (2009) Application of fluorescent nanocrystals (q-dots) for the detection of pathogenic bacteria by flow-cytometry. J Fluoresc (in press)
3. Roostalu J, Joers A, Luidalepp H, Kaldalu N, Tenson T (2008) Cell division in Escherichia coli cultures monitored at single cell resolution. BMC Microbiol 8:68–81
4. Borth N, Mitterbauer R, Mattanovich D, Kramer W, Bayer K, Katinger H (1998) Flow cytometric analysis of bacterial physiol-ogy during induction of foreign protein synthesis in recombinant Escherichia coli cells. Cytometry 31:125–129
5. Hewitt CJ, Onyeaka H, Lewis G, Taylor IW, Nienow AW (2007) A comparison of high cell density fed-batch fermentations involving both induced and non-induced recombinant Escherichia coli under well-mixed small-scale and simulated poorly mixed large-scale conditions. Biotechnol Bioeng 96:495–505
6. Davey HM, Kell DB (1996) Flow cytometry and cell sorting of heterogeneous microbial populations: the importance of single-cell analyses. Microbiol Rev 60:641–696
7. Winson MK, Davey HM (2000) Flow cytometric analysis of microorganisms. Methods 21:231–240
8. Canovas M, Garcia V, Bernal V, Torroglosa T, Iborra JL (2007) Analysis of Escherichia coli cell state by flow cytometry during whole cell catalyzed biotransformation for L-carnitine production. Process Biochem 42:25–33
9. Roth BL, Poot M, Yue ST, Millard PJ (1997) Bacterial viability and antibiotic susceptibility testing with SYTOX green nucleic acid stain. Appl Environ Microbiol 63:2421–2431
10. Garcia-Ochoa F, Santos VE, Alcon A (1998) Intracellular compounds quantification by means of flow cytometry in bacteria: application to xanthan production by Xanthomonas campestris. Biotechnol Bioeng 57:87–94
11. Soriano E, Borth N, Katinger H, Mattanovich D (1999) Flow cytometric analysis of metabolic stress effects due to recombinant plasmids and proteins in Escherichia coli production strains. Metab Eng 1:270–274
12. Velamakanni S, Yao Y, Gutmann DA, van Veen HW (2008) Multidrug transport by the ABC transporter Sav1866 from Staphylococcus aureus. Biochemistry 47:9300–9308
13. Smith PJ, Blunt N, Wiltshire M, Hoy T, Teesdale-Spittle P, Craven MR, Watson JV, Amos WB, Errington RJ, Patterson LH (2000) Characteristics of a novel deep red/infrared fluorescent cell-permeant DNA probe, DRAQ5, in intact human cells analyzed by flow cytometry, confocal and multiphoton microscopy. Cytometry 40:280–291
14. Allan RW, Ansari-Lari MA, Jordan S (2008) DRAQ5-based, no-lyse, no-wash bone marrow aspirate evaluation by flow cytometry. Am J Clin Pathol 129:706–713
15. Smith PJ, Wiltshire M, Errington RJ (2004) DRAQ5 labeling of nuclear DNA in live and fixed cells. Curr. Protoc. Cytom. Chapter 7, Unit 7.25
16. Yuan CM, Douglas-Nikitin VK, Ahrens KP, Luchetta GR, Braylan RC, Yang L (2004) DRAQ5-based DNA content analysis of hematolymphoid cell subpopulations discriminated by surface antigens and light scatter properties. Cytometry B Clin Cytom 58:47–52
17. Silva F, Passarinha L, Sousa F, Queiroz JA, Domingues FC (2009) Influence of growth conditions on plasmid DNA production. J Microbiol Biotechnol 19:1408–1414
18. Sun L, Jacobson BA, Dien BS, Srienc F, Fuchs JA (1994) Cell cycle regulation of the Escherichia coli nrd operon: requirement for a cis-acting upstream AT-rich sequence. J Bacteriol 176:2415– 2426
19. Edward R (2009) Use of DNA-specific anthraquinone dyes to directly reveal cytoplasmic and nuclear boundaries in live and fixed cells. Mol Cells 27:391–396
20. Njoh KL, Patterson LH, Zloh M, Wiltshire M, Fisher J, Chappell S, Ameer-Beg S, Bai Y, Matthews D, Errington RJ, Smith PJ (2006) Spectral analysis of the DNA targeting bisalkylaminoan-thraquinone DRAQ5 in intact living cells. Cytometry A 69:805– 814
21. Swerts K, Van Roy N, Benoit Y, Laureys G, Philippe J (2007) DRAQ5: improved flow cytometric DNA content analysis and minimal residual disease detection in childhood malignancies. Clin Chim Acta 379:154–157
22. Herrero M, Quiros C, Garcia LA, Diaz M (2006) Use of flow cytometry to follow the physiological states of microorganisms in cider fermentation processes. Appl Environ Microbiol 72:6725– 6733
23. Quiros C, Herrero M, Garcia LA, Diaz M (2007) Application of flow cytometry to segregated kinetic modeling based on the physiological states of microorganisms. Appl Environ Microbiol 73:3993–4000
24. Berney M, Hammes F, Bosshard F, Weilenmann HU, Egli T (2007) Assessment and interpretation of bacterial viability by using the LIVE/DEAD BacLight Kit in combination with flow cytometry. Appl Environ Microbiol 73:3283–3290
25. Zhao H, Traganos F, Dobrucki J, Wlodkowic D, Darzynkiewicz Z (2009) Induction of DNA damage response by the supravital probes of nucleic acids. Cytometry A 75:510–519
26. Monfort P, Baleux B (1996) Cell cycle characteristics and changes in membrane potential during growth of Escherichia coli as determined by a cyanine fluorescent dye and flow cytometry. J Microbiol Methods 25:79–86
27. Martin RM, Leonhardt H, Cardoso MC (2005) DNA labeling in living cells. Cytometry A 67:45–52
28. Muller S (2007) Modes of cytometric bacterial DNA pattern: a tool for pursuing growth. Cell Prolif 40:621–639
29. Michelsen O, Teixeira de Mattos MJ, Jensen PR, Hansen FG (2003) Precise determinations of C and D periods by flow cytometry in Escherichia coli K-12 and B/r. Microbiology 149:1001–1010
30. Kubitschek HE, Freedman ML (1971) Chromosome replication and the division cycle of Escherichia coli B/r. J Bacteriol 107:95– 99