Universidade Federal de São Carlos
Centro de Ciências Biológicas e da Saúde
Programa de Ecologia e Recursos Naturais
A inclusão da abundância na diversidade funcional aumenta o seu poder
de previsão?: teste em uma comunidade de cerrado
Universidade Federal de São Carlos
Centro de Ciências Biológicas e da Saúde
Programa de Ecologia e Recursos Naturais
A inclusão da abundância na diversidade funcional aumenta o seu poder
de previsão?: teste em uma comunidade de cerrado
Raquel Carolina Miatto
Dissertação de Mestrado apresentada à
Universidade Federal de São Carlos,
como parte dos requisitos para obtenção
do título de Mestre em Ecologia e
Recursos Naturais
Ficha catalográfica elaborada pelo DePT da Biblioteca Comunitária da UFSCar
M618ia
Miatto, Raquel Carolina.
A inclusão da abundância na diversidade funcional aumenta o seu poder de previsão? : teste em uma comunidade de cerrado / Raquel Carolina Miatto. -- São Carlos : UFSCar, 2011.
35 f.
Dissertação (Mestrado) -- Universidade Federal de São Carlos, 2011.
Dedico este trabalho aos meus queridos pais,
Wilson e Renilda, por todo esforço em me
criarem e manterem meus estudos, pelos
Agradecimentos
Ao Prof. Dr. Marco Antônio Batalha, pela oportunidade, pela excelente orientação e
pela paciência.
Ao Prof. Dr. Marcus Vinicius Cianciaruso, pela co-orientação, incentivo e
paciência, desde as primeiras linhas do projeto de mestrado.
À CAPES, pela bolsa concedida durante o primeiro ano de trabalho.
À FAPESP, pela concessão da bolsa de mestrado e financiamento do segundo ano
de trabalho.
Ao Programa de Ecologia e Recursos Naturais, pelo auxílio e suporte.
Ao Dr. Igor Aurélio da Silva, por tudo que me ensinou e pelo exemplo de conduta
científica que contribuíram para a minha formação e decisões. Pelo otimismo, incentivo e
amizade.
À Juliana, por todos os dias de coleta, pela ajuda e pela convivência.
Ao Danilo e à Patrícia, pelo empréstimo do carro para as coletas diárias. Ao Danilo,
ainda, pela ajuda em campo, pelas áreas foliares calculadas, pelas incontáveis ajudas
técnicas com o R, pelas discussões científicas e pelo bom humor.
À Natália, por sua contínua ajuda em campo e em laboratório. Pela amizade e
companhia.
Ao Gustavo, pela ajuda em campo e inúmeras caronas e ajudas computacionais.
Pelos momentos de descontração, pela amizade e por estar sempre pronto a ajudar.
À Priscilla, pela ajuda em campo, pelo cálculo de áreas foliares e pela agradável e
divertida convivência.
Novamente ao Danilo, Priscilla e Vinicius e todos aqueles que os ajudaram com o
estabelecimento de parcelas, identificação de espécies e medição do perímetro basal.
A todos os que me ajudaram em campo quando convidados: Carol, Mariana, Pavel,
Rafael.
À Profa. Dra. Maria Inês Salgueiro Lima, por gentilmente ceder um espaço em seu
laboratório para a análise do material coletado durante a reforma do Laboratório de
Ecologia Vegetal.
À Profa. Dra. Dalva Maria Silva Matos, pela oportunidade para trabalhar com
ecologia vegetal e com o cerrado na iniciação científica, pela ajuda em momentos difíceis e
pelo incentivo a permanecer na vida acadêmica.
Aos meus amigos de São Carlos pela convivência, pelos momentos de diversão e
pelo compartilhamento das emoções da vida de pós-graduandos.
À Niara, pela amizade, força e paciência diárias.
Ao Lucas, pela compreensão, paciência e companheirismo.
À minha família, pelo suporte e apoio às minhas decisões. Por aguentarem meus
Sumário
Resumo ... 07
Capítulo 1: A inclusão da abundância na diversidade funcional aumenta o seu poder de previsão?: teste em uma comunidade de cerrado ... 08
Abstract... 10
Introduction ... 12
Methods ... 15
Results ... 17
Discussion... 18
Acknowledgments ... 23
Literature Cited... 23
Tables ... 29
Resumo
Assumindo que medidas de diversidade tradicionais são estimativas grosseiras do
funcionamento de comunidades e que medidas que incorporam informações dos traços
funcionais são melhores do que as tradicionais, medidas de diversidade funcional são
bastante utilizadas atualmente. Contudo, raramente é testado se, de fato, a inclusão dos
traços funcionais em estimativas de biodiversidade aumenta nosso poder preditivo. Além
disso, medidas de diversidade funcional baseadas em dendrogramas geralmente não
consideram a abundância. Em uma área de cerrado no sudeste brasileiro, testamos se a
inclusão dos traços funcionais leva a um aumento no poder preditivo ao relacionar a
diversidade funcional ao funcionamento da comunidade quando comparada a medidas de
diversidade tradicionais. Demonstramos que é possível incluir a abundância em medidas de
diversidade funcional baseadas em dendrogramas e testamos se a inclusão da abundância
eleva o poder preditivo da diversidade funcional em comparação à comumente calculada.
Nenhuma medida de diversidade relacionou-se ao funcionamento da comunidade, inclusive
a diversidade funcional. Porém, mostramos que é possível incluir a abundância em medidas
de diversidade funcional baseadas em dendrogramas, apesar da maioria dos índices estar
correlacionada.
Palavras-chave: decomposição de serapilheira, dendrograma, funcionamento de
A inclusão da abundância na diversidade funcional aumenta o seu poder
de previsão?: teste em uma comunidade de cerrado
1
1 Trabalho submetido à revista Biotropica com o título “Does the Inclusion of Abundance in Functional
1
2
LRH: Miatto, Cianciaruso, Carvalho, and Batalha 3
RRH: Including Abundance in Functional Diversity 4
5
6
7
8
9
10
Does the Inclusion of Abundance in Functional Diversity Increase its Predictive
11
Power?: Test in a Brazilian Savanna
12
13
Raquel C. Miatto1, 3, Marcus V. Cianciaruso2, Gustavo H. de Carvalho1, Marco A.
14
Batalha1
15
16
1Departament of Botany, Federal University of São Carlos, PO Box 676, São Carlos
13565-17
905, SP, Brazil; 18
2Department of Ecology, Federal University of Goiás, PO Box 131, Goiânia
19
74001-970, GO, Brazil. 20
21
Received ____; revision accepted ____ . 22
3 Corresponding author; e-mail: rmiatto@yahoo.com.br
ABSTRACT
1
2
Assuming that traditional measures of diversity are rough predictors of functioning and that 3
measures that incoporate information about functional traits are better predictors than the 4
traditional ones, functional diversity measures are intensely used nowadays. However, 5
whether the inclusion of functional traits in biodiversity estimation indeed increases our 6
predictive power is rarely tested. Moreover, dendrogram-based functional diversity 7
measures usually do not take abundance into account. By sampling a southern cerrado site 8
in Brazil, we tested whether, when compared to traditional diversity measures, the inclusion 9
of functional traits leads to an increased predictive power in relating functional diversity to 10
community functioning. We demonstrated that it is possible to include abundance in 11
dendrogram-based functional diversity, and tested whether, when compared to functional 12
diversity as usually calculated, the inclusion of abundance leads to an increased predictive 13
power. No diversity measure was related to community functioning, including functional 14
diversity. Nevertheless, we showed that it is possible to include abundance in dendrogram-15
based functional diversity measures, even if most indices were correlated with each other. 16
17
RESUMO
18
19
Assumindo que medidas de diversidade tradicionais são estimativas grosseiras do 20
funcionamento de comunidades e que medidas que incorporam informações dos traços 21
funcionais são melhores do que as tradicionais, medidas de diversidade funcional são 22
bastante utilizadas atualmente. Contudo, raramente é testado se, de fato, a inclusão dos 23
disso, medidas de diversidade funcional baseadas em dendrogramas geralmente não 1
consideram a abundância. Em uma área de cerrado no sudeste brasileiro, testamos se a 2
inclusão dos traços funcionais leva a um aumento no poder preditivo ao relacionar a 3
diversidade funcional ao funcionamento da comunidade quando comparada a medidas de 4
diversidade tradicionais. Demonstramos que é possível incluir a abundância em medidas de 5
diversidade funcional baseadas em dendrogramas e testamos se a inclusão da abundância 6
eleva o poder preditivo da diversidade funcional em comparação à comumente calculada. 7
Nenhuma medida de diversidade relacionou-se ao funcionamento da comunidade, inclusive 8
a diversidade funcional. Porém, mostramos que é possível incluir a abundância em medidas 9
de diversidade funcional baseadas em dendrogramas, apesar da maioria dos índices estar 10
correlacionada. 11
12
Key words: community functioning; dendrogram; functional traits; litter decomposition;
13
savanna. 14
THE STRUCTURE AND FUNCTIONING OF BIOLOGICAL COMMUNITIES MAY BE DETERMINED BY
1
biological diversity, since species interact through competition and facilitation and they can 2
be complementary or redundant on resource use (Bertness & Callaway 1994, Hooper & 3
Vitousek 1997). Many studies about the relationship between diversity and community 4
functioning used originally species richness as a measure of diversity (Díaz & Cabido 5
2001). However, traditional diversity indices have been considered crude estimations of 6
community structure and functioning due to the loss of information, since they reduce the 7
vast group of factors that governs a community, such as genotypic composition and 8
functional types to a simple list of species (Rousseau et al. 1999, Díaz & Cabido 2001).
9
Moreover, community functioning seems to be more related to functional trait identity and 10
number than to species richness itself (Tilman et al. 1997, Díaz & Cabido 2001). Assuming
11
that traditional measures of diversity are rough predictors of functioning and that measures 12
that incoporate information about functional traits are better predictors than the traditional 13
ones (Díaz & Cabido 2001, Petchey 2004), functional diversity measures are intensely used 14
nowadays (Petchey & Gaston 2006). 15
Despite these assumptions, whether the inclusion of functional traits in biodiversity 16
estimation indeed increases our predictive power is rarely tested. Although trait-based 17
measures of diversity are considered a tool for explaining the role of organisms in 18
communities and the ecological impacts of their loss (Petchey & Gaston 2006), their 19
superior predictive power in comparison with richness or other traditional measures of 20
diversity has been demonstrated in few studies, such as Tilman et al. (1997), for
21
productivity; Joshi et al. (2000), for plant resistance against parasites; and
Scherer-22
Lorenzen (2008), for decomposition rates. Since all these studies were carried out in 23
functioning needs to be tested in complex, natural communities, including tropical ones 1
(Hillebrand & Matthiessen 2009). 2
The functional diversity index called “FD” (Petchey & Gaston 2002, 2006) measures the 3
extension of complementarity among species trait values and estimates species similarity as 4
a function of their functional traits (Petchey & Gaston 2002, 2006). The greater the 5
differences between the trait values, the higher the FD and, thus, the higher the 6
complementarity in resources use (Petchey & Gaston 2002, 2006). What is expected in this 7
case is that communities with higher functional diversity will operate in a more efficient 8
way (Tilman et al. 1997). FD is robust and seems to predict better community functioning,
9
when compared to species richness, traditional diversity indices, and functional group 10
richness (Petchey et al. 2004). Nevertheless, one of the limitations of FD is that species
11
abundances are ignored and, as a consequence, community evenness is not considered, that 12
is, rare and abundant species are considered to have the same effect upon community 13
functioning. In this sense, FD may be considered more as a functional richness measure 14
than as a functional diversity one. Aware of this limitation, Petchey and Gaston (2006) 15
asked whether it was possible “to incorporate evenness into measures based on 16
dendrogram”. 17
Abundance distribution is considered the most fundamental measure in ecology, because 18
it describes how the individuals in a community are partitioned among rare and common 19
species, reflecting how species pack in time (Pachepsky et al. 2001). Usually only
20
functional diversity measures based on pairwise distances include abundance (for example, 21
Rao 1982, Mason et al. 2003, 2005). These measures, however, present some undesirable
counterintuitive (Ricotta 2005, Petchey & Gaston 2006), and (2) they incorrectly assume 1
pairwise distances to be independent, leading to an inflated estimate of functional diversity 2
(Petchey & Gaston 2006). Since the performance of a species depends on both its traits and 3
its abundance (Reiss et al. 2009), a dendrogram-based measure of functional diversity that
4
incoporates species abundances would combine the best properties of both approaches 5
(Petchey & Gaston 2006). 6
In phylogenetic approaches, several indices have been developed, some of which take 7
into account species abundances (see Allen et al. 2009 for references). One of them is the
8
so-called “phylogenetic entropy” (PE; Allen et al. 2009). PE generalises the Shannon index
9
to incorporate species relatedness, using the branch lengths of a rooted phylogenetic tree. 10
PE is aimed to help conservation management decisions, by favouring communities in 11
which highly distinct species are more abundant, and presents “weak species monotonicity” 12
(Weikard et al. 2006), which ensures protection to rare species. One of the promising
13
features of this index is the possibility to use functional, instead of phylogenetic, 14
relatedness and so to include abundance in functional diversity. 15
Even if it is possible to include abundance in dendrogram-based functional diversity 16
measures, this inclusion will only be justified if our predictive power in relating functional 17
diversity to community functioning increases. Studying a southern cerrado site at fine-18
scale, we measured functional traits of woody species and used litter decomposition rate as 19
a surrogate for community functioning, since decomposition is important in nutrient 20
cycling and may be more related to functional diversity than to traditional diversity 21
measures (Scherer-Lorenzen 2008). We presented extensions of both FD and PE to obtain 22
measures of functional diversity that take abundance into account and, in one case, 23
traditional diversity measures, the inclusion of functional traits leads to an increased 1
predictive power in relating functional diversity to community functioning; (2) to 2
demonstrate that it is possible to include abundance in dendrogram-based functional 3
diversity, and (3) to test whether, when compared to FD as usually calculated, the inclusion 4
of abundance leads to an increased predictive power. 5
6
METHODS
7
8
We carried out this study in a woodland savanna site, with 86 ha, at Federal University of 9
São Carlos, southeastern Brazil (21º58’ S, 47º51’ W and 22o 00’ S, 47º52’ W). The site is 10
under Cwa climate (Köppen 1931), with wet summer and dry winter. Mean annual rainfall 11
and temperature lie around 1500 mm and 21ºC, respectively. We established a 50 m x 50 m 12
grid, with 100 contiguous plots, each one with 25 m2, where we sampled all woody 13
individuals with stem diameter at soil level equal to or larger than 3 cm (SMA 1997), 14
identifying them to species level. For each individual, we measured eight functional traits 15
related to nutrient cycling, according to Cornelissen et al. (2003): leaf size, specific leaf
16
area, leaf dry matter content, stem specific density, height, basal area, resprouting capacity, 17
and bark thickness. We collected the data from March 2009 to May 2010, measuring leaf 18
traits during the rainy season, when productivity was higher, as recommended by 19
Cornelissen et al. (2003). The way we measured each functional trait is described in detail
20
in Cornelissen et al. (2003).
21
we gently brushed the material to remove soil particles and other debris, oven-dried the 1
bags at 80°C for 24 h, and weighted them. Comparing the initial and the final masses, we 2
found the amount of litter that was decomposed. For each plot and each month, thus, we 3
found the average remaining amount of matter. Since the exponential model describes best 4
the loss of mass over time during litter decomposition (Wieder & Lang 1982), we adjusted 5
the values to an exponential equation (y = aekt), in which k is the coefficient of
6
decomposition, y is the remaining mass in time t, and a is the initial mass. After collecting
7
the data in field, we obtained three matrices: the first one with individuals in rows, 8
functional traits in columns, and trait values in entries; the second one with species in rows, 9
functional traits in columns, and average trait values in entries; and the third one with 10
decomposition rates per plot. 11
To answer the first question, for each plot, we calculated species richness (s), Shannon 12
index (H’), and FD. To calculate FD (Petchey & Gaston 2002, 2006), we used the second 13
matrix, standardised the variables to zero mean and unit variance, converted it into a 14
distance matrix with Euclidean distances, produced a dendrogram by clustering the distance 15
matrix with unweighted pair group method with arithmetic averages, and calculated the 16
total branch length of the dendrogram necessary to connect all species in a given plot. We 17
tested whether the data were spatially autocorrelated by appling the Moran test (Legendre 18
& Legendre 1998). As long as they were not, we used simple linear regression analyses 19
(Zar 1999), in which the decomposition rate was the response variable and s, H’, or FD 20
were the explanatory variable. We tested the relationships for significance and compared 21
their coefficients of determination (R2), used as a measure of fit (Zar 1999). 22
To answer the second question, we included abundance in functional diversity using four 23
methods: (1) individual-based functional diversity (iFD; Cianciaruso et al. 2009), calculated
the same way as FD, but with the first matrix, with individuals in rows – with this index, 1
we included not only abundance, but also intraspecific variation; (2) a new index we called 2
“abundance-weighted functional diversity” (awFD), in which the second matrix, that with
3
species in rows, is weighted by a relative abundance vector – then we calculated it the same 4
way as FD; (3) a new index we called “branch-weighted functional diversity” (bwFD),
5
calculated the same way as FD, but, when calculating the total branch length, we weighted 6
the terminal branches, which represent the unique contribution of a given species to FD, by 7
its relative abundance; (4) functional entropy (FE), calculated the same way as 8
phylogenetic entropy (Allen et al. 2009), but using a functional dendrogram produced from
9
the second matrix instead of a phylogenetic tree. We calculated Spearman's rank correlation 10
coefficient (Zar 1999) among all diversity measures. 11
To answer the third question, we did simple linear regression analyses (Zar 1999), in 12
which the decomposition rate was the response variable and iFD, awFD, bwFD, or FE were
13
the explanatory variable. We tested the relationships for significance and compared their 14
coefficients of determination (Zar 1999). We carried out all analyses in R (R Development 15
Core Team 2009), using the “ade4” (Dray & Dufour 2007), “ape” (Paradis et al. 2004), and
16
“vegan” (Oksanen et al. 2009) packages. We also wrote a code to calculate functional – or
17
phylogenetic – entropy, which is available online (cerradoecology.com). 18
19
RESULTS
20
21
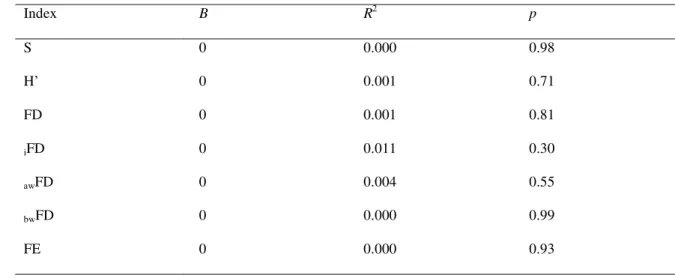
diversity and, in all cases, explanatory power was very low (Table 2; Fig. 1). We 1
demonstrated that the inclusion of abundance in functional diversity is possible, even 2
though most indices were significantly correlated with each other (Fig. 2). When compared 3
to FD as usually calculated, the inclusion of abundance did not lead to an increased 4
predictive power. The decomposition rate was not significantly related to individual-based 5
functional diversity, abundance-weighted functional diversity, branch-weighted functional 6
diversity, or functional entropy and, in all cases, explanatory power was very low (Table 2; 7
Fig. 1). 8
9
DISCUSSION
10
11
We expected that functional diversity would be a better predictor than traditional diversity 12
measures, such as species richness and Shannon index (Díaz & Cabido 2001, Petchey 13
2004). However, this expectation was not corroborated, as we did not find any relationship 14
between decomposition and either traditional or functional diversity indices. The absence of 15
relationship between functional diversity and litter decomposition rates may be due to five 16
reasons (Petchey & Gaston 2006): (1) unimportant traits considered, (2) inappropriate 17
measures of functional diversity, (3) another process or factor more important than 18
functional diversity, (4) statistical power, or (5) absence of effect of functional diversity on 19
community functioning. The first reason is unlikely, since we chose traits directly related to 20
functioning (Cornelissen et al. 2003). So is the second reason, since FD and FE are
21
appropriate measures of functional diversity (Petchey & Gaston 2006, Allen et al. 2009),
22
and the extensions of the former, have the advantage of taking abundance into account. Our 23
that either other processes or factors are more important or that functional diversity has no 1
effect on decomposition rates. 2
Plant community influence decomposition processes and nutrient cycling either directly, 3
by litter quality, or indirectly, by creating unique micro-environment conditions (Scherer-4
Lorenzen 2008, Vivanco & Austin 2008). Living plant functional traits arelinked to litter 5
decomposability (Cornelissen & Thompson 1997, Cornwell et al. 2008), especially
6
considering that green and litter leaves traits are correlated with decomposition in 7
equivalent ways (Hättenschwiler et al. 2011). Although green leaf traits can predict even
8
better decomposition rates (Bakker et al. 2011), litter leaf traits are more associated to
9
decomposability (Cornwell et al. 2008, Zhang et al. 2008) due to emergent propreties and
10
synergistic efects among litter leaves from different species (Gartner & Cardon 2004, 11
Hättenschwiler et al. 2005). To assess plant functional diversity effects on decomposition
12
rate, we isolated the litter quality, homogenising the material in the litterbags. Maybe we 13
could not find a relationship, because indirect effects of plant traits on decomposition were 14
very low compared to effects of litter quality. Alternatively, the complementarity among 15
decomposers and detritivores may be more important to decomposition (David & Handa 16
2010, Gessner et al. 2010). The impacts of decomposer diversity on the stability of
17
essential functions differ between plant communities (Eisenhauer & Shäudler 2011) and are 18
dependent of several trophic levels (Gessner et al. 2010, Eisenhauer & Shäudler 2011).
19
Thus, indirect effects of plant traits in creating micro-habitats may not be linear to the 20
decomposer diversity. 21
functional diversity that include abundance have been developed (Rao 1982, Mason et al.
1
2003; Mouillot et al. 2005, Botta-Dukát 2005). These indices are an improvement in
2
relation to those of functional richness, but they present some undesirable properties: some 3
are designed to work with only one trait at a time; others violate set monotonicity (Petchey 4
& Gaston 2006). As originally concepted, FD is a functional richness measure, since it does 5
not take abundances into account (Botta-Dukát 2005, Pechey & Gaston 2006). 6
Nevertheless, we demonstrated that it is possible to include species abundances into FD and 7
that is possible to do that in different ways. Even if in our study the inclusion of abundance 8
into FD did not increase its predictive power, there may be situations in which that 9
inclusion will increase it. 10
Each measure we applied required a similar sampling effort, except iFD. To calculate
11
FD, awFD, bwFD, and FE, it would be necessary to measure functional traits of 10
12
individuals per species (as indicated for FD; Cornelissen et al. 2003) and to count the
13
number of individuals present in each plot. For some species with less than 10 individuals 14
in the plots, an additional sampling effort could be necessary to find individuals outside the 15
plots. In the case of iFD, all individuals should be measured, what could represent an
16
extremely higher effort in terms of time and money. For example, in our study, since we 17
found 60 species, one would have to sample only 600 individuals, instead of 1995, to 18
calculate FD, awFD, bwFD, and FE. However, there may be situations in which sampling all
19
individuals is recommended. For example, when intraspecific variability is high, the 20
relationship between FD and iFD becomes weak (Cianciaruso et al. 2009). In such a case,
21
including intraspecific variation should allow a more complete understanding of the 22
processes that link diversity and community functioning (Cianciaruso et al. 2009).
Most of the indices we proposed were correlated with species richness and FD, what is 1
supposed to happen when species are equally complementary (Pechey & Gaston 2006). If 2
one uses many functional traits and if they are uncorrelated, then there woud be potential 3
for separation of species in high-dimensional trait space (Petchey & Gaston 2002). The 4
high-dimensional trait space allows all species to differ equally, that is, all species can be 5
equidistant in trait space (Petchey & Gaston 2002). If so, one would expect a linear 6
relationship between species richness and FD (Petchey & Gaston 2002), as we found. 7
Conversely, the weak, albeit significant, correlation between FD and iFD indicated a
8
relatively high intraspecific variability. Intraspecific variability highlights processes linking 9
individuals and community and may provide better predictions of the effects of 10
environmental changes on both biodiversity and community functioning (Cianciaruso et al.
11
2009, Jung et al. 2010). However, since the sampling effort necessary to calculate iFD is
12
much higher than for any other indices, its use must be considered in a cost-benefit 13
analysis. 14
Different distribution of abundances will lead to different correlation coefficients among 15
the indices we proposed. When the most abundant species are also the most complementary 16
ones, there will be weak correlations between FD and the new indices. All indices would 17
help one to predict how the loss of one species influences functional diversity, since it 18
depends on how abundance is related to both the order species are lost and the functional 19
distances (Petchey & Gaston 2006). Thus, in a worst-case scenario, when a rare and 20
complementary species is lost, one could expect lower values of awFD, bwFD, iFD, and FE
21
We also expected that the inclusion of abundance in functional diversity would result in 1
more predictive measures of diversity (Petchey & Gaston 2006). However, the indices we 2
proposed did not increase our predictive capacity in the cerrado data set. Assuming that the 3
main criterion for the selection of an index is whether it accurately measures what it is 4
intended to describe (Schleuter et al. 2010), the new indices we applied brought no extra
5
advantage over FD and PE, because we did not find significant relationships between them 6
and litter decomposition. Nevertheless, there may be situations in which the new indices 7
will predict community functioning better. For instance, when one is working at larger 8
scales, with other vegetation types, or other descriptors of community functioning. 9
Depending on the characteristics of the community, an index can be more appropriate 10
than other. A good way to choose an appropriate index is by its response to loss or addition 11
of species and to changes in species abundances (Petchey & Gaston 2006). However, the 12
effects of changing species dominance in functional diversity and properties of 13
communities are much less investigated than effects of species loss (Hillebrand et al. 2008).
14
When any factor changes species distributions, functional trait distribution also changes. 15
Consequently, the magnitude of inter- and intraspecific relationships, community dynamics, 16
and processes dependent of abundance are also modified (Hillebrand et al. 2008). Since
17
species richness and evenness are not always positively correlated, one should consider 18
whether the prediction depends on species abundance distributions (Hillebrand et al. 2008).
19
Moreover, the data set in question, its dimensionality, and the type of variables available 20
are also important when choosing an index (Schleuter et al. 2010). Thus, by incorporating
21
species abundances into a dendrogram-based measure of diversity, we showed that it is 22
possible to combine the best of both worlds. 23
ACKNOWLEDGMENTS
1
2
We are grateful to Fapesp and CAPES, for financial support and for the scholarship granted 3
to the first author; to CNPq, for the fellowship granted to the last author; to D.M. Silva, for 4
valuable help in field and with the analyses; to P. Dodonov, J.R Freitas, M. Geraldo, C.S. 5
Gonçalves, P.P. Loiola, N.B. Rosatti, R.O. Xavier, for help in field. 6
7
LITERATURE CITED
8
9
ALLEN, B., M. KON, AND Y. BAR-YAM. 2009. A new phylogenetic diversity measure
10
generalizing the Shannon index and its application to phyllostomid bats. Am. Nat. 11
174: 236–243. 12
BAKKER, M. A., G. CARREÑO-ROCABADO, AND L. POORTER. 2011. Leaf economics traits
13
predict litter decomposition of tropical plants and differ among land use types. 14
Funct. Ecol. 25: 473–483. 15
BERTNESS, M. D., AND R. CALLAWAY. 1994. Positive interactions in communities. Trends
16
Ecol. Evol. 9: 191–193. 17
BOTTA-DUKÁT, Z. 2005. Rao’s quadratic entropy as a measure of functional diversity based
18
on multiple traits. J. Veg. Sci.16: 533–540. 19
CIANCIARUSO, M. V., M. A. BATALHA, K. J. GASTON, AND O. L. PETCHEY. 2009. Including
20
intraspecific variability in functional diversity. Ecology 90: 81–89.
21
CORNELISSEN, J. H. C., AND K. THOMPSON. 1997. Functional leaf attributes predict litter
CORNELISSEN, J. H. C., S. LAVOREL, E. GARNIER, S. DÍAZ, N. BUCHMANN, D. E. GURVICH,
1
P. B. REICH, H. TER STEEGE, H. D. MORGAN, M. G. A. VAN DER HEIJDEN, J. G.
2
PAUSAS, AND H. POORTER. 2003. A handbook of protocols for standardised and
3
easy measurement of plant functional traits worldwide. Aust. J. Bot. 51: 335–380. 4
CORNWELL, W. K., J. H. C. CORNELISSEN, K. AMATANGELO, E. DORREPAAL, V. T. EVINER,
5
O. GODOY, S. E. HOBBIE, B. HOORENS, H. KUROKAWA, N. PEREZ- HARGUINDEGUY,
6
H. M. QUESTED, L. S. SANTIAGO, D. A. WARDLE, I. J. WRIGHT, R. AERTS, S. D.
7
ALLISON, P. VAN BODEGOM, V. BROVKIN, A. CHATAIN, T. V. CALLAGHAN, S. DÍAZ,
8
E. GARNIER, D. E. GURVICH, E. KAZAKOU, J. A. KLEIN, J. READ, P. B. REICH, N. A.
9
SOUDZILOVSKAIA, M. V. VAIERETTI, AND M. WESTOBY. 2008. Plant species traits
10
are the predominant control on litter decomposition rates within biomes worldwide. 11
Ecol. Lett. 11: 1065–1107. 12
DAVID, J. F., AND I. T. HANDA. 2010. The ecology of saprophagous macroarthropods
13
(millipedes, woodlice) in the context of global change. Biol. Rev. 85: 881–895. 14
DÍAZ, S., AND M. CABIDO. 2001. Vive la différence: plant functional diversity matters to
15
ecosystem processes. Trends Ecol. Evol.16: 646–655. 16
DRAY, S., AND A. B. DUFOUR. 2007. The ade4 package: implementing the duality diagram
17
for ecologists. J. Stat. Softw. 22: 1–20. 18
EISENHAUER, N., AND M. SCHÄUDLER. 2011. Inconsistent impacts of decomposer diversity
19
on the stability of aboveground and belowground ecosystem functions. Oecologia 20
165: 403–415. 21
GARTNER, T. B., AND Z. G. CARDON. 2004. Decomposition dynamics in mixed-species leaf
22
GESSNER, M. O., C. M. SWAN, C. K. DANG, B. G. MCKIE, R. D. BARDGETT, D. H. WALL,
1
AND S. HÄTTENSCHWILER. 2010. Diversity meets decomposition. Trends Ecol. Evol.
2
25: 372–380. 3
HÄTTENSCHWILER, S., A. V. TIUNOV, AND S. SCHEU. 2005. Biodiversity and litter
4
decomposition in terrestrial ecosystems. Annu. Rev. Ecol. Evol. Syst.36: 191–218. 5
HÄTTENSCHWILER, S., S. COQ, S. BARANTAL, AND I. T. HANDA. 2011. Leaf traits and
6
decomposition in tropical rainforests: revisiting some commonly held views and 7
towards a new hypothesis. New Phytol.189: 950–965. 8
HILLEBRAND, H., D. M. BENNETT AND M. W. CADOTTE. 2008. Consequences of
9
dominance: a review of eveness effects on local and regional ecosystem processes. 10
Ecology 89: 1510–1520. 11
HILLEBRAND, H., AND B. MATTHIESSEN. 2009. Biodiversity in a complex world:
12
consolidation and progress in functional biodiversity research. Ecol. Lett.12: 1405– 13
1419. 14
HOOPER, D. U., AND P. M. VITOUSEK. 1997. The effects of plant composition and diversity
15
on ecosystem processes. Science 227: 1302–1305. 16
JOSHI, J., D. MATTHIES, AND B. SCHMID. 2000. Root hemiparasites and plant diversity in
17
experimental grassland communities. J. Ecol.88: 634–644. 18
JUNG, V., C. VIOLLE, C. MONDY, L. HOFFMANN, AND S. MULLER. 2010. Intraspecific
19
variability and trait-based community assembly. J. Ecol. 98: 1134–1140. 20
KÖPPEN, W. 1931. Grundriss der Klimakunde. Gruyter, Berlin.
21
LEGENDRE, P., AND L. LEGENDRE. 1998. Numerical ecology, 2nd English edn. Elsevier,
MASON, N. W.H., K. MACGILLIVRAY, J. B. STEEL, AND J. B. WILSON. 2003. An index of
1
functional diversity. J. Veg. Sci. 14: 571–578. 2
MASON, N. W. H., D. MOUILLOT, W. G. LEE, AND J. B. WILSON. 2005. Functional richness,
3
functional evenness and functional divergence: the primary components of 4
functional diversity. Oikos 111: 112–118. 5
MOUILLOT, D., W. H. NORMAN MASON, O. DUMAY, AND J. BASTOW WILSON. 2005.
6
Functional regularity: a neglected aspect of functional diversity. Oecologia 142: 7
353–359. 8
OKSANEN, J., R. KINDT, P. LEGENDRE, B. O'HARA, G. L. SIMPSON, P. SOLYMOS, M. H. H.
9
STEVENS, AND H. WAGNER. 2009. vegan: Community Ecology Package. R package
10
version 1.15-2. http://cran.r-project.org/, http://vegan.r-forge.r-project.org/ 11
PACHEPSKY, E., J. W. CRAWFORD, J. L. BOWN AND G.SQUIRE. 2001. Towards a general
12
theory of biodiversity. Nature 410: 923– 926. 13
PARADIS, E., J. CLAUDE, AND K. STRIMMER. 2004. APE: analyses of phylogenetics and
14
evolution in R language. Bioinformatics 20: 289–290. 15
PETCHEY, O. L. 2004. On the statistical significance of functional diversity. Funct. Ecol.
16
18: 297–303. 17
PETCHEY, O. L., AND K. J. GASTON. 2002. Functional diversity (FD), species richness and
18
community composition. Ecol. Lett. 5: 402–411. 19
PETCHEY, O. L., A. HECTOR, AND K. J. GASTON. 2004. How do measures of functional
20
diversity perform? Ecology 85: 847–857. 21
PETCHEY, O. L., AND K. J. GASTON. 2006. Functional diversity: back to basics and looking
22
forward. Ecol. Lett.9: 741–758. 23
R DEVELOPMENT CORE TEAM. 2008. R: A language and environment for statistical
computing. R Foundation for Statistical Computing, Vienna, Austria. ISBN
3-1
900051-07-0, URL http://www.R-project.org. 2
RAO, C. R. 1982. Diversity and dissimilarity coefficients: a unified approach. Theor. Popul.
3
Biol. 21: 24–43. 4
REISS, J., J. R. BRIDLE, J. M. MONTOYA, AND G. WOODWARD. 2009. Emerging horizons in
5
biodiversity and ecosystem functioning research. Trends Ecol. Evol. 24: 505– 514. 6
RICOTTA, C. 2005. Through the jungle of biological diversity. Acta Biotheor.53: 29–38.
7
ROUSSEAU, R., P. VAN HECKE, D. NIJSSEN, AND J. BOGAERT. 1999. The relationship
8
between diversity profiles, evenness and species richness based on partial ordering. 9
Environ. Ecol. Stat. 6: 211–223. 10
SCHERER-LORENZEN, M. 2008. Functional diversity affects decomposition processes in
11
experimental grasslands. Funct. Ecol. 22: 547–555. 12
SCHLEUTER, D., M. DAUFRESNE, F. MASSOL, AND C. ARGILLIER. 2010. A user’s guide to
13
functional diversity indices. Ecol. Monogr. 80: 469–484. 14
SMA. SECRETARIA DE ESTADO DO MEIO AMBIENTE. 1997. Cerrado: bases para
15
conservação e uso sustentável das áreas de cerrado do estado de São Paulo. SMA,
16
São Paulo. 17
TILMAN, D., J. KNOPS, D. WEDIN, P. REICH, M. RITCHIE, AND E. SIEMANN. 1997. The
18
influence of functional diversity and composition on ecosystem processes. Science 19
277: 1300–1302. 20
VILLÉGER, S., N. W. H. MASON, AND D. MOUILLOT. 2008. New multidimensional
21
VIVANCO, L., AND A. T. AUSTIN. 2008. Tree species indentity altes forest litter
1
decomposition through long-term plant and soil interactions in Patagonia, 2
Argentina. J. Ecol.96: 727–736. 3
WEIKARD, H., M. PUNT, AND J. WESSELER. 2006. Diversity measurement combining
4
relative abundances and taxonomic distinctiveness of species. Divers. Distrib. 12: 5
215–217. 6
WHITTAKER, R. H. 1965. Dominance and diversity in land plant communities. Science 147:
7
250–260. 8
WIEDER, R. K., AND G. E. LANG. 1982. A critique of the analytical methods used in
9
examining decomposition data obtained from litter bags. Ecology 63: 1636–1642. 10
ZAR, J. H. 1999. Biostatical analysis. Prentice Hall, Upper Saddle River.
11
ZHANG, D., D. HUI, Y. LUO, AND G. ZHOU. 2008. Rates of litter decomposition in terrestrial
12
ecosystems: global patterns and controlling factors. J. Plant Ecol. 1: 85–93. 13
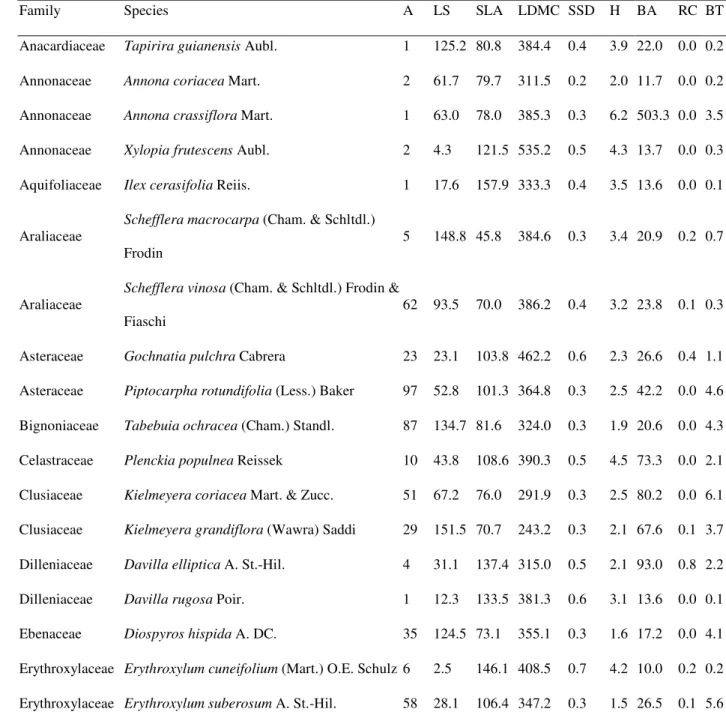
TABLE 1. Abundance and mean trait values for woody species sampled in a woodland
1
cerrado, southeastern Brazil (approximately, 21°58’05.3” S, 47°52‘10.1” W). A=
2
abundances, LS = leaf size (cm2), SLA = specific leaf area (cm2/g), LDMC = leaf dry
3
matter content (mg/g), SSD = specific stem density (g/cm3), H = height (m), BA = basal
4
area (cm2), RC = resprouting capacity (resprout/ind), BT = bark thickness (mm).
5
Family Species A LS SLA LDMC SSD H BA RC BT
Anacardiaceae Tapirira guianensis Aubl. 1 125.2 80.8 384.4 0.4 3.9 22.0 0.0 0.2
Annonaceae Annona coriacea Mart. 2 61.7 79.7 311.5 0.2 2.0 11.7 0.0 0.2
Annonaceae Annona crassiflora Mart. 1 63.0 78.0 385.3 0.3 6.2 503.3 0.0 3.5
Annonaceae Xylopia frutescens Aubl. 2 4.3 121.5 535.2 0.5 4.3 13.7 0.0 0.3
Aquifoliaceae Ilex cerasifolia Reiis. 1 17.6 157.9 333.3 0.4 3.5 13.6 0.0 0.1
Araliaceae Schefflera macrocarpa (Cham. & Schltdl.) Frodin
5 148.8 45.8 384.6 0.3 3.4 20.9 0.2 0.7
Araliaceae
Schefflera vinosa (Cham. & Schltdl.) Frodin &
Fiaschi
62 93.5 70.0 386.2 0.4 3.2 23.8 0.1 0.3
Asteraceae Gochnatia pulchra Cabrera 23 23.1 103.8 462.2 0.6 2.3 26.6 0.4 1.1
Asteraceae Piptocarpha rotundifolia (Less.) Baker 97 52.8 101.3 364.8 0.3 2.5 42.2 0.0 4.6
Bignoniaceae Tabebuia ochracea (Cham.) Standl. 87 134.7 81.6 324.0 0.3 1.9 20.6 0.0 4.3
Celastraceae Plenckia populnea Reissek 10 43.8 108.6 390.3 0.5 4.5 73.3 0.0 2.1
Clusiaceae Kielmeyera coriacea Mart. & Zucc. 51 67.2 76.0 291.9 0.3 2.5 80.2 0.0 6.1
Clusiaceae Kielmeyera grandiflora (Wawra) Saddi 29 151.5 70.7 243.2 0.3 2.1 67.6 0.1 3.7
Dilleniaceae Davilla elliptica A. St.-Hil. 4 31.1 137.4 315.0 0.5 2.1 93.0 0.8 2.2
Dilleniaceae Davilla rugosa Poir. 1 12.3 133.5 381.3 0.6 3.1 13.6 0.0 0.1
Ebenaceae Diospyros hispida A. DC. 35 124.5 73.1 355.1 0.3 1.6 17.2 0.0 4.1
Erythroxylaceae Erythroxylum tortuosum Mart. 51 52.2 99.2 328.7 0.3 1.3 32.8 0.0 6.4
Euphorbiaceae Pera glabrata Poepp. ex Baill. 18 35.2 70.2 428.9 0.5 5.6 120.5 0.2 0.6
Fabaceae Acosmium dasycarpum (Vogel) Yakovlev 19 99.5 105.2 299.4 0.3 1.8 26.5 0.1 7.9
Fabaceae Acosmium subelegans (Mohlenbr.) Yakovlev 4 50.4 81.4 358.2 0.5 2.2 33.1 0.0 6.6
Fabaceae Bauhinia rufa (Bong.) Steud. 26 66.3 86.7 424.6 0.5 3.1 10.6 0.0 0.8
Fabaceae Dalbergia miscolobium Benth. 43 55.2 63.1 440.9 0.4 7.6 355.9 0.0 9.3
Fabaceae Dimorphandra mollis Benth. 8 256.0 145.1 354.2 0.4 3.3 42.5 0.0 6.6
Fabaceae Macherium acutifolium Vogel 4 82.7 90.4 419.1 0.5 3.5 60.4 0.0 7.4
Fabaceae Stryphnodendron adstringens (Mart.) Coville 44 267.1 80.1 339.8 0.4 2.4 45.2 0.0 2.9
Fabaceae Stryphnodendron obovatum Benth. 30 159.1 94.1 342.8 0.6 3.0 14.8 0.0 1.3
Lauraceae Ocotea pulchella (Nees) Mez 43 12.9 77.0 462.9 0.5 4.3 55.8 0.2 0.5
Malpighiaceae Banisteriopsis megaphylla (A. Juss.) B. Gates 1 3.7 123.6 256.1 0.4 5.6 42.7 0.0 0.5
Malpighiaceae Byrsonima coccolobifolia Kunth 60 42.1 112.9 351.9 0.3 2.2 24.2 0.1 1.5
Malpighiaceae Byrsonima verbascifolia (L.) DC. 2 148.7 68.5 377.4 0.3 3.0 118.1 0.0 3.2
Malpighiaceae Heteropterys umbellata A. Juss. 4 5.8 125.4 379.2 0.7 2.5 12.8 0.3 0.4
Melastomataceae Leandra lacunosa Cogn. 2 12.9 75.3 364.7 0.9 2.1 15.4 0.0 0.6
Melastomataceae Miconia albicans (Sw.) Triana 117 28.3 74.6 453.7 361.3 2.8 97.8 1.0 1.1
Melastomataceae Miconia ligustroides (DC.) Naudin 10 14.5 102.0 368.0 0.5 2.7 21.2 0.0 0.3
Melastomataceae Miconia rubiginosa (Bonpl.) DC. 1 30.2 67.8 437.2 0.6 4.0 35.6 0.0 2.8
Myrsinaceae Rapanea ferruginea (Ruiz & Pav.) Mez in Urb. 6 15.9 128.1 370.8 0.5 4.1 32.8 0.0 0.6
Myrsinaceae Rapanea guianensis Aubl. 1 22.3 56.6 381.7 0.6 4.4 87.8 1.0 0.8
Myrsinaceae Rapanea umbellata (Mart.) Mez 557 27.7 79.5 374.4 0.5 3.6 16.4 0.1 0.4
Myrtaceae Campomanesia adamantium (Cambess.) O.Berg
22 25.8 108.8 383.9 0.5 2.1 11.2 0.1 0.9
Myrtaceae Myrcia bella Cambess. 42 5.6 88.4 404.7 0.4 2.7 29.7 0.0 6.4
Myrtaceae Myrcia fallax DC. 6 25.0 165.2 408.7 0.6 3.2 12.2 0.0 0.3
Myrtaceae Myrcia rostrata DC. 4 6.8 74.7 489.1 0.5 3.3 22.1 0.0 2.0
Myrtaceae Myrcia tomentosa (Aubl.) DC. 4 15.5 113.2 382.0 0.5 3.5 29.5 0.3 0.2
Myrtaceae Psidium lauroteanum Cambess. in A.St.-Hil. 2 16.1 66.7 480.4 0.5 4.2 12.7 0.0 3.4
Nyctaginaceae Guapira noxia (Netto) Lundell 4 49.5 119.9 214.7 0.3 2.1 250.4 0.5 14.5
Nyctaginaceae Guapira opposita (Vell.) Reitz 3 33.4 115.6 289.2 0.5 2.0 17.1 0.0 1.2
Ochnaceae Ouratea spectabilis (Mart. ex Engl.) Engl. 3 28.0 56.5 430.5 0.4 2.4 49.7 0.0 4.4
Phyllanthaceae Phyllanthus acuminatus Vahl 2 4.4 172.6 440.7 0.4 4.2 11.7 0.0 0.2
Rubiaceae Palicourea rigida (Cham.) K.Schum. 1 161.3 86.1 301.2 0.2 1.8 35.6 0.0 6.8
Rubiaceae Rudgea viburnoides (Cham.) Benth. 11 46.2 76.7 287.4 0.3 3.2 39.6 0.2 2.7
Rubiaceae
Tocoyena formosa (Cham. & Schltdl.)
K.Schum.
41 116.9 96.9 335.2 0.4 2.5 17.9 0.0 0.4
Rutaceae Zanthoxyllum rhoifolium Lam. 3 45.4 104.6 397.6 0.5 4.0 26.2 0.0 0.3
Salicaceae Casearia sylvestris Sw. 6 11.3 144.1 342.7 0.3 1.9 16.1 0.2 4.2
Styracaceae Styrax ferrugineus Nees & Mart. 9 27.5 81.3 433.4 0.3 3.0 77.0 0.1 7.0
Thymelaeaceae Daphnopsis fasciculata (Meissn.) Nevl. 4 8.1 88.2 393.8 0.4 4.6 22.4 0.0 0.1
Verbenaceae Aegiphilla lhotzkiana Cham. 8 123.7 168.6 210.0 0.2 2.9 28.2 0.0 5.7
Vochysiaceae Vochysia tucanorum Mart. 165 19.9 116.8 274.6 0.4 3.2 46.1 0.1 0.7
TABLE 2. Slope (b), coefficient of determination (R2), and p-values (p) for simple linear
1
regressions between decomposition rate as response variable and richness (s), Shannon
2
index (H’), functional diversity (FD), individual-based functional diversity (iFD),
3
abundance-weighted functional diversity (awFD), branch-weighted functional diversity
4
(bwFD), and functional entropy (FE) as explanatory variables. Data collected for woody
5
species in a woodland cerrado, southeastern Brazil (approximately, 21°58’05.3” S,
6
47°52‘10.1” W).
7
Index B R2 p
S 0 0.000 0.98
H’ 0 0.001 0.71
FD 0 0.001 0.81
iFD 0 0.011 0.30
awFD 0 0.004 0.55
bwFD 0 0.000 0.99
FE 0 0.000 0.93
8
FIGURE 1. Decomposition rate (k) in relation to (A) richness (s), (B) Shannon index (H’), 1
(C) functional diversity (FD), (D) individual-based functional diversity (iFD), (E)
2
abundance-weighted functional diversity (awFD), (F) branch-weighted functional diversity
3
(bwFD), and (G) functional entropy (FE). Data collected for woody species in a woodland
4
cerrado, southeastern Brazil (approximately, 21°58’05.3”S, 47°52‘10.1”W). 5
6
FIGURE 2. Pairwise Spearman's rank correlation coefficients among richness (s), Shannon 7
index (H’), functional diversity (FD), individual-based functional diversity (iFD),
8
abundance-weighted functional diversity (awFD), branch-weighted functional diversity
9
(bwFD), and functional entropy (FE) for woody species sampled in a woodland cerrado,
10
southeastern Brazil (approximately, 21°58’05.3”S, 47°52‘10.1”W). Tukey's running 11
median smoothing line in black. * P < 0.05, ** P < 0.01, *** P < 0.001.
S
1.0 2.0
0.77 0.64
4 8 12
0.53 0.56 20 80 0.28 4 8 1 2 0.42 1 .0 2 .0
H' 0.40 0.41 0.28 0.08 0.51
FD 0.83 0.82 0.29
1 0 3 0 5 0 0.76 4 8 1 2
bw FD 0.66 0.18 0.79
aw FD 0.45
2 0 4 0 6 0 0.57 2 0 8 0 iFD 0.0017
4 8 12 10 30 50 20 40 60 4 6 8