http://dx.doi.org/10.1590/0104-530X1960-16
Resumo: São notáveis, ainda que insuicientes, os esforços empreendidos por pesquisadores, visando compreender a dinâmica relacionada ao processo de prevenção de acidentes de trabalho. A incidência de tais eventos implica signiicativas perdas para a sociedade, para as organizações e para as famílias, além dos próprios indivíduos acidentados. Para esse fenômeno, ainda presente nas organizações contemporâneas, não basta uma visão unicamente mecanicista, mas o entendimento das relações interpessoais no contexto laboral, o que remete à cultura organizacional. A partir de uma análise quantitativa, este trabalho buscou testar um modelo de diagnóstico de cultura de segurança do trabalho, presente na literatura na indústria de mineração brasileira. A partir dos resultados iniciais e de requisitos apontados por um grupo de especialistas da área de segurança, ajustes foram sugeridos e o modelo foi novamente testado. Os resultados validaram o modelo construído e ajustado para esta pesquisa e indicaram que os fatores constituintes da cultura de segurança na realidade estudada foram: aprendizagem organizacional, informação e comprometimento.
Palavras-chave: Diagnóstico de segurança; Segurança do trabalho; Cultura de segurança; Indústria de mineração. Abstract: The efforts made by researchers to understand the dynamics of work-related accident prevention are remarkable but not enough to exhaust the subject. The occurrence of such events implies signiicant losses for society, organizations and families, in addition to the injured individuals subject to the accident. This kind of phenomenon that still happens in contemporary organizations requires not only a purely mechanistic view but also the understanding of interpersonal relations in the employment context, which refers to the organizational culture. As a quantitative analysis, this study aimed to test a model related to the culture of safety in workplace, present in the literature, in the Brazilian mining industry. Based on the initial results and on the requirements pointed out by a group of security experts in this ield, we suggested adjustments in the model and it was re-tested. The results conirmed the model applied in this study and they indicated that factors related to the culture of safety in this speciic environment are organizational learning, information and commitment.
Keywords: Assessment of safety; Labor safety; Culture of safety; Mining industry.
Factors that make up safety culture:
a look at mining industry
Fatores constituintes da cultura de segurança: olhar sobre a indústria de mineração
Anna Silvia Vassem1
Graziela Fortunato2
Sérgio Augusto Pereira Bastos1
Moisés Balassiano2
1 Fundação Instituto Capixaba de Pesquisas em Contabilidade, Economia e Finanças – FUCAPE Business School, Av. Fernando
Ferrari, 1358, Boa Vista, CEP 29075-505, Vitória, ES, Brazil, e-mail: [email protected]; [email protected]
2 Escola de Negócios – IAG, Pontifícia Universidade Católica do Rio de Janeiro – PUC-Rio, Rua Marquês de São Vicente, 225, Gávea,
CEP 22451-900, Rio de Janeiro, RJ, Brazil, e-mail: [email protected]; [email protected] Received July 8, 2016 - Accepted Sept. 6, 2017
Financial support: None.
1 Introduction
The issue of occupational safety has been a matter of concern in organizations and academia due to the relevance of the inancial and non-inancial losses resulting from fatalities, injuries and diseases, which impact organizations, society, the families of the victims and, of course, the victims themselves.
In Brazil, the number of occupational accidents has remained high. In 2010, 2011, and 2012, respectively, there were 709,474, 720,629 and 705,239 occupational
concentrate efforts on observable behavior, individual and isolated, disregarding the cultural processes that contribute to the occurrence work-related accidents.
Therefore, whenever aspects related to workplace safety laws cannot be clariied after investigations, answers are sought in the organizational culture, according to Guldenmund (2010). Since this concept was presented in the Chernobyl nuclear accident investigation report, it has been considered a key factor for safety in organizations (Naevestad, 2009).
The safety culture has been understood as a result of the perceptions, attitudes and behaviors of individuals in organizations, since the organizational context can model behaviors in terms of importance and probability (Harvey et al., 2002). Naevestad (2009) discusses two main approaches: functionalist and interpretive. The irst, the basis of this study, focuses on the power of cultural transformation on managers and the sharing of patterns of behavior. The second is structured through the interaction of the members of the organization, through the sharing of patterns of meanings.
Many taxonomies have been developed by researchers, such as Geller (1994), Hudson (2003) and Westrum (2004), to categorize the possible stages of the safety culture and seek to understand their indicators. Gonçalves et al. (2011, 2013), in turn, developed a safety culture diagnostic model for industry, based on Hudson’s (2003) proposal, which was later applied in the chemical and petrochemical segments.
The importance of work safety and using reference models that have broad scope and include the particularities of various economic sectors serve to attract scientiic investigation and subsequent application of the indings by businesses.
Therefore, this study had two objectives. The irst was to apply a safety culture diagnosis model (Gonçalves et al., 2011) to a Brazilian mining company, highlighting the factors that constitute its work safety culture. The second aim was to adapt this model to the reality of the mining industry. These adjustments occurred and were tested according to the needs pointed out by a group of work safety experts specialized in the mining industry, based on Gibbons et al. (2006) and Balassiano & Salles (2012).
The relevance of the study comes both from the suggested adjustments to the model of Gonçalves et al. (2011), used as reference, and the need to learn more about the aspects most closely related to strengthening the safety culture in the mining industry. This is a topic still little explored in Brazil, where the mining sector employs a large contingent of workers. In mid-2014, the total labor force in the Brazilian mining sector was over 198 thousand workers (DNPM, 2014).
2 Theoretical framework
The concept of culture is used to explain the fact that different groups of people have different ways of absorbing and reacting to events based on gradual learning and sharing of meanings (Zanelli at al., 2004). In this way, culture can be considered a vector that inluences and structures the ways of thinking, feeling and acting.
According to Martin (2002), one of the perspectives to understand culture in organizations is that of integration, where the culture is considered to be homogeneous, because its aspects are shared by the majority of members, producing consistent and clear interpretations of their manifestations.
Among several models identiied by Smircich (1983), the comparative management model stands out. Based on a functionalist understanding of organizational culture, this model is characterized by the interpretation of organizations as organisms in a setting that presents imperatives for behavior.
Organizational culture can be deined by the sharing of beliefs, perceptions and thoughts, and can be manifested through artifacts - such as visible organizational structures and processes - and by expressed values (Schein, 1992), where such sharing characterizes groups of people (Schneider & Smith, 2004).
Several typologies intend to explain the organizational culture construct. One of the approaches is that of Cameron & Quinn (1999), who proposed four classiications of culture: clan, adhocracy, hierarchy and market cultures. The clan culture is characterized by cohesion, loyalty and internal maintenance. The adhocracy culture is marked by innovation, pioneering and lexibility. The hierarchical culture presents structured, bureaucratic, stable processes and has discipline as an important trait. Finally, in the market culture there is emphasis on external positioning and control.
Berson et al. (2008) indicated three dimensions that are recurrently identiied in organizational culture: innovation, bureaucracy and support. The innovation dimension has entrepreneurial characteristics, where creativity and taking risks are valued. In the bureaucratic dimension, the focus is on rules and eficiency. The support dimension is marked by the relationship between the members of the organization, which ideally should be friendly, fair and attentive.
Safety culture is part of organizational culture (Guldenmund, 2010; Richter & Koch, 2004). When organizational culture prioritizes work safety, then safety culture is present in the organization (Glendon & Stanton, 2000; Silva & Lima, 2004).
When exploring the advances of the literature related to the understanding of the safety culture aspects, it reveals an expansion from a technicist, functionalist and legalist vision to visions that are more geared to management and cultural processes. Safety, along with health, has been incorporated into management systems, seeking, besides compliance with legislative rules and administrative standards, improvement in behavior and recognition of the contribution of safety culture to the good management of the organization.
Reason (2016), in an attempt to understand safety culture, deines it as the set of shared values and beliefs that interact with organizational structures and control systems to produce behavioral norms. In addition, he advocates four main aspects in the safety culture process: (i) culture of reporting, in which people perceive the importance of reporting workplace accidents and feel conident in doing so; (ii) culture of continuous learning; (iii) culture of justice, which generates conidence so that people freely report abnormal occurrences that may occur; and inally, (iv) lexibility, which translates into the organization’s ability to consider a horizontal structure that allows more autonomy. This concept and the processes are corroborated by Gibbons et al. (2006), Richter & Koch (2004), and Zanelli et al. (2004), who have highlighted the cultural diversity that can coexist in a group and in groups within an organization.
Despite the diversity within the ield of research on safety culture, Naevestad (2009) distinguishes two main approaches: the functionalist and the interpretative. The functionalist approach is the most widely used because it is easier to observe, measure and transform, since it assumes that culture refers to the sharing of behavior patterns rather than meanings, as advocated by the interpretative approach. The functionalist line is generally preferred by managers due to the attribution of the power of cultural transformation. The interpretive approach, however, focuses on the meaning that people attribute to actions and safety systems, by sharing the patterns of meaning that members of the organization attribute to their beliefs, behaviors and collective identity. In addition, this author believes that in the interpretive approach, culture is created and recreated through the interaction of group members.
As for the process of developing safety culture, Geller (1994) pointed out three stages: dependent, independent and interdependent. However, Fleming (2001) deined ive stages of the evolutionary process: emergent, management, involvement, cooperative
and continuous improvement. The International Atomic Energy Agency (AIEA, 2002) indicated three stages of safety culture. In the irst stage, the practice of work safety occurs through compliance with rules and regulations and employees perceive it as a concern of their leaders. In the second stage, the focus is on performance, which is driven by objectives and goals. In the third stage, safety is understood as a process that must be continuously improved, in which everyone can contribute. Another proposal to classify the stages safety culture was put forward by Westrum (2004), who focused attention on the role of information in the development of safety culture, encompassing three stages of culture: pathological, bureaucratic and constructive.
Hudson (2003) proposed a model of evolution of safety culture maturity that includes ive stages: pathological, reactive, calculative, proactive and constructive. The pathological stage is characterized by the absence of worries about job safety, which is considered a problem caused by workers, and the main drivers are business considerations and the desire not to get caught by inspectors or oficials. In the reactive stage, organizations begin to take the safety issue seriously, but they only react after accidents. In the calculative stage, there are systematic actions aimed at quantifying the results, that is, this is a step focuses on collecting data rather than learning from them, but safety is still something imposed and not sought by the workforce. The proactive stage is marked by anticipating problems by promoting continuous improvement and assuming organizational values as a reference for work routines. Involvement of the workforce begins to happen, in place of the purely top-down approach. The last level, the constructive or generative one, is characterized by active participation at all levels to achieve continuous improvements, in which safety is integrated with everything the organization does and safety becomes part of the business.
From a survey of several typologies proposed in the literature, Gonçalves et al. (2011) developed a model that allows the identiication of the maturity of an organization’s safety culture. The authors based their framework on the taxonomy proposed by Hudson (2003), and carried out an extensive literature review to characterize and identify the stages, in which ive factors indicative of the maturity of the safety culture were selected. They are: information, organizational learning, communication, commitment and involvement.
evolution. The communication factor refers to the extent to which information about job safety reaches employees, whether there is an open channel between employees and managers, and whether the organization measures the effectiveness of the communication process. Commitment refers to the resources allocated to work safety management, the status of production, values, policies, procedures and training processes and whether these contents really are coherent between discourse and practice. Finally, involvement addresses the level of employee involvement in safety issues, such as accident investigations and the establishment of safety committees.
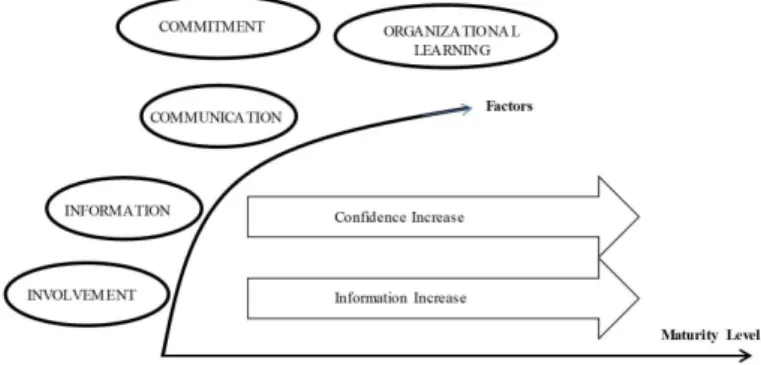
Therefore, Gonçalves et al. (2011) pointed out these ive factors (information, organizational learning, communication, commitment and involvement) to be treated in the ive maturity levels of safety culture - pathological, reactive, calculative, proactive and constructive (Hudson, 2003) - aiming to diagnose safety culture and establish actions for its maturation (Figure 1). The increase of conidence and information boost maturity levels.
Given the model, the authors tested it in 23 chemical and petrochemical companies, obtaining its validation for these industries and indicating the possibility of generalization to all industrial organizations.
3 Methodology
For this study, the concept of safety culture is deined as the sharing of values, beliefs, perceptions, and meaning patterns about the safety issue in organizations. We used the functionalist approach, as proposed by Naevestad (2009), and the model described by Gonçalves et al. (2011), due to its breadth and focus on the industrial sector. Although the mining industry, the subject of this study, has different characteristics compared to those in the chemical and petrochemical segments, where the model was previously applied, we chose it to seek
possible evolution and adaptations to the mining industry.
Therefore, to achieve the objectives, we obtained the data by application of a structured questionnaire, as proposed by Gonçalves et al. (2011). This allows, according to Creswell (2010), obtaining a quantitative description of the attitudes, opinions and tendencies of the population from the responses of the people included in the sample.
The data collection took place in two stages, with two different questionnaires, called the original questionnaire and the adjusted questionnaire. The irst was exactly the one proposed by Gonçalves et al. (2011). The second relected adaptations based on the mining sector’s speciic characteristics. In this way, it was possible to verify which questionnaire best applies to the mining sector, and consequently, the resulting model.
The original questionnaire consists of 21 (twenty-one) observable variables, one for each question, covering the 5 (ive) factors indicative of maturity of safety culture - information, organizational learning, communication, commitment and involvement. They are, respectively, 4 (four), 4 (four), 3 (three), 8 (eight) e 2 (two) questions for factor, as presented in Chart 1. Each question indicates 5 options related to each of the predicted degrees of maturity - pathological, reactive, bureaucratic, proactive and constructive.
The adjusted questionnaire was composed of 22 (twenty-two) questions, with 4 (four), 4 (four), 2 (two), 9 (nine) and 3 (three) questions, respectively, for each factor, as shown in Chart 2. Like the original questionnaire, each question indicates 5 options regarding each predicted degree of maturity. The adjustment involved the inclusion of two new variables entered and the deletion of one. Regarding the new variables, one was related to the leadership role, extracted and adapted from Gibbons et al. (2006) on the development and initial validation of a method for accessing the safety culture in commercial light operations in
Figure 1. Factors of Safety Culture and Degree of Maturity. Source: Prepared by the authors based on Gonçalves et al. (2011) and
the United States; and the second was related do the justice in relationships, a content developed by Balassiano & Salles (2012). The deleted variable was the one associated with communication – existence of a company-employee communication factor, which did not apply to the reality of the company studied, according to the team of specialists interviewed.
The research subjects were the technical-operational level employees of an industrial unit of a Brazilian mining company. The universe of this research, it means, the total of employees was 590. The sample was selected by the accessibility criterion, deined by the ease of access to the research subjects, and it counted on 288 respondents (48.8% of total employees). Part of that contingent, 161 (27.3%), answered the original questionnaire, while 127 (21.5%) answered the adjusted questionnaire. Therefore, the number of observations in both samples is adequate, since 5 to 10 observations per item (questionnaire questions) are indicated as suficient.
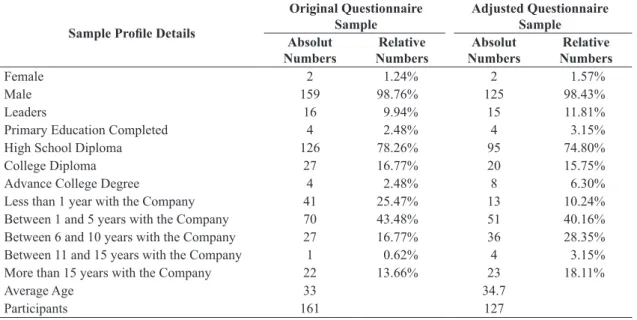
The proile of the participants was detailed in the questionnaires, given the application of two different types of questionnaires, in two equally distinct samples from the same company. Table 1 compares the proiles of the two groups of respondents.
Because the irst objective was to detect the factors that constitute the safety culture and the cultural aspects related to the generation of accidents, both
questionnaires - the irst with 21 observable variables and the second with 22 observable variables – were subjected to the same factor analysis to detect these factors. According to Hair et al. (1998, 2009), factorial analysis seeks to analyze the structure of interrelationships (correlations) between a large number of variables, deining a set of common underlying dimensions, known as factors.
Due to the second objective of adapting the diagnostic model to the reality of the mining industry, and although it was faced with an eminently conirmatory problem, we carried out an exploratory evaluation, in line with Balassiano (2006), with three new tests to identify new factors beyond the 5 previously established ones. The irst test employed the standard software process applied to factor analysis, which identiied 7 (seven) factors. In the other tests, 3 (three) and 4(four) factors were identiied.
The premises of normality, linearity and multicollinearity required by factor analysis were met.
4 Analysis of the results
The data obtained through the original and adjusted questionnaires considered the ive pre-established factors and were adequate for conducting the factor analysis, which was conirmed by the Kaiser-Meyer-Olkin Chart 1. Original questionnaire.
INFORMATION 4 questions related to information on abnormal occurrences, information means, employee conidence, and performance measurement indicators.
ORGANIZATIONAL LEARNING
4 questions related to the analysis of abnormal occurrences, method of analysis, improvements in safety, and the results of the analysis of these occurrences.
COMMMUNICATION 3 questions related to the company’s communication on safety at work, the existence of information channels, and the effectiveness of this communication.
COMMMITMENT
8 questions related to the company’s support for workplace safety: planning, audits, investments, priority, training, authority, safety procedures, and monitoring of contractors.
INVOLVEMENT 2 questions related to employee participation in job safety and interest in
participating.
Source: Gonçalves et al. (2011).
Chart 2. Adjusted questionnaire.
INFORMATION 4 questions related to information on abnormal occurrences, information means, employee conidence, and performance measurement indicators.
ORGANIZATIONAL LEARNING
4 questions related to the analysis of abnormal occurrences, method of analysis, improvements in safety, and the results of the analysis of these occurrences.
COMMMUNICATION 2 questions related to the existence of information channels, and the effectiveness
of this communication.
COMMMITMENT
9 questions related to the company’s support for workplace safety: planning, auditing, investments, training, authority, priority, safety procedures, leadership performance and compliance.
INVOLVEMENT 3 questions related to the participation of outsourced workers, the involvement of
contracted workers and the interest in participating.
(KMO) and Bartlett sphericity tests, with signiicance below 5%, as shown in Tables 2 and 3.
The KMO test produces a statistic that indicates the proportion of data variance that can be considered common to all variables. Results between 0.5 and 1.0 mean adequacy of the factor analysis (Hair et al., 1998, 2009). The Bartlett sphericity test checks whether the correlation matrix is an identity matrix, which would indicate that the factorial model is inappropriate. With a signiicance level lower than 5%, the null hypothesis that the correlation matrix is an identity is rejected, thus allowing the continuation of the analysis.
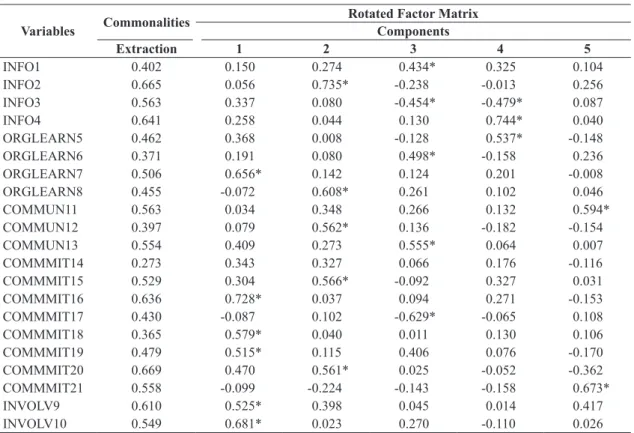
When conducting the factor analysis of the data obtained through the original questionnaire, it can
be seen in Table 4, that the commonalities, which refer to the estimated variance of the variables, were between 0.273 and 0.669. It is important to note that, according to Hair et al. (1998, 2009), practical considerations suggest a minimum level of 0.5 for commonalities in statistical analysis. Therefore, with such low commonalities, the variables of the original questionnaire did not present the expected correlations with the previously deined factors, that is, the contribution of each variable to the model constructed by the factorial analysis was modest.
The variables previously related to information (INFO) did not correlate in the same factor, but they were present in other factors, besides presenting cross-loadings even after rotation of the factors. Table 2. Adequacy of the factor analysis technique of the original questionnaire.
KMO and Bartlett Tests Values
Kayser-Meyer-Olkin (KMO) measure of sampling adequacy 0.728
Chi-squared approximation 867.561
Bartlett’s sphericity test 210
Signiicance 0.000
Source: Prepared by the authors.
Table 3. Adequacy of the factor analysis technique of the adjusted questionnaire.
KMO and Bartlett Tests Values
Kayser-Meyer-Olkin (KMO) measure of sampling adequacy 0.76
Chi-squared approximation 1120.789
Bartlett’s sphericity test 231
Signiicance 0.000
Source: Prepared by the authors.
Table 1. Samples’ characterization.
Sample Proile Details
Original Questionnaire Sample
Adjusted Questionnaire Sample
Absolut Numbers
Relative Numbers
Absolut Numbers
Relative Numbers
Female 2 1.24% 2 1.57%
Male 159 98.76% 125 98.43%
Leaders 16 9.94% 15 11.81%
Primary Education Completed 4 2.48% 4 3.15%
High School Diploma 126 78.26% 95 74.80%
College Diploma 27 16.77% 20 15.75%
Advance College Degree 4 2.48% 8 6.30%
Less than 1 year with the Company 41 25.47% 13 10.24%
Between 1 and 5 years with the Company 70 43.48% 51 40.16%
Between 6 and 10 years with the Company 27 16.77% 36 28.35%
Between 11 and 15 years with the Company 1 0.62% 4 3.15%
More than 15 years with the Company 22 13.66% 23 18.11%
Average Age 33 34.7
Participants 161 127
Regarding the variables related to organizational learning (ORGLEARN), there was also no correlation between them in a single factor. On the contrary, they were all positioned in different factors, in exactly the same way as the variables related to communication (COMMUN) and involvement (INVOLV). Such results demonstrate that the chosen variables were not conirmed as good representatives of the previously deined factors.
Regarding the variables related to the commitment factor (COMMMIT), the great majority had signiicant factor loadings (> 0.5) and they were correlated mainly to two factors.
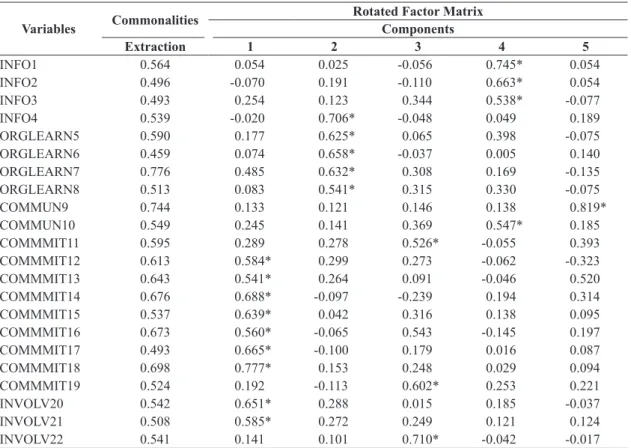
In the factor analysis with the data collected by the adjusted questionnaire, according Table 5, the commonalities varied between 0.479 and 0.776, indicating better results regarding the shared variance with all variables analyzed in relation to those obtained with application of the original questionnaire.
Regarding the rotated factor matrix (Table 5), it showed signiicant consistency in the results and a higher correlation of the variables with the factors deined a priori in relation to the test performed with the data collected by the original questionnaire.
It could be noted that the results of the adjusted questionnaire showed that most of the variables
related to latent factors: information (INFO1, INFO2, INFO3), organizational learning (ORGLEARN5, ORGLEARN6, ORGLEARN7 and ORGLEARN8), commitment (COMMMIT12, COMMMIT13, COMMMIT14, COMMMIT15, COMMMIT16, COMMMIT17, COMMMIT18), and involvement (INVOLV20, INVOLV21) had correlations within the same component or factor.
Most of the information-related variables (INFO) correlated to a single factor, except for the fourth variable (INFO4), which was positioned in the same way as the variables related to organizational learning (ORGLEARN). This correlation can be explained by the fact that variable INFO4 deals with the performance evaluation models of the company. It is possible to infer that this content is associated with organizational learning, to the extent that the organizational indicators, when well used and analyzed, catalyze the learning process. Like this last factor, if well accomplished, it will necessarily have positive impacts on the organization’s performance. Thus, the possibility of understanding of the correlation between the variable INFO4 and the variables related to organizational learning (ORGLEARN) is clear.
The results of the variables related to communication (COMMUN) did not present a correlation with a Table 4. Commonalities and rotated factor matrix of the data collected by the original questionnaire.
Variables Commonalities
Rotated Factor Matrix Components
Extraction 1 2 3 4 5
INFO1 0.402 0.150 0.274 0.434* 0.325 0.104
INFO2 0.665 0.056 0.735* -0.238 -0.013 0.256
INFO3 0.563 0.337 0.080 -0.454* -0.479* 0.087
INFO4 0.641 0.258 0.044 0.130 0.744* 0.040
ORGLEARN5 0.462 0.368 0.008 -0.128 0.537* -0.148
ORGLEARN6 0.371 0.191 0.080 0.498* -0.158 0.236
ORGLEARN7 0.506 0.656* 0.142 0.124 0.201 -0.008
ORGLEARN8 0.455 -0.072 0.608* 0.261 0.102 0.046
COMMUN11 0.563 0.034 0.348 0.266 0.132 0.594*
COMMUN12 0.397 0.079 0.562* 0.136 -0.182 -0.154
COMMUN13 0.554 0.409 0.273 0.555* 0.064 0.007
COMMMIT14 0.273 0.343 0.327 0.066 0.176 -0.116
COMMMIT15 0.529 0.304 0.566* -0.092 0.327 0.031
COMMMIT16 0.636 0.728* 0.037 0.094 0.271 -0.153
COMMMIT17 0.430 -0.087 0.102 -0.629* -0.065 0.108
COMMMIT18 0.365 0.579* 0.040 0.011 0.130 0.106
COMMMIT19 0.479 0.515* 0.115 0.406 0.076 -0.170
COMMMIT20 0.669 0.470 0.561* 0.025 -0.052 -0.362
COMMMIT21 0.558 -0.099 -0.224 -0.143 -0.158 0.673*
INVOLV9 0.610 0.525* 0.398 0.045 0.014 0.417
INVOLV10 0.549 0.681* 0.023 0.270 -0.110 0.026
single factor. On the other hand, the commitment (COMMMIT), 7 (seven) of the 9 (nine) variables behaved similarly, correlating with a single factor, demonstrating that representations of this factor are adequate. Although there was cross-loading of the variable COMMMIT16, only the irst (COMMMIT11) and the ninth (COMMMIT19) variables of this factor disagreed with the others, showing inadequacy for this model. The variable COMMMIT11 is related to the planning of companies in relation to work safety, and COMMMIT19 was fully constructed in this study and concerns justice in relationships.
Regarding involvement (INVOLV), most of its variables converged with those of commitment (COMMMIT), demonstrating that those concepts are not being distinguished by the data.
When comparing the results of the two questionnaires, although in the analysis of the data of the adjusted questionnaire not all the variables behaved according to expectation, the correlations were closer to the ones expected, according to the conceptual objective. Most of the variables related to organizational learning (ORGLEARN), commitment (COMMMIT) and information (INFO) presented important correlations within the preconceived
factors, which did not occur from the analysis of the data of the original questionnaire.
Regarding the variables related to communication (COMMUN) and involvement (INVOLV), neither of the two models tested had the predicted correlations.
We applied other tests to the data from the adjusted questionnaire, as follow: the irst one was according to the standard of the software used in this study, which establishes the number of factors according to eigenvalues greater than 1 (one), in this case, 7 (seven) factors. The second one was performed suggesting 3 (three) factors, and the third, 4 (four) factors.
As can be seen in Table 6, the commonalities resulting from the seven-factor test varied between 0.581 and 0.793, i.e., higher than those obtained in the ive-factor test. However, in rotated factor matrix, although there were factor loadings greater than 0.5, the position of most of the other variables did not present the expected correlations from previous conceptual evaluations.
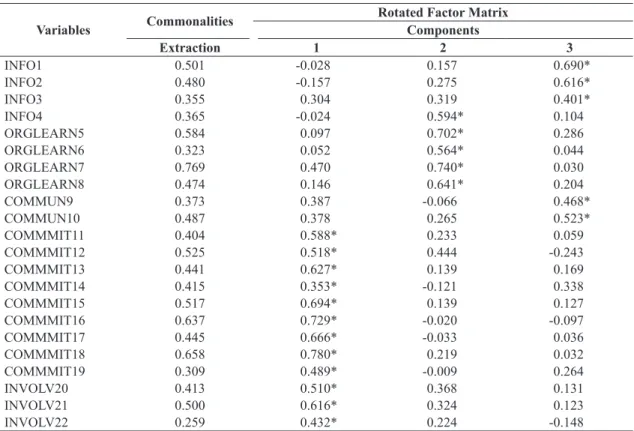
When testing the adjusted data considering three factors, as shown Table 7, the commonalities varied between 0.259 and 0.769, that is, with values lower than those obtained in the tests with ive and seven factors. However, it is possible to observe in Table 5. Commonalities and rotated factor matrix of the data collected by the adjusted questionnaire.
Variables Commonalities
Rotated Factor Matrix Components
Extraction 1 2 3 4 5
INFO1 0.564 0.054 0.025 -0.056 0.745* 0.054
INFO2 0.496 -0.070 0.191 -0.110 0.663* 0.054
INFO3 0.493 0.254 0.123 0.344 0.538* -0.077
INFO4 0.539 -0.020 0.706* -0.048 0.049 0.189
ORGLEARN5 0.590 0.177 0.625* 0.065 0.398 -0.075
ORGLEARN6 0.459 0.074 0.658* -0.037 0.005 0.140
ORGLEARN7 0.776 0.485 0.632* 0.308 0.169 -0.135
ORGLEARN8 0.513 0.083 0.541* 0.315 0.330 -0.075
COMMUN9 0.744 0.133 0.121 0.146 0.138 0.819*
COMMUN10 0.549 0.245 0.141 0.369 0.547* 0.185
COMMMIT11 0.595 0.289 0.278 0.526* -0.055 0.393
COMMMIT12 0.613 0.584* 0.299 0.273 -0.062 -0.323
COMMMIT13 0.643 0.541* 0.264 0.091 -0.046 0.520
COMMMIT14 0.676 0.688* -0.097 -0.239 0.194 0.314
COMMMIT15 0.537 0.639* 0.042 0.316 0.138 0.095
COMMMIT16 0.673 0.560* -0.065 0.543 -0.145 0.197
COMMMIT17 0.493 0.665* -0.100 0.179 0.016 0.087
COMMMIT18 0.698 0.777* 0.153 0.248 0.029 0.094
COMMMIT19 0.524 0.192 -0.113 0.602* 0.253 0.221
INVOLV20 0.542 0.651* 0.288 0.015 0.185 -0.037
INVOLV21 0.508 0.585* 0.272 0.249 0.121 0.124
INVOLV22 0.541 0.141 0.101 0.710* -0.042 -0.017
Table 6. Commonalities and rotated factor matrix with seven factors from the adjusted questionnaire.
Variables Commonalities
Rotated Factor Matrix Components
Extraction 1 2 3 4 5 6 7
INFO1 0.606 -0.023 0.125 0.761* 0.075 0.023 0.046 -0.037
INFO2 0.652 0.080 -0.074 0.677* 0.204 -0.003 -0.306 0.216
INFO3 0.588 0.204 0.185 0.522* 0.085 -0.009 0.479 0.049
INFO4 0.657 0.053 -0.012 0.093 0.795* 0.109 0.019 -0.013
ORGLEARN5 0.607 0.398 0.018 0.389 0.518* 0.008 0.153 -0.069
ORGLEARN6 0.581 0.087 0.074 0.045 0.748* 0.064 0.042 -0.010
ORGLEARN7 0.793 0.669* 0.180 0.125 0.458* -0.008 0.191 0.226
ORGLEARN8 0.759 0.705* -0.329 0.243 0.156 0.196 0.058 0.171
COMMUN9 0.784 0.001 0.096 0.105 0.095 0.843* -0.046 0.205
COMMUN10 0.702 0.372 0.037 0.477* -0.086 0.399 0.409 -0.006
COMMMIT11 0.600 0.178 0.171 -0.084 0.266 0.425* 0.382 0.367
COMMMIT12 0.720 0.678* 0.273 -0.120 0.123 -0.206 0.040 0.335
COMMMIT13 0.694 0.333 0.388 -0.100 0.158 0.626* 0.076 0.005
COMMMIT14 0.709 0.073 0.769* 0.195 0.030 0.235 -0.130 -0.042
COMMMIT15 0.631 0.216 0.596* 0.120 0.095 0.100 0.418 0.146
COMMMIT16 0.789 0.163 0.492 -0.168 0.029 0.134 0.260 0.636*
COMMMIT17 0.582 0.138 0.677* 0.012 0.029 0.006 0.138 0.292
COMMMIT18 0.711 0.543* 0.550* -0.037 0.020 0.221 0.203 0.149
COMMMIT19 0.781 0.126 0.093 0.221 -0.097 0.184 0.104 0.808*
INVOLV20 0.629 0.677* 0.358 0.109 0.037 0.162 0.004 -0.059
INVOLV21 0.625 0.576* 0.307 0.042 0.036 0.339 0.282 -0.029
INVOLV22 0.741 0.090 0.061 -0.059 0.091 0.000 0.829* 0.176
*> 0.40 acceptable contribution limit of variable in factor creation. Source: Prepared by the authors.
Table 7. Commonalities and rotated factor matrix with three factors from the adjusted questionnaire.
Variables Commonalities
Rotated Factor Matrix Components
Extraction 1 2 3
INFO1 0.501 -0.028 0.157 0.690*
INFO2 0.480 -0.157 0.275 0.616*
INFO3 0.355 0.304 0.319 0.401*
INFO4 0.365 -0.024 0.594* 0.104
ORGLEARN5 0.584 0.097 0.702* 0.286
ORGLEARN6 0.323 0.052 0.564* 0.044
ORGLEARN7 0.769 0.470 0.740* 0.030
ORGLEARN8 0.474 0.146 0.641* 0.204
COMMUN9 0.373 0.387 -0.066 0.468*
COMMUN10 0.487 0.378 0.265 0.523*
COMMMIT11 0.404 0.588* 0.233 0.059
COMMMIT12 0.525 0.518* 0.444 -0.243
COMMMIT13 0.441 0.627* 0.139 0.169
COMMMIT14 0.415 0.353* -0.121 0.338
COMMMIT15 0.517 0.694* 0.139 0.127
COMMMIT16 0.637 0.729* -0.020 -0.097
COMMMIT17 0.445 0.666* -0.033 0.036
COMMMIT18 0.658 0.780* 0.219 0.032
COMMMIT19 0.309 0.489* -0.009 0.264
INVOLV20 0.413 0.510* 0.368 0.131
INVOLV21 0.500 0.616* 0.324 0.123
INVOLV22 0.259 0.432* 0.224 -0.148
rotated factor matrix that although four variables (INFO3, COMMUN9, COMMMIT19, INVOLV22) had factor loadings under 0.5, the variables correlated to three factors in a coordinated way with the expectations formed according to the conceptual objective of each of them. In addition, variables related to communication (COMMUN) and information (INFO) were correlated to a single factor, as were the variables related to commitment (COMMMIT) and involvement (INVOLV).
It is possible to understand the relationship between these factors. The variables related to communication (COMMUN) and information (INFO) have very close conceptual objectives, referring to the process of information distribution within companies, whether referring to the information about accidents reported by employees (INFO1) or the communication by the Company on labor safety (COMMUN2). Thus, it can be understood that the direction of information (company to employees or employees to company) was ignored during the establishment of the correlations and these converged in a single sense.
Like other tests performed with the adjusted questionnaire data, the indicators also did not distinguish the variable INFO4 from the variables related to organizational learning, treating them in a similar way, forming a single dimension. This variable refers to the types of work safety performance assessment used by companies. Such a correlation makes sense insofar as the organizational learning process is considered to be related to organizations’ ability to assess performance. Companies that have more elaborate and in-depth methods to evaluate performance are certainly more likely to have a more effective organizational learning process.
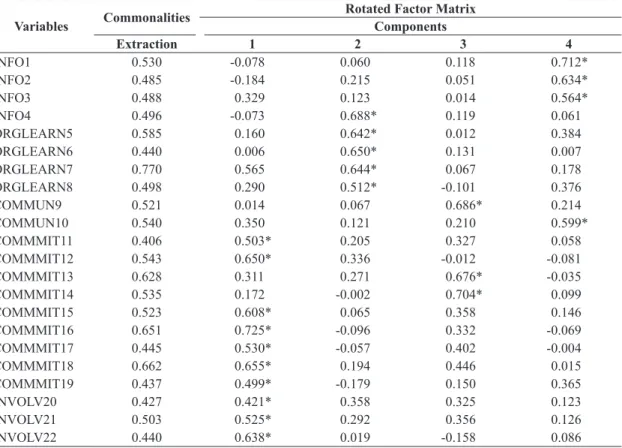
When considering 4 (four) factors to analyze the results from the adjusted questionnaire, it is possible to see, according Table 8, that the commonalities varied between 0.406 and 0.770, that is, higher values than those obtained in the test with 3 (three) factors. On the other hand, the variables related to communication did not correlate with the same factor, and the variables COMMMIT13 and COMMMIT14, which in all other analysis were correlated to a single factor, did not behave in the same way in the analysis with 4 (four) factors.
Table 8. Commonalities and rotated factor matrix with four factors from the adjusted questionnaire.
Variables Commonalities
Rotated Factor Matrix Components
Extraction 1 2 3 4
INFO1 0.530 -0.078 0.060 0.118 0.712*
INFO2 0.485 -0.184 0.215 0.051 0.634*
INFO3 0.488 0.329 0.123 0.014 0.564*
INFO4 0.496 -0.073 0.688* 0.119 0.061
ORGLEARN5 0.585 0.160 0.642* 0.012 0.384
ORGLEARN6 0.440 0.006 0.650* 0.131 0.007
ORGLEARN7 0.770 0.565 0.644* 0.067 0.178
ORGLEARN8 0.498 0.290 0.512* -0.101 0.376
COMMUN9 0.521 0.014 0.067 0.686* 0.214
COMMUN10 0.540 0.350 0.121 0.210 0.599*
COMMMIT11 0.406 0.503* 0.205 0.327 0.058
COMMMIT12 0.543 0.650* 0.336 -0.012 -0.081
COMMMIT13 0.628 0.311 0.271 0.676* -0.035
COMMMIT14 0.535 0.172 -0.002 0.704* 0.099
COMMMIT15 0.523 0.608* 0.065 0.358 0.146
COMMMIT16 0.651 0.725* -0.096 0.332 -0.069
COMMMIT17 0.445 0.530* -0.057 0.402 -0.004
COMMMIT18 0.662 0.655* 0.194 0.446 0.015
COMMMIT19 0.437 0.499* -0.179 0.150 0.365
INVOLV20 0.427 0.421* 0.358 0.325 0.123
INVOLV21 0.503 0.525* 0.292 0.356 0.126
INVOLV22 0.440 0.638* 0.019 -0.158 0.086
5 Final considerations
The objective of this study was to apply a diagnostic model of maturity stages of the safety culture developed by Gonçalves et al. (2011) in a company in the Brazilian mining industry, and to adapt this model to the reality of this sector.
To that end, 288 employees of a mining company answered a questionnaire based on Gonçalves et al. (2011), called original, and also an adjusted questionnaire, based on the needs pointed out by a group of experts on work safety in that industry, and in the indings of Gibbons et al. (2006) and Balassiano & Salles (2012).
The factor analysis of the data collected through the two questionnaires used enabled making some observations. The results obtained by the original questionnaire indicated it was not appropriate for the mining reality, since the selected variables were not good representatives of the factors indicative of maturity of safety culture - information, organizational learning, communication, and involvement.
However, the results obtained through the adjusted questionnaire, with the ive previously established factors, proved to be more relevant. Besides this, we performed other tests with seven, three and four factors with the data from this adjusted questionnaire. The analysis of variables grouped in three factors - organizational learning, information and commitment - presented correlations very close to those expected in relation to the conceptual objectives of each variable, that is, these factors were considered in this study as the main constituent factors of the culture of work safety in the Brazilian mining industry.
While it is desirable to create a general safety culture measure that is applicable to all organizations, industries or nations, this may not be possible or worthwhile in practice, since safety culture is closely related to the structure of the organization and the nature of the work itself (Gibbons et al., 2006). It is well known that the chemical and petrochemical industries and the mining industry have different characteristics, such as the types of risks involved in the activities and the severity of the impacts of those risks when not properly controlled.
Therefore, as opportunities for future research, it is possible to emphasize the possibility of applying the same instrument to other companies in the mining segment, as well as in other industrial segments. In addition, simple and multiple case studies with effective triangulation of methods could lead to greater enrichment of the model, even if it does not lead to generalizations.
As suggestions for management, it is important to emphasize that from the knowledge of the highlighted safety culture factors, organizations can analyze their degree of maturity in regarding safety culture and, with this, formulate action plans focused on the aspects that really drive their evolution and, consequently,
the improvement in safety indicators. Prevention of work-related accidents leads both to endogenous beneits, from gains of eficiency in operational processes and improvements in the organizational climate, and exogenous ones, by preserving or improving reputation and minimizing the economic and social costs related to the occurrence of accidents.
References
Agência Internacional de Energia Atômica – AIEA. (2002). INSAG-15: key practical issues in strengthening safety culture. Vienna: AIEA.
Balassiano, M. (2006). Estudos confirmatórios e exploratórios em administração. In D. M. Zouain & D. Botelho (Eds.), Pesquisa quantitativa em administração (pp. 109-128). São Paulo: Atlas.
Balassiano, M., & Salles, D. (2012). Perceptions of equity and justice and their implications on affective organizational commitment: a confirmatory study in a teaching and research institute. Brazilian Administration
Review, 9(3), 268-286.
http://dx.doi.org/10.1590/S1807-76922012000300003.
Berson, Y., Oreg, S., & Dvir, T. (2008). CEO values, organizational culture and firm outcomes. Journal of Organizational Behavior, 29(5), 615-633. http://dx.doi. org/10.1002/job.499.
Brasil. Ministério da Previdência Social – MPS. (2012). Anuário estatístico da Previdência Social. Brasília: DATAPREV. Recuperado em 13 de outubro de 2014, de http://www.previdencia.gov.br
Cameron, K. S., & Quinn, R. E. (1999). Diagnosing
and changing organizational culture. Massachusetts: Addison-Wesley.
Creswell, J. (2010). Projeto de pesquisa: métodos qualitativo, quantitativo e misto. Porto Alegre: Artmed.
Departamento Nacional de Produção Mineral – DNPM. (2014). Informe mineral. Brasília: DNPM. Recuperado em 11 de novembro de 2014, de http://www.ibram.org.br Fleming, M. (2001). Safety culture maturity model (pp.
1-7). Norwich: Health and Safety Executive.
Geller, E. S. (1994). Ten principles for achieving a total safety culture. Professional Safety, 39, 18-24. Gibbons, A. M., Thaden, T. L., & Wiegmann, D. A.
(2006). Development and initial validation of a survey for assessing safety culture within commercial flight operations. The International Journal of Aviation Psychology, 16(2), 215-238. http://dx.doi.org/10.1207/ s15327108ijap1602_6.
Glendon, A. I., & Stanton, N. A. (2000). Perspectives on safety culture. Safety Science, 34(1), 193-214. http:// dx.doi.org/10.1016/S0925-7535(00)00013-8. Gonçalves, A. P. G., Fo., Andrade, J. C. S., & Marinho,
Naevestad, T. O. (2009). Mapping research on culture and safety in high risk organizations: arguments for a sociotechnical understanding of safety culture. Journal of Contingencies and Crisis Management, 7(2), 126-136. http://dx.doi.org/10.1111/j.1468-5973.2009.00573.x. Reason, J. (2016). Managing the risks of organizational
accidents. Abingdon: Routledge.
Richter, A., & Koch, C. (2004). Integration, differentiation and ambiguity in safety cultures. Safety Science, 42(8), 703-722. http://dx.doi.org/10.1016/j.ssci.2003.12.003. Schein, E. H. (1992). Organizational culture and leadership.
San Francisco: Sage.
Schneider, B., & Smith, D. B. (2004). Personality and organizations. Mahwah: Lawrence Erlbaum Associates. Silva, S., & Lima, M. L. (2004). Culturas de segurança e
aprendizagem com acidentes: percursos da investigação em psicologia social e organizacional (pp. 57-270, Vol. 1). Lisboa: Colibri.
Smircich, L. (1983). Concepts of culture and organizational analysis. Administrative Science Quarterly, 28(3), 339-358. http://dx.doi.org/10.2307/2392246.
Westrum, R. (2004). A typology of organizational cultures. Quality & Safety in Health Care, 13(2, Supl. Suppl 2), 22-27. PMid:15576687.
Zanelli, J. C., Borges-Andrade, J. E., & Bastos, A. V. B. (2004). Psicologia, organizações e trabalho no Brasil. Porto Alegre: Artmed.
trabalho: uma proposta de modelo. Gestão & Produção, 18(1), 205-220. http://dx.doi.org/10.1590/S0104-530X2011000100015.
Gonçalves, A. P. G., Fo., Andrade, J. C. S., & Marinho, M. M. O. (2013). Modelo para a gestão da cultura de segurança do trabalho em organizações industriais. Revista
Produção, 23(1), 178-188. http://dx.doi.org/10.1590/ S0103-65132012005000044.
Guldenmund, F. W. (2010). (Mis) understanding safety culture and its relationship to safety management. Risk Analysis, 30(10), 1466-1480. PMid:20626685.http:// dx.doi.org/10.1111/j.1539-6924.2010.01452.x. Hair, J. F., Black, W. C., Babin, B. J., Anderson, R. E., &
Taham, R. L. (1998). Multivariate data analysis (5. ed). New Jersey: Prentice Hall.
Hair, J. F., Black, W. C., Babin, B. J., Anderson, R. E., & Taham, R. L. (2009). Análise multivariada de dados (6. ed). Porto Alegre: Bookman.
Harvey, J., Erdos, G., Bolam, H., Cox, M. A. A., Kennedy, J. N. P., & Gregory, D. T. (2002). An analysis of safety culture attitudes in a highly regulated environment. Work and Stress, 16(1), 18-36. http://dx.doi. org/10.1080/02678370110113226.
Hudson, P. (2003). Applying the lessons of high risk industries to health care. Quality & Safety in Health Care, 12(90001, Suppl 1), 7-12. PMid:14645741.http:// dx.doi.org/10.1136/qhc.12.suppl_1.i7.