, 2014, vol. 26, no. 1, p. 98-108
Acta Limnologica Brasiliensia http://dx.doi.org/10.1590/S2179-975X2014000100011
Phytoplankton functional and morphological groups as
indicators of environmental variability in a lateral
channel of the Upper Paraná River floodplain
Grupos funcionais e morfológicos fitoplanctônicos como indicadores da variabilidade
ambiental em um canal lateral da planície de inundação do Alto Rio Paraná
Jascieli Carla Bortolini1, Luzia Cleide Rodrigues1,2, Susicley Jati2 and Sueli Train1
1Programa de Pós-graduação em Ecologia de Ambientes Continentais, Centro de Ciências Biológicas, Departamento de Biologia, Universidade Estadual de Maringá – UEM,
Avenida Colombo, 5790, CEP 87020-900, Maringá, PR, Brazil e-mail: [email protected]; [email protected]
2Departamento de Biologia, Núcleo de Pesquisas em Limnologia, Ictiologia e Aquicultura, Universidade Estadual de Maringá – UEM, Avenida Colombo, 5790, Bloco H-90,
Sala 23, CEP 87020-900, Maringá, PR, Brasil e-mail: [email protected]; [email protected]
Abstract: Aim: Models of phytoplankton functional classification based on functional (FGs) and morphological (MBFGs) traits can be an important tool in aquatic monitoring. In this long-term study on phytoplankton, the goal was to use these two approaches to explain the changes in this community in an active channel of the Upper Paraná River floodplain, depending on the environmental conditions imposed by the hydrosedimentological regime. Methods: Samples were taken between 2000 and 2013. Results: 196 taxa were identified. Bacillariophyceae and Cyanobacteria showed higher contribution to biovolume. Were recorded 11 FGs (A, C, E, H1, J, Lo, M, MP, N, P and X1). The FGs C, Lo, M, MP, P and X1 were common to both periods. Already the FGs A, E, H1 and J occurred only in limnophase, while the FG N occurred only in potamophase. Were recorded seven MBFGs (I, II, III, IV, V, VI e VII). All seven MBFGs occurred in both hydrological periods, however the MBFGs III, VI and VII contributed with high biovolume values mainly in the limnophase. The FG P and MBFG VI were indicator of eutrophic status, while the FG M and MBFG VII were indicators of mesotrophic status. Only FGs reflected the environmental variability. Conclusion: The classification of phytoplankton in FGs and MBFGs represented an important tool for understanding of the behavior and dynamics of the species in relation to environmental conditions. However, the FGs appear to be more related to environmental variation this lotic channel than MBFGs. Probably this is related to the refinement of this classification, which reflected the changes in the community, in long-term scale, influenced by local and regional characteristics imposed by the hydrosedimentological regime of the Paraná River.
Keywords: phytoplankton, biovolume, lotic, subtropical floodplain.
the functional and morphological models of phytoplankton can provide detailed information of the modifications of lotic habitat and species allocated, depending on the hydrosedimentological regime of the floodplain in a long term scale. Moreover, these models are useful in providing data for monitoring and management of aquatic ecosystems (Crossetti and Bicudo, 2008).
This study aimed to use of the models based on phytoplankton FGs and MBFGs to explain changes in the community, at interannual scale, in an active channel of the Upper Paraná River floodplain, depending on the environmental conditions imposed by the hydrosedimentological regime of the Paraná River, and respond the following questions: i) What are the FGs and MBFGs phytoplankton found in limnophase and potamophase periods in this lotic environment?; ii) Are FGs and MBFGs models indicative of the trophic status of this environment?; iii) Do the different functional and morphological traits of FGs and MBFGs reflect the environmental variability in this channel?
2. Material and Methods
2.1. Study area
The Paraná River is the second longest river in South America (4.965 km). The Upper Paraná River includes the first third of the Paraná River basin, has width: depth ratio of 100:1 and water velocity of approximately 0.56 m s–1. The Upper
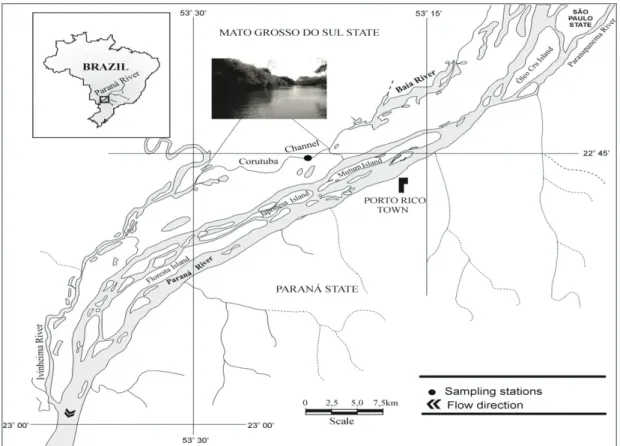
Paraná River floodplain occupies the entire river channel between Porto Primavera Hydroelectric Plant (Primavera, SP) and the Itaipu Reservoir (Guaíra, PR). It covers about 230 km long, 20 km wide, with numerous secondary channels, lakes and rivers (Souza Filho and Stevaux, 2004). The Corutuba channel is located on the right bank of the Paraná River (Figure 1), connecting the Baía and Ivinhema Rivers, and has an average depth of 2.7 m. The flow direction of this channel, as well as the water velocity may be influenced by those rivers, as well as by the Paraná River in high water periods. This environment has gravel substrate, margins with macrophyte stands and width: depth ratio of 11:1 at the channel inlet (Rocha, 2004).
1. Introduction
Phytoplankton comprises an extremely diverse group of organisms, encompassing different taxonomic groups and hundreds of species. From this, two models have been currently applied for the classification of taxa and their application in understanding the dynamics of aquatic ecosystems. The first is based on the functional traits or FGs (Reynolds et al., 2002; Padisák et al., 2009) and requires taxonomic, physiological and ecological knowledge of each particular group. The second is based on morphological traits (morphology based functional groups - MBFGs) (Kruk et al., 2010; Kruk and Segura, 2012) and involves the knowledge of purely morphological traits of taxa (Abonyi et al., 2012).
The successful use of these models has been shown in several studies, either in shallow lakes (Stević et al., 2013; Izaguirre et al., 2012; Kruk et al., 2011; Bovo-Scomparin and Train 2008; Crossetti and Bicudo, 2008), as in lotic environments (Bovo-Scomparin et al., 2013; Stanković et al., 2012; Devercelli, 2010). Obviously, the model based on morphology, simpler and more recent, can be adopted as a complement to the functional model, more robust and well-established in the scientific field (Kruk et al., 2011).
In floodplain systems, the river dynamics of the main channel, which includes periods of limnophase (low water) and potamophase (high water) is the main driving force that acts on the organization of aquatic communities, due to the occurrence of exchange of mechanical or biological energy and organic and inorganic materials that directly influence in the distribution of abundance and species diversity (Neiff, 1990). In the Upper Paraná River floodplain, studies have used the functional groups approach for understanding this dynamic, however, the approach of MBFGs has not yet been employed. Bovo-Scomparin et al. (2013) identified the FGs A, C, P, M, H1 and X2 as the main groups for the Paraná and Baía Rivers.
The interannual variability of water discharge pulses, their duration and intensity can significantly influence the phytoplankton composition and abundance (Rodrigues et al., 2009). Thus,
representou uma importante ferramenta para a compreensão do comportamento e dinâmica das espécies em relação às condições ambientais. No entanto, os GFs parecem estar mais relacionados à variabilidade ambiental deste canal lótico do que os GFBMs. Provavelmente isso está relacionado com o refinamento dessa classificação, o que refletiu as mudanças da comunidade, na escala de longo prazo, influenciadas pelas características locais e regionais impostas pelo regime hidrossedimentológico do rio Paraná.
100 Bortolini, JC. et al. Acta Limnologica Brasiliensia
(DIN) was estimated by the concentrations of nitrite, nitrate and ammonium. Variations in water level of the Corutuba channel were evaluated by the values of maximum depth (Zmax). The Zeu/Zmax ratio was used to evaluate the light availability. All of the abiotic variables were obtained in the same time than the biological ones. Data of physical and chemical variables were furnished by the Laboratory of Basic Limnology of the Nupelia (UEM).
The trophic status classification of the Corutuba channel followed Vollenweider and Kerekes (1982) and Reynolds (1980). The daily hydrometric levels (HL) of the Paraná River were provided by Itaipu Binational and the Brazilian National Water Agency (ANA). Potamophase periods were considered when the hydrometric level of the Paraná River was greater than 4.6 m, which signals the beginning of the flooding process of the lentic and lotic environments associated with the Upper Paraná River and limnofase periods were considered when the hydrometric level of the Paraná River was lower than 4.6 m (Souza Filho, 2009).
Phytoplankton density was estimated according to Utermöhl (1958) and Lund et al. (1958). The phytoplankton biomass was estimated by biovolume. This in turn was calculated by multiplying the
2.2. Methods
Phytoplankton samples were taken at the subsurface (depht 20 cm) in limnetic region. Samples were taken quarterly (except in 2001 and 2003) between February 2000 and March 2013, totaling 13 years of data collection (n=49). These samples were preserved in situ with acidified Lugol’s
solution (Bicudo and Menezes, 2006). All samples are included in the multidisciplinary research project “The Upper Paraná River floodplain” - Long Term Ecological Research (PELD), funded by MCT/CNPq.
Water temperature and dissolved oxygen (DO) were measured in situ with YSI meter, while pH and electrical conductivity (Cond) with Digimed portable meters. Water transparency was measured with a Secchi disk and the turbidity was measured using a turbidimeter. Euphotic zone (Zeu) was calculated as 2.7 times the Secchi depth (Cole, 1994). Concentrations of total suspended matter (TSM), total phosphorus (TP), soluble reactive phosphorus (SRP) (Golterman et al., 1978), nitrate (N-NH3), nitrite (N-NH2) (Giné et al., 1980) and ammonium (N-NH4) (Koroleff, 1978) were
also determined. The dissolved inorganic nitrogen
of the channel was positively correlated with the hydrometric level of the Paraná River (r = 0.51, p <0.05, n = 49). Mean values and coefficient of variation of abiotic variables for each year sampled are listed in Table 1.
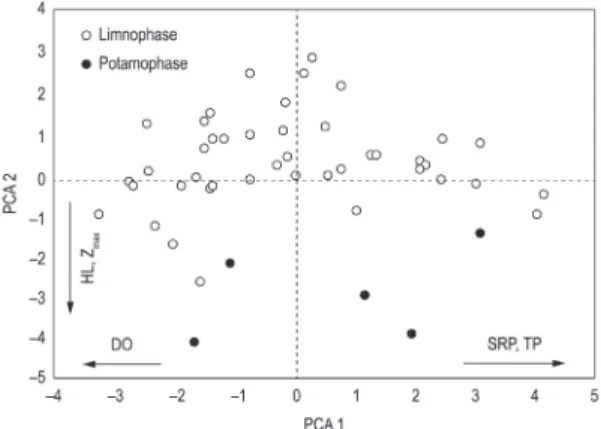
The first two axes generated by Principal Components Analysis explained 52% of the total variability data in the Corutuba channel. Axis 1 was positively influenced by SRP (0.43) and TP (0.46) and negatively by DO (–0.48). The variables that were most correlated with axis 2 were HL (–0.51) and Zmax (–0.49) (Figure 3).
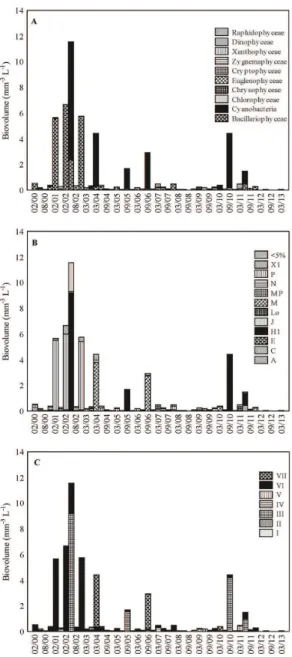
Were registered 196 taxa, distributed between 10 taxonomic groups: Bacillariophyceae (33%), Chlorophyceae (20%), Cyanobacteria (19%), Zygnemaphyceae (11%), Euglenophyceae (6%), Cryptophyceae (4%), Chrysophyceae (3%), Dinophyceae (2%), Xanthophyceae (1%) and Raphidophyceae (1%). Biovolume values were high mainly in the limnophase (Figure 4A). Bacillariophyceae contributed to more than 50% of the total biovolume in 97% of the samples and Cyanobacteria contributed to 45% of the total biovolume in 71% of the samples.
Were registered 11 FGs, being A (Urosolenia
eriensis (H. L. Smith) Round & Crawford), C
(Aulacoseira ambigua (Grunow) Simonsen var.
ambigua and Aulacoseira distans (Ehrenberg)
Simonsen), E (Dinobryon divergens Imhof ), H1
(Dolichospermum planctonicum (Brunnthaler)
Wacklin, Hoffmann & Komárek, Dolichospermum
solitarium (Klebahn) Wacklin, Hoffmann &
Komárek and Dolichospermum spiroides (Klebahn)
density of different taxa by their respective volumes. The cell volume was calculated from geometric models according to the shape of the cells (Sun and Liu, 2003). Taxa contributing more than 5% to the total phytoplankton biovolume per year were grouped in FGs according to Reynolds et al. (2002) and Padisák et al. (2009). All phytoplankton taxa were grouped in MBFGs according to Kruk et al. (2010). A Principal Component Analysis (PCA) was performed to summarize the environmental variability of the limnophase and potamophase periods. The Indicator Value Analysis (INDVAL) (Dufrêne and Legendre, 1997) was applied to verify the use of phytoplankton FGs and MBFGs as indicators of the trophic status of the Corutuba channel. The relationships between the abiotic data and the biovolume of the phytoplankton FGs and MBFGs were analyzed through Canonical Correspondence Analysis (CCA). For the analysis was performed the software PC-Ord 6.0 (McCune and Mefford, 1999).
3. Results
The hydrosedimentological regime of the Paraná River showed irregular annual cycles (Figure 2). The interannual variability of Paraná River hydrometric levels was high (CV = 29%), ranging from 1.58 m in February 2001 to 6.37 m in March 2007. The years 2000, 2001 and 2008 was under the influence of La Niña (CPC, 2012), with negative influence of rainfall in the region, resulting in lower hydrometric levels throughout the study period. In 2005, 2007 and 2010, high rainfall under the influence of El Niño, resulted in high values of hydrometric level
of the Paraná River. The maximum depth (Zmax)
Figure 2. Hydrometric levels of the Paraná River (lines) and Zmax of the Corutuba channel (points) from February 2000 to March 2013. Points also indicate the sampling days.
102
Bor
tolini, JC. et al.
A
cta L
imnologica B
rasiliensia
Table 1. The mean values (M) and coefficients of variation (%) of water temperature (WT, °C), dissolved oxygen (DO, mg.L–1), electrical conductivity (Cond., µS/cm–1), euphotic zone
(Zeu, m), maximum depth (Zmax, m), Zeu/Zmax ratio (Zeu/Zmax), turbidity (Turb, NTU), total suspended matter (TSM, µg L–1), dissolved inorganic nitrogen (DIN, µg L–1), total phosphorus
(TP, µg L–1), soluble reactive phosphorus (SRP, µg L–1), hydrometric level of the Paraná River (HL, m). *Data not obtained **data relative to only March.
WT DO pH Cond Zeu Zmax Zeu/Zmax Turb TSM DIN TP SRP HL
2000 24.4
(17%)
7.7 (24%)
6.7 (5%)
49.7 (27%)
2.1 (43%)
2.7 (12%)
0.8 (36%)
19.7 (87%)
16.2 (79%)
120.8 (68%)
24.6 (77%)
3.6 (162%)
3.0 (5%)
2001 25.6 6.0 6.3 23.4 1.5 2.3 0.7 22.8 10.5 47.1 42.2 9.0 2.2
(18%) (17%) (6%) (12%) (13%) (47%) (35%) (15%) (82%) (9%) (5%) (65%) (42%)
2002 24.9 7.2 6.6 32.0 1.5 1.9 0.8 7.6 12.6 10.6 18.0 4.2 2.8
(16%) (17%) (6%) (39%) (41%) (48%) (21%) (23%) * (200%) * * (22%)
2003 25.5 4.8 6.4 26.7 2.4 3.0 0.8 6.0 2.3 30.7 38.8 13.1 3.3
(24%) (97%) (11%) (1%) (1%) (26%) (26%) (96%) (116%) (106%) (101%) (112%) (25%)
2004 24.6 6.4 6.3 40.5 1.4 2.1 1.8 5.6 5.3 105.0 26.1 4.5 2.8
(19%) (18%) (17%) (38%) (74%) (10%) (86%) (110%) (82%) (99%) (21%) (52%) (5%)
2005 24.3 7.3 6.8 50.3 3.3 2.4 5.6 4.7 5.2 114.1 21.0 4.9 3.2
(18%) (12%) (15%) (35%) (51%) (18%) (68%) (106%) (46%) (32%) (35%) (34%) (43%)
2006 25.2 7.7 7.1 46.8 4.2 2.8 1.5 6.2 3.1 58.4 14.5 8.2 3.3
(17%) (11%) (14%) (33%) (83%) (11%) (85%) (104%) (22%) (65%) (61%) (65%) (12%)
2007 26.0 6.3 7.0 49.3 3.1 3.1 1.0 8.9 2.5 123.0 36.5 9.8 3.6
(16%) (41%) (11%) (25%) (45%) (17%) (30%) (111%) (20%) (57%) (76%) (80%) (51%)
2008 24.4 6.3 6.5 39.2 2.8 3.1 0.9 13.1 2.5 105.2 40.0 20.2 2.6
(20%) (24%) (5%) (26%) (19%) (14%) (10%) (33%) (80%) (17%) (34%) (61%) (18%)
2009 25.8 3.9 6.2 37.7 2.5 3.4 0.8 5.9 2.1 56.9 43.6 13.2 3.4
(17%) (77%) (9%) (26%) (20%) (14%) (33%) (14%) (120%) (67%) (48%) (67%) (40%)
2010 25.1 6.4 6.6 35.9 2.9 3.3 0.9 8.8 3.4 119.9 35.1 8.5 3.4
(19%) (28%) (12%) (64%) (28%) (23%) (15%) (25%) (78%) (59%) (38%) (40%) (32%)
2011 23.9 6.0 6.2 27.7 3.9 2.9 1.4 7.8 2.3 49.1 36.8 15.4 3.4
(18%) (25%) (6%) (57%) (65%) (44%) (69%) (67%) (30%) (43%) (42%) (49%) (38%)
2012 28.1 5.4 6.3 23.8 2.9 3.0 1.0 8.2 2.3 53.2 31.5 15.2 2.8
(9%) (15%) (2%) (11%) (20%) (21%) (9%) (44%) (19%) (76%) (57%) (75%) (15%)
Were registered seven MBFGs, being I (Small organisms with high S⁄V) represented mainly by colonial cyanobacteria, II (Small flagellated organisms with siliceous exoskeletal) represented by chrysophyceans, III (Large filaments with aerotopes) represented by filamentous cyanobacteria, IV (Organisms of medium size lacking specialized traits) represented by chlorophyceans and zygnemaphyceans, V (Unicellular flagellates of medium to large size) represented by euglenoids, cryptomonads and dinoflagellates, VI (Non-flagellated organisms with siliceous exoskeletons) represented by diatoms and VII (Large mucilaginous colonies) represented by colonial chlorophyceans and cyanobacterial. All the seven MBFGs occurred in both hydrological periods, however, the MBFGs III, VI and VII contributed to high values of biovolume mainly in limnophase (Figure 4C).
The FGs P (MBFG VI), H1 (MBFG III) and M (MBFG VII) were the main contributors to the phytoplankton biovolume. The FG P had their greatest contribution to biovolume (91%) in February 2001, FG H1 (95%) in September 2010 and FG M (92%) in September 2006.
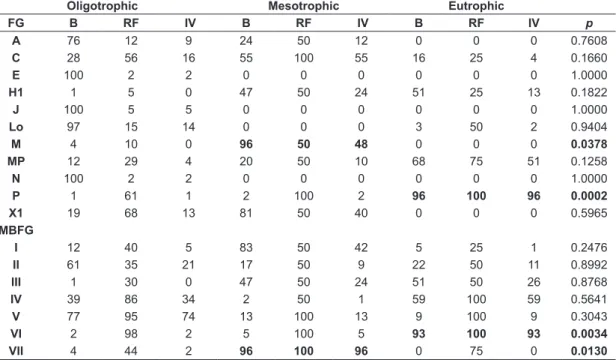
Were registered FGs and MBFGs with high indicative value to trophic status (Table 2) by INDVAL. The FG M and MBFG VII was significantly indicators of mesotrophic conditions. The FG P and MBFG VI presented high indicator value of eutrophic conditions.
The Canonical Correspondence Analysis (CCA) was significant only for the FGs (p<0.05) according to the Monte Carlo test. Only the first axes was significant and explained 18% of the FGs versus
environment variability. The axes 1 was principally correlated positively with Zeu.Zmax (0.46), HL (0.27),
water temperature (0.21) and negatively with electrical conductivity (–0.81), TP (–0.58), pH (–0.31), Zmax (–0.28) and DIN (–0.28) (Figure 5). The CCA for MBFGs was not significant according to the Monte Carlo test.
4. Discussion
T h e m a r k e d i n f l u e n c e o f t h e hydrosedimentological regime of the Paraná River on abiotic variables in lotic environments of this floodplain promotes changes in structure and dynamics phytoplankton in potamophase periods. Active floodplain channels are highly stable in respect to geomorphology, however, are susceptible to the hydrological dynamics of the Paraná River (Rocha, 2004). This influence can be confirmed by the positive correlation of the Zmax of the Corutuba Wacklin, Hoffmann & Komárek), J (Tetraplektron
acutum (Pascher) Fott), Lo (Peridinium sp.), M (Microcystis aeruginosa Kützing), MP (Amphipleura
lindheimeri Grunow and Surirella cf. linearis
W. Smith), N (Staurastrum setigerum Cleve), P
(Aulacoseira granulata (Ehrenberg) Simonsen var.
granulata and Aulacoseira muzzanensis (Meister)
Krammer, Closterium sp1 and Closterium sp3) and
X1 (Spermatozopsis exultans Korshikov). The FGs
C, Lo, M,MP, P and X1 were common to both periods. Already the FGs A, E, H1 and J occurred only in limnophase, while the FG N occurred only in potamophase (Figure 4B).
104 Bortolini, JC. et al. Acta Limnologica Brasiliensia
biovolume values (Train and Rodrigues, 2004; Rodrigues et al., 2009) and therefore are recognized as driving factors of the low phytoplankton biovolume in the channel at all of the study period. However, phytoplankton biovolume values >2 mm–3 L–1 were recorded in the channel,
mainly in low hydrometric levels periods, and at lower Zmax and higher concentration of TP (>10 µg L–1), when Bacillariophyceae (FG P,
MBFG VI) and Cyanobacteria (FGs H1 and M, MBFGs III and VII, respectively) were dominated.
Phytoplankton FGs and MBFGs reflected the conditions of this environment in each hydrosedimentological period and demonstrate the seasonality imposed by the local conditions in the limnophase and potamophase. The FGs model, mainly, has been widely used as a tool for the study and understanding of ecological processes in inland aquatic environments (Crossetti et al., 2013). The relationship between environmental conditions and the establishment of a certain group accurately describes their tolerance and sensitivity.
The FG P represented mainly by Aulacoseira granulata var. granulata was dominant during several periods of low water. This group was dominant under conditions of high TP, SRP and water temperature. According Padisák et al. (2009) this group is associated with higher trophic states. The same pattern selected by Kruk and Segura (2012) to classify this species in MBFG VI. This supports channel with the hidrometric levels of the Paraná
River.
The increased of discharge in the lotic environments promotes a decline in phytoplankton biomass (Devercelli and O’Farell, 2013). Thus, the low residence time of this lotic environment combined with the water influx from the Paraná River in the potamophase causes a greater dilution of phytoplankton which is expressed in the low
Table 2. TheFGs andMBFGs indicative of trophic status (B-biovolume (mm3L–1); RF-Relative frequency; Indicator Value-IV). Significant values (p<0.05), high indicator values and high values of B and FR are highlighted in bold.
Oligotrophic Mesotrophic Eutrophic
FG B RF IV B RF IV B RF IV p
A 76 12 9 24 50 12 0 0 0 0.7608
C 28 56 16 55 100 55 16 25 4 0.1660
E 100 2 2 0 0 0 0 0 0 1.0000
H1 1 5 0 47 50 24 51 25 13 0.1822
J 100 5 5 0 0 0 0 0 0 1.0000
Lo 97 15 14 0 0 0 3 50 2 0.9404
M 4 10 0 96 50 48 0 0 0 0.0378
MP 12 29 4 20 50 10 68 75 51 0.1258
N 100 2 2 0 0 0 0 0 0 1.0000
P 1 61 1 2 100 2 96 100 96 0.0002
X1 19 68 13 81 50 40 0 0 0 0.5965
MBFG
I 12 40 5 83 50 42 5 25 1 0.2476
II 61 35 21 17 50 9 22 50 11 0.8992
III 1 30 0 47 50 24 51 50 26 0.8768
IV 39 86 34 2 50 1 59 100 59 0.5641
V 77 95 74 13 100 13 9 100 9 0.3043
VI 2 98 2 5 100 5 93 100 93 0.0034
VII 4 44 2 96 100 96 0 75 0 0.0130
Rodrigues et al., 2009; Bovo-Scomparin et al., 2013), which probably serves as a source of inoculum for the channel.
Xanthophyceae (FG J and MBFG IV) was represented by Tetraplektron acutum which was
dominant in march/2012 (61% do biovolume), limnophase period. Functional group J was dominant under conditions of high temperature and high concentrations of SRP. Already the FG X1 and MBFG I, represented by Spermatozopsis exultans, was present in several periods, both limnophase as potamophase. According Kruk and Segura (2012) this group is r-strategist, may dominate in a variety of trophic conditions. The Chrysophyceae was represented by Dinobryon divergens (FG E and MBFG II) which has a moderate resources gathering ability, moderate vulnerability to consumption and low to moderate sinking losses (Kruk et al., 2010). Electrical conductivity, pH and nutrients may be important in explaining the variability (Kruk and Segura, 2012) as shown by the CCA.
The occurrence of FG N, represented by
Staurastrum setigerum, also classified as MBFG
IV, only during the high water period in 2007 is related to the dynamics of the environment in this period, when the exchange of matter between river and floodplain is high, which promotes higher concentrations of humic substances in the environment, which could be evidenced by the negative correlation between MBFG IV and OD, pH and electrical conductivity. Lower concentrations of nutrients and low light attenuation promote the success of this group, especially in transitional ecosystem stages (Reynolds et al., 2002), as happened in this period of flooding. Besides that, the occurrence of aquatic macrophytes in this channel may have contributed with metaphytic inoculum for the biovolume of this FG in the plankton in March 2007. In this period, the highest water level of the Paraná River (>6 m) probably influenced the water flow in the channel and the consequent dispersal of metaphytic organisms from aquatic macrophytes. According to Benda et al. (2004) the confluence of two channels can alter drainage patterns and consequently the spatial distribution of fluvial geomorphological processes, which probably occurred between the Corutuba channel and the main channel of the Upper Paraná River.
The use of MBFGs, as previously mentioned, also contributed to the understanding of phytoplankton dynamics in this environment. Among the seven MBFGs proposed by Kruk et al. (2010), the significance of both associations as indicators of
eutrophic state this lotic environment.
Microcystis aeruginosa (FG M andMBFG VII),
presented contribution to phytoplankton mainly in September/03 (50%), March/04 (86%) and September/06 (97%), limnophase periods, and March/10 (83%), potamophase period. During these months the biovolume phytoplankton and TP values characterized this channel as mesotrophic to eutrophic. So, this group was important to highlight the mesotrophic status of this channel through INDVAL. Microcystis aeruginosa form
large mucilaginous colonies, with high S/V ratio, its growth rate and its buoyancy control due to the presence of the mucilaginous sheath (Kruk et al., 2010) contributed to their success in environment. Kruk and Segura (2012) indicated that the presence of MBFG VII is related to the higher trophic level, but may develop in a broad range of environmental conditions as observed in this study.
The heterocytic Cyanobacteria Dolichospermum planctonicum (FG H1 andMBFG III), also occurred under higher concentrations of nutrients, such as TP and SRP, in September/05 and September/10, with values above 95% of biovolume total, how evidenced in CCA diagram. The occurrence of FG in limnophase periods is directly related to these conditions, when the environment provides sufficient conditions for the nutritional enrichment. According to Padisák et al. (2009), the habitat model for the success of this FG is closely associated with high concentrations of TP available in the environment. The similar results was evidenced by the MBFG, since the occurrence of this group was associated with higher concentrations of TP (>16 µg L–1). Furthermore, D. planctonicum has a
high S/V ratio, high biovolume and low sinking rate which most likely contributed to its development during periods of lower hydrometric levels and lower Zmax. Kruk and Segura (2012) argued that the success of this group results from the ability to develop in environments with low light and higher trophic status.
106 Bortolini, JC. et al. Acta Limnologica Brasiliensia
So, based on the functional strategies phytoplankton of the Corutuba channel, we can characterize the limnophase as being preferentially dominated by functional groups P and H1, and the potamophase with groups such as the mixotrophic algae Lo and desmids N. Therefore, the seasonal and interannual variability observed in the biovolume of phytoplankton suggests that the variability of different groups not only is related to the environmental variability between limnophase and potamophase periods, but also the local dynamics of lotic environment.
References
ABONYI, A., LEITÃO, M., LANÇON, AM. and PADISÁK, J. 2012. Phytoplankton functional groups as indicators of human impacts along the River Loire (France). Hydrobiologia, vol. 698, no. 1, p. 233-249. http://dx.doi.org/10.1007/s10750-012-1130-0 BENDA, L., ANDRAS, K., MILLER, D. and
BIGELOW, P. 2004. Confluence effects in rivers: Interactions of basin scale, network geometry, and disturbance regimes. Water Resources Research, vol. 40, no. 5. http://dx.doi.org/10.1029/2003WR002583 BICUDO, CEM. and MENEZES, M. 2006. Gêneros
de algas de águas continentais do Brasil: chave para identificação e descrições. São Carlos: RiMa. BOVO-SCOMPARIN, VM. and TRAIN, S. 2008.
Long-term variability of the phytoplankton community in a isolated floodplain lake of the Ivinhema River State Park, Brazil. Hydrobiologia, vol. 610, no. 1, p. 331-344. http://dx.doi.org/10.1007/s10750-008-9448-3 BOVO-SCOMPARIN, VM., TRAIN, S. and
RODRIGUES, LC. 2013. Influence of reservoirs on phytoplankton dispersion and functional traits: a case study in the Upper Paraná River, Brazil. Hydrobiologia, vol. 702, no. 1, p. 115-127. http:// dx.doi.org/10.1007/s10750-012-1313-8
COLE, GA. 1994. Textbook of limnology. Illinois: Waveland Press.
CROSSETTI, L. and BICUDO, CEM. 2008. Adaptations in phytoplankton life strategies to imposed change in a shallow urban tropical eutrophic reservoir, Garças Reservoir, over 8 years. Hydrobiologia, vol. 614, no. 1, p. 91-105. http:// dx.doi.org/10.1007/s10750-008-9539-1
CROSSETTI, LO., BECKER, V., CARDOSO, LS., RODRIGUES, LR., COSTA, LS. and MOTTA-MARQUES, D. 2013. Is phytoplankton functional classification a suitable tool to investigate spatial heterogeneity in a subtropical shallow lake? Limnologica: Ecology and Management of Inland Waters, vol. 43, no. 3, p. 157-163. http://dx.doi. org/10.1016/j.limno.2012.08.010
three (MBFGs III, VI and VII) were important contributors to the phytoplankton biovolume, and two (MBFGs VI and VII) were good indicators of the trophic status of the Corutuba channel. Despite having not occurred significance of CCA, the presence of different MBFGs may be related to the characteristics of the lotic environment that naturally favor the presence of these groups.
The MBFGs VI was also represented by organisms with siliceous exoskeleton as Amphipleura lindheimeri, Surirella cf. linearis (FG MP), Urosolenia eriensis (FG A) and Aulacoseira ambigua var. ambigua
and Aulacoseira distans (FG C). The mandatory
presence of a siliceous wall is the main characteristic of this group (Kruk et al., 2010), which typically show a higher sinking rate, caused by its larger cell size, but with advantage against predation by certain herbivores (Kruk and Segura, 2012). The highest values of biovolume of this group occurred mainly in 2001 and 2002, along with low hydrometric levels of the Paraná River and low Zmax of the channel. This indicates that the turbulent mixing probably favored the permanency of these taxa to the water column, owing the greater wind action in this environment when it was shallower. Additionally, their occurrence was associated with eutrophic status of the Corutuba channel.
The largest contribution of MBFG V to the biovolume, represented by flagellated organisms, such as Dinophyceae (FG Lo), Cryptophyceae and Euglenophyceae, in the potamophase period, was also observed in other studies (Train and Rodrigues, 2004; Bovo-Scomparin and Train, 2008). According to their morphology, the presence of flagella may be a key factor in their ability to resist the increased flow of water in potamophase periods. In addition, the mixotrophic ability of some of these organisms is beneficial during periods when conditions are hostile for the phytoplankton development (Kruk and Segura, 2012).
LUND, JWG., KIPLING, C. and LECREN, ED. 1958. The inverted microscope method of estimating algal number and the statistical basis of estimating by couting. Hydrobiologia, vol. 11, no. 2, p. 143-170. http://dx.doi.org/10.1007/BF00007865
MCCUNE, B. and MEFFORD, MJ. 1999. PC-ORD: multivariate analysis of ecological data, version 4.0. Gleneden Blach: MjM Software Design.
NEIFF, JJ. 1990. Ideas para la interpretación ecologica del Paraná. Interciência, vol. 15, no. 6, p. 424-441. PADISÁK, J., CROSSETTI, LO. and
NASELLI-FLORES, L. 2009. Use and misuse in the application of the phytoplankton functional classification: a critical review with updates. Hydrobiologia, vol. 621, no. 1, p. 1-19. http://dx.doi.org/10.1007/s10750-008-9645-0
REYNOLDS, CS. 1980. Phytoplankton assemblages and their periodicity in stratifying lake systems. Ecography, vol. 3, no. 3, p. 141-159. http://dx.doi. org/10.1111/j.1600-0587.1980.tb00721.x
REYNOLDS, CS., HUSZAR, VLM., KRUK, C., NASELLI-FLORES, L. and MELO, S. 2002. Towards a functional classification of the freshwater phytoplankton. Journal of Plankton Research, vol. 24, no. 5, p. 417-428. http://dx.doi.org/10.1093/ plankt/24.5.417
ROCHA, P. 2004. Conectividade hidrológica e aspectos físico-químicos no sistema rio Baía/Canal Corutuba/rio Ivinhema, região SE de Mato Grosso do Sul - Brasil. Revista Eletrônica da Associação de Geógrafos Brasileiros, vol. 1, no. 1, p. 69-90. RODRIGUES, LC., TRAIN, S., BOVO-SCOMPARIN,
V M . , J AT I , S . , B O R S A L L I , C C J . a n d MARENGONI, E. 2009. Interannual variability of phytoplankton in the main rivers of the Upper Paraná River floodplain, Brazil: influence of upstream reservoirs. Brazilian Journal of Biology, vol. 69, no. 2, p. 501-516. PMid:19738958. http://dx.doi. org/10.1590/S1519-69842009000300006 SALMASO, N. and PADISÁK, J. 2007.
Morpho-Functional Groups and phytoplankton development in two deep lakes (Lake Garda, Italy and Lake Stechlin, Germany). Hydrobiologia, vol. 578, no. 1, p. 97-112. http://dx.doi.org/10.1007/s10750-006-0437-0
SOUZA FILHO, EE. 2009. Evaluation of the Upper Paraná River discharge controlled by reservoirs. Brazilian Journal of Biology, vol. 69, no. 2, p. 707-716. PMid:19738976. http://dx.doi.org/10.1590/ S1519-69842009000300024
SOUZA FILHO, EE. and STEVAUX, JC. 2004. Geology and geomorphology of the Baía-Curutuba-Ivinhema river complex. In THOMAZ, SM., AGOSTINHO, AA. and HAHN, NS., ed. The Upper Paraná river and its floodplain: physical aspects, ecology and conservation. Leiden: Backhuys Publishers.
Climate Prediction Center - CPC. 2012. National weather service. Maryland. Available from: <http://www.cpc. noaa.gov>.
DEVERCELLI, M. 2010. Changes in phytoplankton morpho-functional groups induced by extreme hydroclimatic events in the Middle Paraná River (Argentina). Hydrobiologia, vol. 639, no. 1, p. 5-19. http://dx.doi.org/10.1007/s10750-009-0020-6 DEVERCELLI, M. and O’FARRELL, I. 2013.
Factors affecting the structure and maintenance of phytoplankton functional groups in a nutrient rich lowland river. Limnologica, vol. 43, no. 2, p. 67-78. http://dx.doi.org/10.1016/j.limno.2012.05.001 DUFRÊNE, M. and LEGENDRE, P. 1997. Species
assemblages and indicator species: the need for a flexible asymmetrical approach. Ecological Monographs, vol. 67, no. 3, p. 345-366.
GINÉ, MF., BERGAMIM, H., ZAGATTO, EAG. and REIS, BF. 1980. Simultaneus determination of nitrite and nitrate by flow injection analysis. Analytica Chimica Acta, vol. 114, p. 191-197. http://dx.doi. org/10.1016/S0003-2670(01)84290-2
GOLTERMAN, HL., CLYMO, RS. and OHSTAD, MAA. 1978. Methods for physical and chemical analysis of freshwater. Oxford: Blackwell Scientific Publication.
IZAGUIRRE, I., ALLENDE, L., ESCARAY, R., BUSTINGORRY, J., PÉREZ, G. and TELL, G. 2012. Comparison of morpho-functional phytoplankton classifications in human-impacted shallow lakes with different stable states. Hydrobiologia, vol. 698, no. 1, p. 203-216. http://dx.doi.org/10.1007/s10750-012-1069-1
KOROLEFF, K. 1978. Determination of ammonia. In GRASSHOFF, K. and KREMLING, E., ed. Methods of seawater analysis. Winhein: Verlag Chemie. KRUK, C. and SEGURA, AM. 2012. The habitat
template of phytoplankton morphology-based functional groups. Hydrobiologia, vol. 698, no. 1, p. 191-202. http://dx.doi.org/10.1007/s10750-012-1072-6
KRUK, C., HUSZAR, VLM., PEETERS, EHM., BONILLA, S., COSTA, L., LURLING, M., REYNOLDS, CS. and SCHEFFER, M. 2010. A morphological classification capturing functional variation in phytoplankton. Freshwater Biology, vol. 55, no. 3, p. 614-627. http://dx.doi.org/10.1111/ j.1365-2427.2009.02298.x
108 Bortolini, JC. et al. Acta Limnologica Brasiliensia
TRAIN, S. and RODRIGUES, LC. 1998. Temporal fluctuations of the phytoplankton community of the Baía River, in the upper Paraná River floodplain, Mato Grosso do Sul, Brazil. Hydrobiologia, vol. 361, no. 1-3, p. 125-134.
TRAIN, S. and RODRIGUES, LC. 2004. Phytoplankton Assemblage. In THOMAZ, SM., AGOSTINHO, AA. and HAHN, NS., ed. The Upper Paraná River floodplain: physical aspects, ecology and conservation. Leiden: Backhuys Publishers.
UTERMÖHL, H. 1958. Zur Vervollkommnung der quantitativen phytoplankton-methodic. Mitteilungen Internationale Vereinigung für Theoretische und Angewandte Limnologie, vol. 9, no. 1, p. 1-39. VOLLENWEIDER, RA. and KEREKES JJ. 1982.
Eutrophication of waters: monitoring, assessment and control. Paris: OECD.
Received: 20 August 2013 Accepted: 05 June 2014 STANKOVIĆ, I., VLAHOVIĆ, T., UDOVIČ,
MG., VÁRBÍRÓ, G. and BORICS, G. 2012. Phytoplankton functional and morpho-functional approach in large floodplain rivers. Hydrobiologia, vol. 698, no. 1, p. 217-231. http://dx.doi. org/10.1007/s10750-012-1148-3
STEVIĆ, F., MIHALJEVIĆ, M. and ŠPOLJARIĆ, D. 2013. Changes of phytoplankton functional groups in a floodplain lake associated with hydrological perturbations. Hydrobiologia, vol. 709, no. 1, p.143-158. http://dx.doi.org/10.1007/s10750-013-1444-6 SUN, J. and LIU, D. 2003. Geometric models for