The Brazilian inve stme nt in
scie nce and te chno lo gy
Laboratório de Artrópodes Hematófagos, Departamento de Bioquímica Médica, Instituto de Ciências Biomédicas, Universidade Federal do Rio de Janeiro, Rio de Janeiro, RJ, Brasil
R. Pinheiro-Machado and P.L. de O liveira
Abstract
An analysis of Brazilian federal expenditures in science and technol-ogy is presented is this study. The 1990-1999 data were compiled from records provided by two federal agencies (MCT and CNPq) respon-sible for managing most of the national budget related to these activities. The results indicate that the federal investments in Brazilian science and technology stagnated during the last decade (US$ 2.32 billion in 1990, US$ 2.39 billion in 1996, and US$ 2.36 billion in 1999). In contrast, a great increase in private investments in research was acknowledged both by industry and by the government during the same period, from US$ 2.12 to US$ 4.64 billion. However, this investment did not result in an increase in invention patents granted to residents (492 in 1990 and only 232 in 1997) or in a reduction of patent costs. Despite this unfavorable scenario, the number of graduate programs in the country has increased two-fold in the last decade and the contribution of Brazilians to the database of the Institute for Scientific Information has increased 4.7-fold from 1990 (2,725 scien-tific publications) to 2000 (12,686 scienscien-tific publications). Unstable federal resources for science, together with the poor returns of private resources in terms of developing new technologies, may jeopardize the future of Brazilian technological development.
Co rre spo nde nce
R. Pinheiro-Machado Laboratório de Artrópodes Hematófagos
Departamento de Bioquímica Médica ICB, CCS, UFRJ
21941-590 Rio de Janeiro, RJ Brasil
Fax: + 55-21-270-8647
E-mail: rcpmachado@ bioqmed.ufrj.br
Research supported by CNPq, FINEP, PRO NEX, PADCT and Howard Hughes Medical Institute.
Received June 5, 2001
Accepted September 17, 2001
Ke y words
·Science and technology
·Research and development
·Patents
·Technological innovation
·Scientific publication
Intro ductio n
The construction and evolution of mod-ern scientific and technological capacity in Brazil began in the fifties, following the ideas originally proposed by Vanevar Bush (1). In his view, science was “an endless frontier” and all fields of knowledge de-served government support. The main idea was that investment in basic science would definitely result in technological develop-ment. Therefore, technological innovation obviously depended on investments in re-search and development (R&D) (2,3).
courses, which increased from 672 (1975) (5) to 1291 (1997) (6), and 3) an increase in the Brazilian contribution to publications in international scientific journals from 0.29 (1981) (7) to 1.11% (2000) (8) in relation to worldwide scientific publications.
In Brazil, as well as in other Latin Ameri-can countries, investment in science increased during the late 1970’s and early 1980’s, keeping pace with economic growth in the region. However, investments in science and technology (S&T) were curtailed when these countries began to have difficulties in pay-ing their large debts to international banks. This situation began to change in 1990, when a new wave of investment in science oc-curred (9).
According to the Brazilian Ministry of Science and Technology (MCT), investment in S&T is now growing, reaching a total of US$ 9 x 10⁹ in 1997, corresponding to 1.13%
of the gross domestic product (GDP) (10,11). Most industrialized countries invest more than 2% of their GDP in R&D. South Korea, a country that is approaching industrializa-tion, in this same year invested 2.8% of its GDP in S&T (12). Nevertheless, according to MCT data, Brazil’s level of investment in 1997 lies in a range similar to that of some developed countries such as Italy (1.05% of GDP) and Canada (1.64% of GDP) (13).
The aim of the present study was to ana-lyze the amount and effectiveness of Brazil-ian investments in S&T during the 1990’s, focusing on federal expenditures and com-paring data published by the agencies that administer this money with line items from the national budget.
Me tho ds
Data on Brazilian investments in S&T were obtained from official publications by the MCT and by the National Council for Scientific and Technological Development (CNPq), as well as from the national budget, accessed via internet at the National
Con-gress site (14). The data obtained were used to identify national expenditures on S&T, focusing primarily on federal investments from 1990 to 1997, the period that is covered by published MCT and CNPq reports.
The national budget figures, available for 1995 to 1999, were used to find expendi-tures allocated to federal institutions that devote more than 80% of their resources to S&T. Some of these institutions are directly subordinate to MCT, such as CNPq, the National Foundation for Scientific and Tech-nological Development (FNDCT) and the Agency for the Financing of Studies and Projects (FINEP). Other institutions are linked to different Ministries (Agriculture, Education, Air Force, Health, Energy, Navy, Industry and Trade, Army, and Environment): National Council for Graduate Studies (CAPES), Brazilian Agriculture Research Corporation (EMBRAPA), Oswaldo Cruz Institute (FIOCRUZ), National Council for Nuclear Energy (CNEN), National Institute for Educational Research (INEP), and Com-mission for Sea Resources Studies (SECIRM) (15).
We also used the national budget figures to obtain data on funding according to type of expenditure on S&T: graduate studies and fellowships, basic and applied research, ex-perimental development, metrology, hydrol-ogy studies, quality control, scientific and technological information, geological sur-veys, environmental sursur-veys, trademarks and patents, and human resources training. This information was used to provide one or two years of more recent data that overlap the available MCT figures, and also allowed us to extend our comparison to 1999.
from 1990 to 1996 our data were obtained from CNPq and MCT already expressed as 1996 R$. They were first converted to 1997 R$ average consumer price index (IGP-DI = 1.0748) and then to 1997 US dollars accord-ing to the average dollar value (R$ 1 = US$ 1.078) used by the Ministry of Treasury. The values corresponding to 1998 and 1999 were converted to 1997 R$ using the IGP-DI of each year and then to 1997 US dollars.The GDP was also converted to 1997 US dollars using the same methodology (17).
Investment by the industrial sector was also obtained from MCT reports (11). The Ministry uses a database created by the Na-tional Association for Industrial Develop-ment (ANPEI), which is devoted to collect-ing data from Brazilian industrial companies that invest in R&D. The ANPEI database represents more than 1,100 industries that are responsible for 42% of Brazil’s indus-trial GDP (18).
The number of fellowships granted by CNPq from 1980 to 1999 was obtained via the CNPq site(19) and the number of fellow-ships granted by CAPES was obtained from the Diretoria de Programas/Coordenação-Geral de Programas no País/Coordenadoria de Desenvolvimento Setorial from the insti-tute (20). The Brazilian contribution to the world scientific production from 1975 to 1999 was obtained from the Web of Science site, made available by the Institute of Scien-tific Information (8). The number of patents granted to industries that contribute data to the ANPEI database was taken from the ANPEI site (18). The patents granted to resi-dents in the country in the category of inven-tions were obtained from the National Insti-tute of Industrial Property (INPI) site (21). Patents involving only design were tabu-lated separately (see Results).
In order to regulate tax incentives granted to the productive sector the Brazilian gov-ernment created a law in 1993 (Law No. 8661/93) (22) to stimulate technological de-velopment in industry and agriculture through
investment in R&D. The concept of techno-logical capability adopted by this law covers a gamut of activities ranging from the devel-opment of research by industry to selection, absorption, improvement and dissemination of national or foreign technologies. This law was modified in 1997 by law No. 9532/97 (23) to stimulate the private sector to invest in R&D and to develop partnerships with research institutes and universities. The implementation of this law created a pro-gram to support industrial capability that is divided into two modalities, one for industry and the other for agriculture (24).
In 1995, the Brazilian Pluriannual Plan was approved taking into account an in-crease of private expenditure in S&T, and in addition other laws were created to stimulate national technology. Regulations to imple-ment these measures were elaborated and nowadays there are four laws to regulate incentives, law No. 8661/93 explained above, law No. 8248/91 directed at the production of software and hardware, and laws No. 8010/90 and No. 8032/90 that are designed to allow public and private research insti-tutes, respectively, to import research equip-ment without paying custom taxes (25).
Re sults and D iscussion
Brazilian inve stme nt in scie nce and
te chno lo gy
Data published by the Brazilian MCT show an absolute growth of almost 70% in national investment in S&T between 1990 and 1996, changing from US$ 6.41 billion in 1990 that represents 1.17% of the GDP (US$ 549.56 billion) to US$ 10.25 billion in 1996, which represents 1.3% of the GDP (US$ 790.92 billion) (11).
salaries paid to university professors), tax incentives granted to industries, investment by private and non-private industry, loans granted by FINEP, and salaries paid to pri-vate university teachers. Figure 1 shows the amount spent on S&T according to different funding sources from 1990 to 1996 and the total national investment, which is the sum of expenditures in the period (11,15,24,27).
Gove rnme nt e xpe nditure s
Federal spending on S&T, according to MCT, includes tax incentives granted to in-dustries. However, in this section we will treat federal spending without considering tax incentives, which will be discussed in another section.
In 1990, according to CNPq (using the national budget as data source), federal funds were US$ 2.32 billion and represented 45% of the S&T budget (US$ 5.14 billion). In 1996 federal funds increased to US$ 2.39 billion. Despite the increase in absolute value, federal spending in 1996 represented a smaller fraction of the total S&T budget (27.2%), suggesting that federal funds de-creased (15).
However, federal investment data re-ported by both CNPq and MCT have not been updated since 1996 and 1997, respec-tively. We obtained Brazilian budget data directly from the national congress site (avail-able from 1995 to 1999) in order to update these figures. Federal investment in S&T is extremely concentrated on a few main re-search or funding institutions that either sup-port or carry out scientific and technological activities. These are CNPq, FNDCT, FINEP, CAPES, EMBRAPA, FIOCRUZ, CNEN, INEP and SECIRM. In 1996, for example, these institutes together received 74.5% of all federal S&T funds. The other 25.5% were distributed as follows: 9.1% for military re-search, 3% to federal universities, 2.5% for MCT administration, and 10.9% to other institutions (15). From 1995 to 1999 (the period available through the internet) (14), the budget of these institutions decreased mainly for FINEP (51% less), CNPq (30% less) and CAPES (15% less), as shown in Figure 2.
An analysis of the Brazilian national S&T budget according to category of expenditure is shown in Figure 3. These data reinforce the conclusion that federal funds are de-creasing, mainly in modalities of
expendi-1 9 9 7 U S d o lla rs ( m ill io n ) 9000 8000 7000 6000 5000 4000 3000 2000 0 1000 Total
1990 1991 1992 1993 1994 1995 1996
Industry Federal
State Tax incentives Private universities Figure 1. Brazilian expenditures
in science and technology. Cat-egories are defined according to the Canberra M anual (26). The total investment per year is the sum of expenditures from the follow ing funding sources: fed-eral government, industry, tax in-centives granted to industries, state funding agencies and sala-ries for private university teach-ers. Values w ere converted to 1997 US dollars as explained in the M ethods section. Source: CNPq-1 (federal expenditures) M CT/FINEP (tax incentives) and M CT-2 (other investments).
1 9 9 7 U S d o lla rs ( m ill io n ) 2500 2000 1500 1000 500 0
1995 1997 1998 1999
CNPq CAPES EM BRAPA FINEP FIOCRUZ CNEN FNDCT Others Figure 2. Funds allocated to the
principal federal institutions that carry out or support scientific and t echnological act ivit ies. “ Others” refers to INEP and SECIRM . FINEP funds in 1999 are partial. Values w ere con-verted to 1997 US dollars as ex-plained in the M ethods section. The list of abbreviations is also given in the M ethods section. Source: National Budget and FINEP (Ref 28).
ture that are linked to R&D such as basic research and human resources training. In 2000, for example, CNPq offered a funding program of only R$ 30 x 106 (US$ 15
mil-lion) to basic research projects directly re-quested from the agency by the whole Bra-zilian scientific community, which repre-sents 11,760 active research groups with a total of 49,956 researchers (29).
The decline in funding can also be in-ferred from the number of fellowships granted by CNPq and CAPES for M.Sc. and Ph.D. students (Figure 4). From 1990 to 1995, there was a 47% increase in the number of fellowships granted by these agencies. How-ever, from 1995 to 1999 the number of gradu-ate fellowships declined from 27,955 to 25,883 (19,20). This reflects a decrease in M.Sc. fellowships: in 1990, 15,716 fellow-ships were awarded; this increased by 27% to a total of 19,960 in 1995, but in 1999 there were only 16,384, almost the same number as at the beginning of the decade. The impact on M.Sc. fellowships was greater at CNPq where a 52% decrease was observed from 1995 to 1999. This is consistent with the decrease in funds allocated to CNPq that appeared in the national budget for 1999 than in funds allocated to CAPES (Figure 2). Figure 5 shows a comparison between federal investment according to CNPq (Fig-ure 1) and our budget update for institutions (Figure 2) and modalities of expenditure on S&T (Figure 3). Overall, the total invest-ment in 1995/1996 (where data from all three sources overlap) was similar regard-less of the source of information and almost the same as the value reported by CNPq. The inset in Figure 5 shows the percentage of
1 9 9 7 U S d o lla rs ( m ill io n ) 2000 1500 1000 500 0
1995 1996 1997 1998 1999
Graduate courses/ fellow ships Basic research Applied research Experimental development
Figure 3. Federal f unds dis-bursed for science and technol-ogy according to type of activity. “ Others” refers to metrology, hydrology, quality control, scien-tific and technological informa-tion, geological surveys, trade-marks and patents, and environ-mental surveys. Values w ere converted to 1997 US dollars as explained in the M ethods sec-tion. Source: National Budget.
· · · · · · · · · · · · · · · · · · · · · · · · · · · · · · · · · · · · · · · · · · · · · · · · · · · · · · · · · · · · · · · · · · · · · · · · · · · · · · · · · · · · · · · · · · · · · · · · · · · · · · · · · · · · · · · · · · · · · · · · · · · · · · · · · · · · · · · · · · · · · · · · · · · · · · · · · · · · · · · · · · · · · · · · · · · · · · · · · · · · · · · · · · · · · · · · · · · · · · · · · · · · · · · · · · · · · · · · · · · · · · · · · · · · · · · · · · · · · · · · · · · · · · · · · · · · · · · · · · · · · · · · · · · · · · · · · · · · · · · · · · · · · · · · · · · · · · · · · · · · · · · · · · · · · · · · · · · · · · · · · · · · · · · · · · · · · · · · · · · · · · · · · · · · · · · · · · · · · · · · · · · · · · · · · · · · · · · · · · · · · · · · · · · · · · · · · · · · · · · · · · · · · · · · · · · · · · · · · · · · · · · · · · · · · · · · · · · · · · · · · · · · · · · · · · · · · · · · · · · · · · · · · · · · · · · · · · · · · · · · · · · · · · · · · · · · · · · · · · · · · · · · · · · · · · · · · · · · · · · · · · · · · · · · · · · · · · · · · · · · · · · · · · · · · · · · · · · · · · · · · · · · · · · · · · · · · · · · · · · · · · · · · · · · · · · · · · · · · · · · · · · · · · · · · · · · · · · 12345 12345 12345 12345 12345 12345 12345 12345 12345 12345 12345 123456 123456 123456 123456 123456 123456 123456 123456 123456 123456 123456 123456 123456 12345 12345 12345 12345 12345 12345 12345 12345 12345 12345 12345 12345 12345 12345 12345 12345 12345 12345 123456 123456 123456 123456 123456 123456 123456 12345 12345 12345 12345 12345 12345 12345 12345 12345 12345 12345 12345 12345 12345 12345 · · · · · · · · Others 12345 12345
Figure 5. Federal funding for science and technology according to CNPq (squares), Figure 2 (filled circles), and Figure 3 (open circles). The inset show s the per-centage of federal investment in institutions (filled circles) and in the main modalities of science and tech-nology (open circles) in relation to the total national budget from 1995 to 1999. Source: National Budget, CNPq and FINEP.
1 9 9 7 U S d o lla rs ( m ill io n ) 3000 2500 2000 1500 1000 0 1999 500 1998 1997 1996 1995 1994 1993 1992 1991 1990 1999 1998 1997 1996 1995 0.8 0.6 0.4 0.2 0.0 % N a ti o n a l b u d g e t N u m b e r o f fe llo w s h ip s 30000 25000 20000 15000 10000 0
19901991 1992 19931994 1995 1996 1997 1998 1999
5000
federal investment in relation to the total national budget from 1995 to 1999 (period available). According to the national budget, the decrease in the budget of the main insti-tutions during the period was from 0.63 to 0.55% in relation to the total federal budget. The main modalities of expenditures on S&T decreased from 0.67 to 0.43 during the same period. These data support the idea that the institutes and the main R&D modalities are losing ground.
According to May (30), in a selected group of countries that together account for 80% of the world’s total investment in R&D, the government is in most cases the main source of funds for basic science, which is mainly carried out at universities. In Brazil, basic science is also a university enterprise. According to de Meis and Leta (31), the research centers that produce most of the scientific papers are universities. In 1995, for example, 75.2% of all active researchers were working at universities (15).
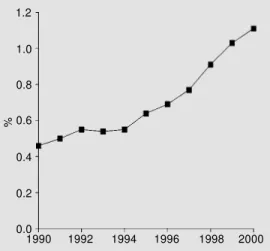
Despite the fact that funds for basic sci-ence are decreasing (Figure 3), Brazil’s share of world scientific articles increased from 1981 to 2000. Figure 6 shows that the Brazil-ian contribution during the nineties increased 2.4-fold from 0.46% of world publications in 1990 to 1.11% in 2000. The impact on this trend of the decrease in the number of gradu-ate fellowships and in federal investment that began in 1995 is likely to be felt in the
next few years.
Figure 1 also shows that state research funds (20 states in 1996) have increased by 1.6-fold during the period. In São Paulo and Rio de Janeiro, the number of scientific pub-lications increased by a factor of 3.26 and 2.86, respectively, from 1990 to 2000; in other states (Minas Gerais, Rio Grande do Sul, Santa Catarina and Paraná) the scien-tific contribution increased, on average, by a factor of 4.5 (8). These data suggest that funding by some state research agencies is beginning to contribute significantly to sci-entific development in the country.
Unive rsity profe ssors
A UNESCO recommendation released in 1978 identified three different categories of expenditures on S&T: research and devel-opment, technological services, and educa-tion and training in S&T (32). Part of the salaries paid to university professors is in-cluded in the last category. Since part of the salaries paid to federal and state professors is computed in federal expenditures, Figure 1 separately shows the amount paid annually to private university teachers, about US$ 350 million from 1990 to 1996. However, this guideline, which is also a norm of the Canberra Manual (26), may not apply to the Brazilian situation. Despite the fact that pri-vate universities account for 65% of student enrollment (4),they were responsible for only 1.02% (N = 887) of Brazil’s scientific publications from 1990 to 2000 (N = 86,939). Among the 82 private universities, only 37 contributed to the Brazilian scientific effort by publishing in indexed journals (8).
Industrial re se arch and de ve lopme nt
Figure 1 shows the amount spent by in-dustry on R&D, as estimated by MCT: the values reported in the ANPEI database were multiplied by 1.33 (in order to include com-panies not listed by ANPEI) and added to the
Figure 6. Brazil’s share of w orld scientific publications from 1990 to 1999. Source: Web of Sci-ence.
%
1.2
1.0
0.8
0.6
0.4
0.0 1990 0.2
investments reported by industries that were granted tax incentives under the laws set up to stimulate R&D activities (1). We note that this procedure tends to inflate the invest-ment calculation, since adhesion to ANPEI is voluntary, and therefore the figures are likely to include most of the companies that actually do invest in R&D. The companies that do not belong to ANPEI are also not likely to carry out R&D activities.
Using the ANPEI database, the MCT has estimated that industrial spending on R&D more than doubled between 1993 and 1996 (Figure 1). This growth would be expected to bring an increase in productivity. Patents are considered to be an indicator of indus-trial performance. Kondo (33,34)has shown that in Japan there is a positive correlation between the rise in R&D expenditures and the increase in the number of patent applica-tions. Thus, the increase in R&D investment by Brazilian industries should be accompa-nied by an increase in the number of patent applications. According to ANPEI, the num-ber of patents granted to industries that com-prise their database is less than one per year per company (18), suggesting that invest-ments by these firms are not producing tech-nological innovations. This problem may be related to the profile of the firms that inte-grate the database. According to Scherer (35), patenting activity varies among differ-ent industrial sectors and according to other characteristics such as the size of the com-pany.
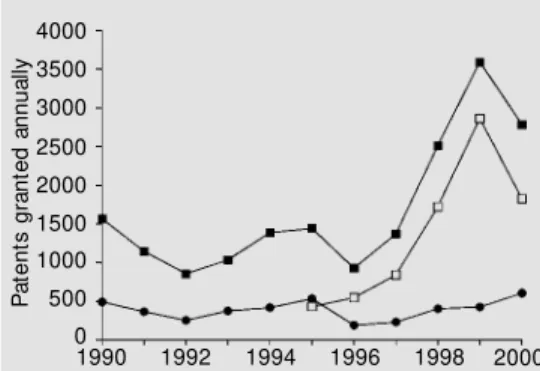
We checked the number of patents granted to residents by INPI (21) from 1990 to Octo-ber 2000 (Figure 7). There was an increase in the number of patents granted during the period, but these data included patents granted to individuals as well as to compa-nies. It is important to note that this increase in domestic patents mainly reflects an in-crease in the number of design patents (de-fined as describing new and non-ornamental design features in an already existing article of manufacture) as shown in Figure 7. These
patents protect only the appearance of the article, not its structural or functional fea-tures. In 1999, for example, of 3,595 patents granted to residents, 80% were design pat-ents and only 12% were patpat-ents of invention, defined as innovative processes or devices. The number of invention patents (lower curve in Figure 7) does not show a significant increase over the last decade. These data suggest therefore that industry expenditures may not reflect real technological advances.
Tax ince ntive s
Tax incentives are widely employed in different countries as a means of stimulating private investments in S&T. The interna-tional experience reveals that tax incentives are the principal instrument used to induce industrial R&D activities and to integrate the knowledge produced at universities and re-search institutes with industrial technologi-cal needs. According to Marcovitch et al. (36), the main incentives granted in different countries are deductions from taxable in-come of expenditures in R&D, rapid depciation of machines and equipment, and re-ductions in import taxes. Countries that ap-ply these incentives include, for example, the United States, Japan, France, Canada, Germany, Australia, South Korea, Taiwan, United Kingdom, Austria, Holland, and Bel-gium. The treatment of R&D tax systems varies extensively between countries and over time depending on differential inflation and economic interests. Canada, for example,
Figure 7. Patents granted as an indicator of successful invest-ment in research and develop-ment. The figure show s the to-tal number of patents granted to Brazilian companies and indi-viduals (filled squares), and sub-divided according to class, i.e., invent ion (circles) or design (open squares). Data for 2000 are partial (January-October). Source: INPI.
P
a
te
n
ts
g
ra
n
te
d
a
n
n
u
a
lly
4000
3500
3000
2500
2000
2000 1998 1996 1994 1992 1990 1500
1000
500
has been providing income tax incentives since 1944 including accelerated deductions, incremental bonus deductions and invest-ment tax credits (20% or more). In general, current expenditures that are eligible for tax incentives include salaries of employees di-rectly engaged in R&D, the cost of materials consumed, costs related to machinery and equipment used (90% or more), and expen-ditures incurred by contractors.
In Brazil, the main incentives are a 90% tax reduction for equipment importation, deduction of costs with employees and roy-alties paid to third parties, accelerated depre-ciation of equipment and machines, and tax reductions.
The amount granted in tax incentives from 1990 to 1996 in Brazil is shown in Figure 8. Between 1991 and 1993 there was a sharp increase to a relatively constant value around US$ 1.4 billion.
As a whole, our analysis indicates that the 1990’s were a decade of stagnation for investments in S&T. The stagnant funding of public science (Figures 2 and 3), allied to poor returns from investment in technology (Figure 7), certainly jeopardizes the future of Brazilian technological development.
Despite the decrease in funds for basic research (Figure 3), the scientific commu-nity production, consisting mainly of basic and applied research, is becoming more effi-cient. In 1995, for example, the cost of a scientific publication (federal expenditures
on basic and applied research/number of publications) was US$ 106.82 thousand per paper, and in 1999, the cost was 55% less (US$ 48.36 thousand per paper). On the other hand, there was a two-fold increase in company declared expenditures and tax in-centives to industry (in 1990 US$ 2.12 bil-lion was spent, and in 1997, expenses were US$ 4.64 billion) (Figure 1). This increase in funds did not bring an increased production of invention patents granted to residents (492 in 1990 and only 232 in 1997); in fact, the number of patents decreased two-fold and the cost of a patent increased at the same proportion.
The data suggest that the new invest-ments in S&T (industry expenditures and tax incentives) are not reflecting technological development. The “productive” investment in S&T (federal and state funds), in 1997, for example, represented half of the total expen-ditures (US$ 4 billion), which represented 0.5% of the GDP.
According to McMillan et al. (37), public science plays an important role in industrial development, mainly in biotechnology and pharmaceutical industries, because this kind of enterprise depends on the knowledge pro-duced at universities and research institutes to develop technological innovations.
Therefore, to enhance technological de-velopment it is important to maintain federal funds for scientific activities in order to ob-tain the knowledge that could susob-tain na-tional production of new processes and de-vices. Moreover, it is important that the Bra-zilian industries apply funds to “real” re-search and not merely limit their effort to quality control and minor modifications of products to conform to costumer require-ments, an approach that cannot be consid-ered as industrial research and that will not sustain technological development. Accord-ing to Albuquerque (38) and the United States Patent and Trademark Office (USPTO) (39), among all Brazilian industries, there are three that had the largest number of patents granted
Figure 8. Tax incentives granted to stimulate industrial invest-ment in research and develop-ment. Data for 1995 w ere not available. Source: M CT/FINEP.
2000 1800
1600
1400
1200
1000
800 600
400 200
0
1
9
9
7
U
S
d
o
lla
rs
(
m
ill
io
n
)
by USPTO during the 1980-2001 period, i.e., Petrobrás (134 patents), Embraco (53 patents), and Metal Leve (32 patents). Ex-cept for Petrobrás which had six patents granted per year, the others have two patents or less per year. Rarely is real innovation pursued, even by commercially successful companies such as Embraer, which has no
patent granted by USPTO or by INPI.
Ackno wle dgm e nts
We are grateful to Leopoldo de Meis and Martha Sorenson, UFRJ, for a critical read-ing of the manuscript.
Re fe re nce s
1. Bush V (1990). Science: The Endless Fron-tier. National Science Foundation, USA, July 1945, reprinted 1960, 1980 and 1990, Washington, DC, USA.
2. Beiguelman B (1997). Reflexões sobre a pós-graduação. In: Anais do Simpósio A Pós-Graduação no Brasil, UFRJ, Rio de Janeiro, RJ, Brazil, 33-48.
3. Schw artzman S, Krieger E, Guimarães EA & Bertero CO (1993). Ciência e Tecnologia no Brasil: Uma Nova Política Para um M undo Global. Documento síntese do es-tudo sobre “ O Estado Atual e o Papel Futuro da Ciência e da Tecnologia no Brasil” . Escola de Administração de Em-presas, Fundação Getúlio Vargas, São Paulo, SP, Brazil.
4. INEP - Instituto Nacional de Estudos e Pesquisas Educacionais. Available at: http://w w w .inep.gov.br. Accessed April 2001.
5. Resende SM (1998). Pós-graduação e pesquisa no Nordeste. In: Anais do Sim-pósio A Pós-Graduação no Brasil. UFRJ, Rio de Janeiro, RJ, Brazil, 109-132. 6. CAPES - Coordenação de
Aperfeiçoa-mento de Pessoal de Nível Superior. Avail-able at: http://w w w .capes.gov.br. Ac-cessed December 2000.
7. Leta J, Lannes D & de M eis L (1998). Human resources and scientific produc-tivity in Brazil. Scientometrics, 41: 313-324.
8. Institute for Scientific Information (ISI) via W eb of Science. Available at: http:// w ebofscience.fapesp.br. Accessed De-cember 2000.
9. Ayala FJ (1995). Science in Latin America.
Science, 267: 826-827.
10. M CT-1 - M inistério da Ciência e Tecnolo-gia (1998). Ciência & Tecnologia nos Anos 90: A Década do Crescimento. M CT, Brasília, DF, Brazil.
11. M CT-2 - M inistério da Ciência e
Tecnolo-gia (1997). Indicadores Nacionais de
Ciên-cia e Tecnologia 1990-96. M CT, Brasília, DF, Brazil.
12. UNESCO - United Nations Educational, Scientific and Cultural Organization. Avail-able at: http://unescostat.unesco.org/en/ stats/stts0.htm. Accessed June 2000. 13. OECD - Organization for Economic
Co-operation and Development, Science and Technology Indicators. Available at: http:// w w w .dt i.gov.UK/ost /set st at s/dat a/7/ tab7_1.htm. Accessed September 2000. 14. National Congress. National Budget.
Avail-able at: http://w w w .camara.gov.br. Ac-cessed June 2000.
15. CNPq-1 - Conselho Nacional de Desenvol-vimento Científico e Tecnológico. Des-pesas Realizadas pela União em Ciência e Tecnologia: 1987-96. CNPq, Brasília. Avail-able at: http://w w w .cnpq.br/publicações/ druct96. Accessed September 1999. 16. M inist ério da Fazenda. Inform ações
Adicionais - PIB, M oedas, Índices de Preços e Fonte de Dados. M F, Brazil. Available at: w ysiw yg://106/http://w w w . receit a.f azenda.gov.br/Arrecadação/ Carga_Fiscal/1999/inf oadic.ht m . Ac-cessed December 2000.
17. American Average Consumer Price Index. Available at: http://stats.bls.gov/cpihome. htm. Accessed December 2000. 18. ANPEI - Associação Nacional de Pesquisa
e Desenvolvimento das Empresas Indus-triais. Indicadores Empresariais de
Inova-ção Tecnológica: Síntese dos Dados no Período 1993-1997. Available at: http:// eu.ansp.br/~ anpei/link3.htm #base. Ac-cessed June 1998.
19. CNPq-2 - Conselho Nacional de Desenvol-vimento Científico e Tecnológico. Séries Históricas do Fomento do CNPq - 1995/ 98. Available at: http://w w w .cnpq.br/sup/ fom ento/tabela9.htm l. Accessed April 2000.
20. CAPES/DPR/SPP/CDS - Fundação Coor-denação de Aperfeiçoamento de Pessoal de Nível Superior - Diretoria de Programas - Coordenação Geral de Programas no País - Coordenadoria de Desenvolvimen-to SeDesenvolvimen-torial. Relatório de concessão de bolsas por área. File obtained via e-mail: henni.santos@capes.gov.br.
21. INPI - Instituto Nacional de Propriedade Industrial. Available at: http://w w w .inpi. gov.br. Accessed August 2000. 22. M CT - 3 - M inistério da Ciência e
Tecnolo-gia (1998). Legislação Básica de Ciência e Tecnologia. M CT, Brasília, DF, Brazil, 202. 23. M CT-3 - M inistério da Ciência e Tecnolo-gia (1998). Legislação Básica de Ciência e Tecnologia. M CT, Brasília, DF, Brazil, 72. 24. M CT/FINEP - M inistério da Ciência e
Tec-nologia - Financiadora de Est udos e Projetos (1998). Estudos dos Impactos e Resultados dos Incentivos Fiscais de que Tratam as Leis 8.248/91 e 8.661/93. Brasília, DF, Brazil, 136.
25. M CT-4 - M inistério da Ciência e Tecnolo-gia. Plano Plurianual de Ciência e Tecnolo-gia do Governo Federal - PPA 1996/99. Brasília, DF, Brazil, 141.
26. OECD - Organization for Economic Co-operation and Development (1995). The M easurement of Scientific and Techno-logical Activities: M anual on the M easure-ment of Human Resources Devoted to Science and Technology “ Canberra M anual”, Paris, France.
27. M inistério da Fazenda - Secretaria da Re-ceita Federal. Consolidação dos
Benefí-cios Tributários por Receita e M odalidade de Benefício. Available at: http://w w w . receita.fazenda.gov.br. Accessed August 2000.
Desenvol-vimento Científico e Tecnológico. Re-search Groups. Available at: http://w w w . cnpq.br/plataformalattes/dgp/versao4. Ac-cessed M ay 2001.
30. M ay RM (1998). The scientific invest-ments of nations. Science, 281: 49-51. 31. de M eis L & Leta J (1996). O Perfil da
Ciência Brasileira. Editora UFRJ, Rio de Janeiro, RJ, Brazil.
32. UNESCO - United Nations Educational, Scient if ic and Cult ural Organizat ion (1978). Recommendation Concerning the International Standardization of Statistics on Science and Technology. Paris, France.
33. Kondo M (1995). Dynamic analyses on the relation betw een R&D and patent ap-plications in Japan. Journal of Science Policy and Research M anagement, 10: 193-204.
34. Kondo M (1999). R&D dynamics of creat-ing patents in the Japanese industry. Re-search Policy, 28: 587-600.
35. Scherer FM (1983). The propensity to patent. International Journal of Industrial
Organization, 1: 107-128.
36. M arcovitch J, Sbragia R, Stal E & Terra JCC (1991). Inovação tecnológica e incen-tivos fiscais. Revista de Administração,
26: 75-83.
37. M cM illan GS, Narin F & Deeds DL (2000). An analysis of the role of public science in innovation: the case of biotechnology.
Research Policy, 29: 1-8.
38. Albuquerque EM (2000). Domestic pat-ents and developing countries: argumpat-ents for their study and data from Brazil (1980-1995). Research Policy, 29: 1047-1060. 39. USPTO - United States Patent and