ENVIRONMENTAL APPROACH OF COMPANIES
WITHIN THE PULP/PAPER, METALLURGICAL
AND SUGAR/ALCOHOL SECTORS
Laércio Antônio Gonçalves Jacovine1*; Wellerson David Viana2; Ricardo Ribeiro Alves2; Michele Karina Cotta Walter3; Márcio Lopes da Silva1; Sebastião Renato Valverde1
1
UFV - Depto. de Engenharia Florestal, Campus Universitário - 36571-000 - Viçosa, MG - Brasil.
2
UFV - Programa de Pós-Graduação em Ciência Florestal.
3
UNICAMP Programa de PósGraduação em Engenharia Agrícola, Cidade Universitária “Zeferino Vaz” 13083-875 - Campinas, SP - Brasil.
*Corresponding author <jacovine@ufv.br>
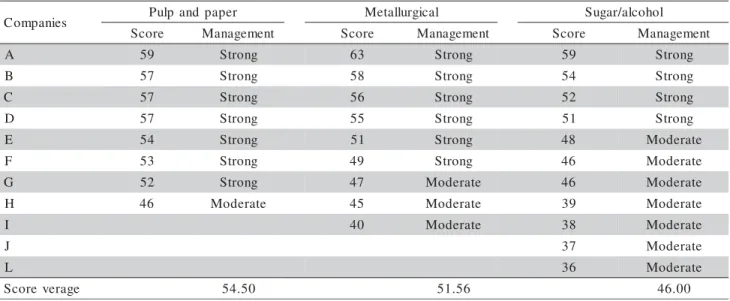
ABSTRACT: Companies have been witnessing major changes in their environment and environmental models have been developed aiming to improve their strategic planning. The objective of this study was to examine the environmental approach adopted by companies within the Pulp and Paper, Metallurgical and Sugar and Alcohol sectors, in order to evaluate their environmental performances. The analysis was based on a matrix which relates managerial functions with a set of environmental approaches and performance indicators, classifying the company environmental performance as weak, moderate or strong. The managerial functions approached in this model are: Management (General, Legal Affairs, Finance, Human Resources and Purchasing); Product and Process Development; Production and Maintenance; and Marketing. The analyzed indicators include: international insertion; capital origin and location. The pulp and paper and metallurgical companies obtained average scores of 54.5 and 51.56 points, respectively, being classified as having a strong environmental performance. On the other hand, the sugar and alcohol companies obtained average score of 46 points, being classified as moderate in environmental performance. The high level of environmental performance of pulp and paper and metallurgical companies can be attributed to the following factors: larger international insertion, presence of foreign capital in controlling shares, performance in the international market and company location near large population centers. Pulp and paper and mainly sugar and alcohol companies are less efficient in meeting the requirements of the environmental legislation, particularly those related to the conformity of permanent protected areas and legal reserves.
Key words: environment, managerial functions, environmental performance
CONDUTA AMBIENTAL DE EMPRESAS DOS SETORES DE
CELULOSE E PAPEL, SIDERÚRGICO E SUCROALCOOLEIRO
INTRODUCTION
In the last decades companies have been wit-nessing major changes in their environment. The com-petitiveness of an organization does not depend on eco-nomic factors only, but also on a socially valued man-agement that guarantees its legitimacy and survival in the environmental context. Companies have been seek-ing to adopt socially responsible postures, occurrseek-ing therefore a process of continuous renewal, either in the way of operating the business or the management of the organizations (Sanches, 2000; Silva & Barbosa, 2002; Coutinho & Soares, 2002).
Environmental models have been developed aiming at aiding the strategic planning of companies, among them, the environmental strategic evaluation model proposed by Abreu (2001) entitled “Structure, Conduct, and Performance Environmental” (SCP -environmental). This model allows the inference of companies’ environmental performance, based on the analysis of themselves and their competitors’ manage-ment, under the pressures of the market in which they operate. The SCP-environmental model seeks to con-firm the existence of similar behaviors, which can be grouped according to the environmental management profile, classifying as weak, moderate or strong each managerial function in the company.
The conception of the model is based on the principle that the environmental performance of a firm is a consequence of its competitive practices or pat-terns of environmental behavior, which in turn, de-pends on the market structure where it is inserted. In this way, it is therefore important to evaluate the adopted environmental behavior in order to verify the environmental performance of companies of the sec-tors Cellulose and Paper, Metallurgy and Sugar & Al-cohol. The objectives of this work were to examine the environmental management of companies within these sectors, to evaluate their performance in envi-ronmental terms, as well as to analyze the determinant factors that could influence this performance, based on the SCP environmental model.
MATERIAL AND METHODS
Definition of studied companies and sectors Companies from the Southeast Region of Brazil, within the pulp and paper and metallurgical sector, rep-resenting the forest sector, and sugar and alcohol sec-tor, representing the agricultural secsec-tor, were chosen as object study. The metallurgical sector is a large con-sumer of charcoal originated from planted forests. The Southeast region was chosen for holding the largest number of companies in the referred sectors.
The three sectors were chosen on the basis of criteria such as production chain integration and simi-larity in the use of natural resources; from raw mate-rial acquisition to production processes, as these sec-tors adopt integration along the production chain, from raw material acquisition (eucalyptus for firms of cel-lulose and paper and charcoal-based siderurgy and sugar-cane for firms of the sugar-alcohol sector) to the production process, and the acquisition of natural resources cause similar environmental impacts on the set of components acting on the subsystems of the cropping system (planting or ratoon, development and harvest), the main operations (soil management and/ or replanting, maintenance and manual and/or me-chanical harvesting), the use of techniques and tech-nologies (amendment fertilizers and pest control us-ing insecticides and herbicides) and the production pro-cess (water use, energy use, pollutant emission, ef-fluent discharge, solid residue production).
The companies in this study should meet two criteria considered important for the comparison among the sectors. Companies working in a vertically inte-grated production system gain the control of all the operations inherent to its product, being possible to trace their environmental management starting from the wood production or land cultivation until the final prod-uct is processed in their industries. Companies that are similar regarding the use of natural resources would facilitate the comparison of environmental manage-ments, which is objective of this work. The compa-nies are similar for working with renewable resources, such as wood and sugar cane.
Questionnaire design
A questionnaire was designed based on the in-dicators that compose the matrix of environmental con-duct characteristics, proposed by Abreu (2001). This matrix has the managerial functions in the rows, the weak, moderate or strong environmental management in the columns, and the characteristics related to the interaction row x column in the interior of the matrix. The questionnaire consisted of twenty one questions about the managerial functions Management (General, Legal Affairs, Finance, Human Resources and Purchas-ing); Product and Process Development; Production and Maintenance; and Marketing.
These functions were analyzed to evaluate which are allocated with more or less effort from the assessed companies. The other questions were comple-mentary to the matrix, helping to identify possible con-tradictory answers.
sent to the sugar and alcohol companies, 32 to the metallurgical companies and 26 to the pulp and paper companies (populations of the sectors), 7.1%, 28.1% and 30.8% were returned, respectively (Table 2). These return percentages met the minimum sample size, mod-erately rigorous, recommended by the guidelines for sample size definition according to Little (1997), apud Jacovine (2000), that are 7.0% for the sugar-alcohol sector and 20.0% for the siderurgy and cellulose and paper.
The returned questionnaires were validated through the recognition of the respondent, who should be responsible for the environmental area, confirming whether, in fact, there is in the firm a person in charge and/or an environmental department in its organizational structure. All the questions related to the management functions were validated through supplementary ques-tions that attested the veracity of the answers. Non-validated questions were not verified.
Stratification system
The stratification system for each managerial function used the following scoring system: 1 point for weak environmental management; 2 points for
moderate management; and 3 points for strong man-agement. Company stratification based on the pre-sented results used the following limits: weak environ-mental management: from 21 to 34.5 points; moder-ate from 35 to 48.5 points; and strong from 49 to 63 points. The adopted criteria allow a certain similarity among the companies within the sectors and facilitate their comparison among sectors, and, the criterion ver-tical production is generally present in larger compa-nies.
The limits presented in Table 1 were used for the analysis of managerial functions. The interval of each management strength is 0.66. In cases of more than one question per function, it was considered enough to multiply it by the total. For the purpose of the analysis, the average score obtained for each sec-tor was calculated, and, thereafter, the environmental output for each function was evaluated on the basis of the limits defined above.
Indicators used to evaluate management functions As for the management function Legal Man-agement, the following indicators were analyzed: Knowledge on Environmental Legislation (EL);
Keep-s n o i t c n u f l a i r e g e n a
M NumberofQuestions Weak Moderate Strong
t n e m e g a n a M l a r e n e
G 4 4.00 to6.67 6.68 to9.35 9.36to12.00
t n e m e g a n a M s r i a f f A l a g a e
L 2 2.00to3.33 3.34to4.67 4.68 to6.00
t n e m e g a n a M e c n a n i
F 3 3.00to5.00 5.01to7.01 7.02 to9.00
t n e m e g a n a M s e c r u o s e R n a m u
H 1 1.00to1.66 1.67to2.33 2.34to3.00
t n e m p o l e v e d s s e c o r p d n a t c u d o r
P 1 1.00to1.66 1.67to2.33 2.34to3.00
t n e m e g a n a M g n i s a h c r u
P 1 1.00to1.66 1.67to2.33 2.34to3.00
e c n a n e t n i a M d n a n o i t c u d o r
P 5 5.00to8.33 8.34to11.67 11.68to15.00
t n e m e g a n a M g n i t e k r a
M 4 4.00 to6.67 6.68to9.35 9.36to12.00
Table 1 - Scoring limits for the classification of environmental management for each managerial function.
s e i n a p m o
C Pulpandpaper Metallurgical Sugar/alcohol
e r o c
S Management Score Management Score Management
A 59 Strong 63 Strong 59 Strong
B 57 Strong 58 Strong 54 Strong
C 57 Strong 56 Strong 52 Strong
D 57 Strong 55 Strong 51 Strong
E 54 Strong 51 Strong 48 Moderate
F 53 Strong 49 Strong 46 Moderate
G 52 Strong 47 Moderate 46 Moderate
H 46 Moderate 45 Moderate 39 Moderate
I 40 Moderate 38 Moderate
J 37 Moderate
L 36 Moderate
e g a r e v e r o c
S 54.50 51.56 46.00
ing up with the Environmental Legislation; Legal com-pliance with the Environmental Legislation in Areas of Permanent Preservation and Legal Reserve, in com-pliance with the Environmental Legislation. The firms of this sector adopted an intermediate environmental behavior, since most firms only partially know the EL, keep up with the EL in a non-systematic way and have PPA and Legal Reserve in compliance with the EL.
For the management function Financial Man-agement the following indicators were analyzed: Defi-nition of volume of investment; Percentage invested in Environment; and Financial return of environment investment. In this way, the firms of this sector adopt an intermediate environmental behavior, because most firms define the volume of investment in order to com-ply with the Environmental Legislation and in the in-ternally generated projects in a spontaneous way; the percentage invested in environment is between 1% and 2%; the financial return is tied to the reduction in waste and commercialization of residues generated from modifications of the production process.
The management function Human Resources Management shows that most firms of the sector adopt an intermediate environmental behavior, as they have environmental education programs toward basic actions. For the management function Procurement Management, most firms of the sector adopt an inter-mediate environmental behavior, as they adopt, in part, minimum environment requirement standards for their suppliers.
The management function Marketing Manage-ment shows that most firms use the customer service system to deal with complaints of the interested par-ties; do not produce reports on environmental perfor-mance; have started to identify competitive advantages with environmental performance and communicate in-formation about environmental issues on a non-regu-lar basis, showing that such firms adopt an interme-diate environmental behavior. For the management function “Production and Maintenance”, the firms adopt an intermediate environmental behavior, as for most firms the adoption of technologies to reduce en-vironmental impacts is tied to purchase of equipment of lower input consumption.
RESULTS AND DISCUSSION
Environmental management per sector
The average scores (Table 2) for companies of the pulp and paper and metallurgical sectors classi-fied them as of strong environmental management (54.5 and 51.6 points respectively), according to the limits established by the methodology. On the other hand, the companies of the sugar and alcohol sector
had a medium score (46 points) that classifies them as having a moderate environmental behavior. The pulp and paper sector showed the highest concentration of companies (87.5%) adopting the strong environmen-tal management, followed by the meenvironmen-tallurgical (66.7%), whereas the sugar and alcohol sector showed higher concentration of companies (63.6%) adopting moder-ate environmental management (Table 3). These results indicate that the companies are committed with envi-ronmental issues.
Environmental conduct per managerial function The managerial functions were classified ac-cording to their environmental management based on the score limits established by the methodology (Table 1). The score was obtained with weight 1 for weak, 2 for intermediate, and 3 for strong environmental behavior. The total score was used to obtain a general average to verify the environmental behavior of the firm.
clas-sified as of moderate environmental management. This shows that the companies within this sector are allo-cating less effort in complying with external aspects, which results in inefficiency in communicating with stakeholders (shareholders, customers, community) and in disseminating environmental actions taken, be-sides, little concern in establishing environmental stan-dards for suppliers. Likewise, companies offer little concern for developing some kind of environmental education program directed to their collaborators and the community, since environmental education will be used to guide their decision-making process. The ex-pression “less effort” of companies with moderate en-vironmental management is a comparison with com-panies with strong environmental management. In ad-dition, all the questions related to management func-tions were validated by complementary quesfunc-tions that confirmed the reliability of the answers and the exist-ence of this relationship.
Companies within the sugar and alcohol sector had the functions “Human Resources Management”, “Purchasing Management” and “Marketing Manage-ment”, similarly to the metallurgical sector, along with the functions “Legal Affairs Management”, “Finance Management” and “Production and Maintenance” clas-sified as of moderate environmental behavior. These functions include the themes environmental education, consumer service, environmental legislation, environ-mental investment, environenviron-mental management and en-vironmental impact. This shows that the companies are
also allocating less effort in developing some kind of environmental education program directed to their col-laborators and the community, as well as showing less concern for the environmental variable in their produc-tive process and in the definition, and allocating less fi-nancial resources to environmental investments.
Analysis of determinant factors of environmental performance
The analysis of the determinants of environ-mental performance described by Maimon (1994), in-ternational insertion and capital origin and location, can confirm the influence of these factors on the environ-mental performance of the studied companies. The in-dicators mentioned refer to those that need more at-tention by the firms. The firms have dealt with the oth-ers in a balanced way.
International Insertion - Table 5 shows the metallurgical and pulp and paper sectors have the larg-est export percentage, corresponding to 41.0 and 36.4%, respectively. This confirms the best environ-mental performance of these sectors, having a larger number of companies with strong environmental man-agement, since they have larger international insertion. These companies are subjected to higher pressure from foreign customers, implying in larger environmental investments. Regarding the sugar-alcohol sector, data are separated because it comprises the production of sugar and alcohol, and it is important to show separately the production and exports of each sector. Despite the
t n e m e g a n a
M Pulpandpaper Metallurgical Sugar/alcohol
. q e r
F % Freq. % Freq. %
g n o r t
S 7 87.5 5 55.6 4 36.4
e t a r e d o
M 1 12.5 4 44.4 7 63.6
k a e
W 0 0.0 0 0.0 0 0.0
Table 3 - Environmental management of the companies.
n o i t c n u F r e p a p d n a p l u
P Metallurgical Sugar/alcohol
e r o c S e g a r e v A l a t n e m n o r i v n E t n e m e g a n a M e r o c S e g a r e v A l a t n e m n o r i v n E t n e m e g a n a M e r o c S e g a r e v A l a t n e m n o r i v n E t n e m e g a n a M l a r e n e
G 11.00 Strong 10.00 Strong 9.64 Strong
s r i a f f A l a g e
L 4.38 Moderate 5.67 Strong 4.45 Moderate
e c n a n i
F 8.50 Strong 7.89 Strong 7.00 Moderate
s e c r u o s e R n a m u
H 2.88 Strong 2.22 Moderate 2.18 Moderate
d n a t c u d o r P s s e c o r
P 2.63 Strong 2.89 Strong 2.82 Strong
g n i s a h c r u
P 2.75 Strong 2.11 Moderate 1.64 Moderate
d n a n o i t c u d o r P e c n a n e t n i a
M 13.38 Strong 11.89 Strong 10.82 Moderate
g n i t e k r a
M 10.00 Strong 8.78 Moderate 7.36 Moderate
lower international insertion, the strong pressure on the cellulose and paper sector, as well as the environmental requirements of interested parties; operational control; environment audits; capital origin and location reflect in the adoption of a more restrictive environmental behavior (strong environmental behavior).
A larger or a smaller international insertion, confirmed by the exports, is not the single determi-nant of higher or lower environmental performance, but, also the demand of shareholders and consumers (Maimon, 1994). Particular attention must be drawn to the destination of exports, i.e., the main international consumer markets, which differ with regard to envi-ronmental demands. In the case of the pulp and paper sector, data from the Pulp and Paper Brazilian Asso-ciation (BRACELPA, 2004) showed that the main pulp and paper markets are Europe and the US, correspond-ing approximately to 60.8% of the exports. In the case of the metallurgical sector, the main consumer mar-ket for the Brazilian metallurgical products is Asia, ac-counting for 42.0% of the exports, according to data from the Brazilian Institute of Metallurgy (IBS, 2004). It is known that the European and American markets have more rigorous rules in relation to the compliance with environmental standards. In this case, the pulp and paper sector undergoes intense pressure to com-ply with international environmental standards, since its main consumer markets are Europe and the US, which are more environmentally demanding.
Capital origin and company performance -The companies within the pulp and paper sector show larger percentage of foreign controlling shares (46.7%) (Table 6). Thus, the highest environmental perfor-mance of these companies is determined by their main shareholder demands, which ends up influencing their environmental management and improving their rela-tionship with the environment. On the other hand, the lowest environmental performance of companies within the sugar and alcohol sector is due to a smaller percentage of companies with foreign majority share (5.7%). The results obtained from Table 2 agree with this analyzed indicator, confirming the highest environ-mental performance level of the cellulose and paper sec-tor and the lowest level of the sugar & alcohol secsec-tor.
By adding the two factors (international inser-tion and capital origin), it can be inferred that the higher environmental performance of pulp and paper and met-allurgical companies is determined by their larger in-sertion in the international market, through their ex-ports and shareholder demands. On the contrary, lower environmental performances of companies within the sugar and alcohol sector, which adopted in their ma-jority a moderate environmental behavior, is determined by a smaller international insertion resulted from smaller export volumes (37.9%, sugar and alcohol ex-port values) and the demands of their main sharehold-ers, almost all nationals (94.3%).
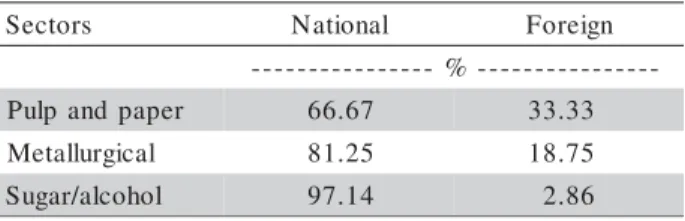
The companies within the pulp and paper sector show higher environmental performance, as they have the largest percentage of units operating in other coun-tries (33.3%) (Table 7). The lowest environmental per-formance of sugar and alcohol companies, however, is determined by the smallest number of companies operating in other countries (2.9%). The adoption of environmental protection occurs more easily in com-panies that have production units in several countries, as they have more access to technical, managerial and financial resources (Maimon, 1994). Decisions made at corporate level will comprise all the companies, and, therefore, influence their environmental performance.
s r o t c e
S Pulp andpaper Metallurgical Sugar/alcohol
r a g u
S Alcohol
-% -s t r o p x
E 36.41 41.92 33.03 4.94
Table 5 - Production and Export per Sector - Year 2003 (in percentage).
1Source: Associação Brasileira de Celulose e Papel - BRACELPA (2004); 2Source: Instituto Brasileiro de Siderúrgia - IBS (2004); 3Source: Departamento Intersindical de Estatística e Estudos Sócio-econômicos - DIEESE (2003); 4Source: União da Agroindústria
Canavieira de São Paulo - ÚNICA (2003)
s r o t c e
S National Foreign
-% -r e p a p d n a p l u
P 53.3 46.7
l a c i g r u l l a t e
M 68.7 31.2
l o h o c l a / r a g u
S 94.3 5.7
Table 6 - Origin of company capital.
Source: BRACELPA (2004), IBS (2004), DIEESE (2003)
s r o t c e
S National Foreign
-% -r e p a p d n a p l u
P 66.67 33.33
l a c i g r u l l a t e
M 81.25 18.75
l o h o c l a / r a g u
S 97.14 2.86
Table 7 - Company operation.
These statements can be contested, since some companies may not act in the same manner in all their units, considering, in particular, the market pressures. However, the companies have been adopting corpo-rate policies applied to all units, in order to protect their image (Maimon, 1994).
Company location - Table 8 shows data re-ferring to the population of cities where the produc-tion units of the sampled companies are located. In this case, the objective was to evaluate the action of the population around the plants and to examine the influ-ence of the communities on the environmental actions taken by the companies. Most production units of the sampled companies within the pulp and paper and met-allurgical sectors (70.8% and 66.7% respectively) are located in cities with population above 50 thousand in-habitants, whereas the sugar and alcohol production units (73.1%) are located in cities with population be-low 50,000 inhabitants. Consequently, most of the pulp and paper and metallurgical companies, which are lo-cated in cities with larger population, undergo more intense pressure from the society, explaining the higher environmental performance and leading to a strong en-vironmental management. Nevertheless, most of the sugar and alcohol companies located in cities of smaller population undergo less intense pressure from society, which explains their lower environmental performance, and consequently, the concentration of companies that adopt moderate environmental management.
CONCLUSIONS
The companies of the Cellulose and Paper sec-tor showed better environmental behaviour, which may prove a better environmental performance of these companies compared with the Metallurgical and Sugar & Alcohol sectors.
Companies of the Metallurgical and Sugar & Alcohol sectors have not been making efforts to im-prove their environmental management in relation to Purchase Management, Marketing Management and Human Resource Management.
Companies of the Cellulose and Paper and Sugar & Alcohol sectors have not been making efforts to improve their environmental management in relation to Juridical Management.
The increased international insertion, foreign capital origin, international performance and proxim-ity to densely populated cities contributed to a higher environmental performance of the Cellulose and Pa-per sector.
REFERENCES
ABREU, M.C.S. Modelo de avaliação da estratégia ambiental: uma ferramenta para a tomada de decisão. Florianópolis: Universidade Federal de Santa Catarina, 2001. 232p. Tese (Doutorado). ASSOCIAÇÃO BRASILEIRA DE CELULOSE E PAPEL
-BRACELPA. Relatório anual. São Paulo: BRACELPA, 2004. 20p.
COUTINHO, R.B.G.; SOARES, T.D.L.A.M. Gestão estratégica com responsabilidade social: arcabouço analítico para auxiliar sua implementação nas empresas no Brasil. Revista de Administração Contemporânea, v.6, p.75-96, 2002. DEPARTAMENTO IINTERSINDICAL DE ESTATISTICA E
ESTUDOS SÓCIOECONÔMICOS - DIEESE. Situação do setor sucroalcooleiro em 2003. São Paulo: DIEESE, 2003. 26p. INSTITUTO BRASILEIRO DE SIDERURGIA - IBS. Informações
estatísticas brasileiras. Available at: http://www.ibs.org.br/ infbras.htm. Accessed 09 Mar. 2004.
JACOVINE, L.A.G. Gestão da qualidade na colheita de madeira em povoamentos eqúiâneos. Viçosa: Universidade Federal de Viçosa, 2000. 136p. Tese (Doutorado).
LITTLE, A.D. Auditoria de meio ambiente, saúde ocupacional e segurança industrial: fundamentos, habilidades e técnicas. São Paulo: Arthur D. Little, 1997. 270p.
MAIMON, D. Eco-estratégia nas empresas brasileiras: realidade ou discurso? RAE – Revista de Administração de Empresas, v.34, p.119-130, 1994.
SANCHES, C.S. Gestão Ambiental Proativa. RAE – Revista de Administração de Empresas, v.40, p.76-87, 2000. SILVA, C.L.M.; BARBOSA, S.L. Estratégia, fatores de
competitividade e contexto de referência das organizações: uma análise arquetípica. Revista de Administração Contemporânea, v.6, p.7-32, 2002.
UNIÃO DA AGROINDÚSTRIA CANAVIEIRA DE SÃO PAULO -UNICA. Available at: http://www.portalunica.com.br. Accessed 09 Nov. 2003.
t n e m e g a n a
M Pulpandpaper Metallurgical Sugar/alcohol
. q e r
F % Freq. % Freq. %
n o i l l i m 1 e v o b
A 1 4.2 2 13.3 1 1.3
n o i l l i m 1 d n a d n a s u o h t 0 0 5 n e e w t e
B 0 0 0 0 1 1.3
d n a s u o h t 0 0 5 d n a d n a s u o h t 0 0 1 n e e w t e
B 9 37.5 3 20.0 8 10.3
d n a s u o h t 0 0 1 d n a d n a s u o h t 0 5 n e e w t e
B 7 29.2 5 33.3 11 14.1
d n a s u o h t 0 5 w o l e
B 7 29.2 5 33.3 57 73.1
Table 8 - Population of cities with production units of the sampled companies.
Source: BRACELPA (2004), IBS (2004), DIEESE (2003).