Ana Luísa Kremer Faller Eliane Fialho
Departamento de Nutrição Básica e Experimental. Instituto de Nutrição Josué de Castro. Universidade Federal do Rio de Janeiro. Rio de Janeiro, RJ, Brasil
Correspondence:
Eliane Fialho
Departamento de Nutrição Básica e Experimental
Instituto de Nutrição Josué de Castro Centro de Ciências da Saúde da UFRJ Caixa Postal 68041
Cidade Universitária, Ilha do Fundão 21941-590 Rio de Janeiro, RJ, Brasil E-mail: fi [email protected] Received: 7/26/2008 Approved: 9/5/2008
Polyphenol availability in fruits
and vegetables consumed in
Brazil
ABSTRACT
OBJECTIVE: To estimate total polyphenol availability in fruits and vegetables commonly consumed in Brazil and its regions, and to identify the main food sources that constitute food habits in this country.
METHODS: Total polyphenols were determined by the Folin-Ciocalteu method and the availability estimated according to the Pesquisa de Orçamentos Familiares 2002/ 2003 (2002/2003 Family Budget Survey). Twelve highly consumed food items were chosen, of which six were “tropical fruits” and six were vegetables under the categories of “leafy and fl ower vegetables”, “fruit vegetables” and “tuberous vegetables”. Polyphenol quantifi cation was performed with three independent experiments, each one in duplicate. The national polyphenol availability was estimated in grams per fresh weight of each analyzed food. Daily per capita availability in Brazil and its regions was calculated using the amount of polyphenol provided by the consumption of the 12 foods analyzed.
RESULTS: Polyphenol contents of foods varied from 15.35 to 214.84 mg GAE/ 100 g of fresh weight. Polyphenol availability in Brazil, based on the amount in kilograms that is annually acquired in Brazil, of the 12 selected foods was 48.3 mg/ day, and the Southeast and Central-West regions had the highest and lowest values, respectively. Banana was the main polyphenol source consumed in Brazil, even though this pattern varied among regions.
CONCLUSIONS: The estimated daily polyphenol availability in Brazil was similar to other countries. Differences observed among regions could be directly related to distinct cultural habits. Although there is no recommended daily availability of polyphenols, consumption of the recommended daily amount of fruits and vegetables can increase the availability of polyphenols 16 times, showing a clear relationship between the consumption of these food groups and the availability of benefi cial bioactive compounds.
DESCRIPTORS: Fruit. Vegetables. Food Consumption. Brazil. Polyphenols.
INTRODUCTION
The inverse relation between fruit and vegetable consumption and lower in-cidence of chronic non-communicable diseases (CNCDs), such as cancer and cardiovascular diseases, was already known approximately two thousand years ago, although the fi rst epidemiological studies date from the 1930s.21 This as-sociation is due mainly to the natural chemical composition of these foods.
acid, beta-carotene and folic acid. Moreover, they are sources of bioactive compounds directly associated with disease prevention. Polyphenols comprise the biggest group among bioactive compounds. They are largely distributed over the vegetable kingdom, and are subdivided into classes according to the chemical structure of each substance.1
The main groups of polyphenols are: phenolic acids, like chlorogenic acid, which is present in coffee; stil-benes, such as resveratrol, found in grapes and wine; cumarins, like furocoumarin, found in celery; lignins, present in linseed; and fl avonoids. The latter is the largest and most studied group, of which more than 5,000 compounds have been identifi ed and whose main food sources include fruits and vegetables, teas, cocoa and soya, among others.17 Nevertheless, some specifi c compounds are in higher concentrations in certain foods, such as quercetin in onions, myricetin in broccoli, anthocyanins in purplish-red fruits, like cherries, strawberries, and grapes, and fl avanones in citric fruits, like oranges and tangerines.14 Polyphe-nols’ physiological actions have been related to the prevention of cardiovascular and neurodegenerative diseases, cancer, among others, mainly due to their high antioxidant capacity.18
Changes in food pattern, associated with a greater offer of low-cost processed foods, have favored an increase in the consumption of high-energy density and low-nutrient density foods.12 The lack of nutritional education at school prevents the early acquisition of knowledge concerning the benefi ts of consuming fruits and vegetables, contributing to the population’s low request for these food groups. This shows the impor-tance of developing nutritional orientation with public dimension aiming at healthy eating habits.10
The evaluation and determination of total polyphenols in fruits and vegetables produced and consumed in Brazil is essential to appraise the level of importance of food items as sources of bioactive compounds and estimate the national consumption. The quantifi cation of polyphenol levels in these foods brings scientifi c knowledge of their nutritional composition and their benefi ts in preventing diseases, in addition to reinforc-ing the importance of consumreinforc-ing at least 400g of fruit and vegetables daily. Also, it subsidizes the WHO (“5-a day”)22 and the Brazilian Ministry of Health (“Brasil
Saudável”a – Healthy Brazil) programs.
Thus, the objective of the present study was to estimate daily polyphenol availability in Brazil and its regions, identifying the main food sources that are present in the food habits of this country.
a Ministério da Saúde - MS, Projeto Brasil Saudável.
b Instituto Brasileiro de Geografi a e Estatística. Pesquisa de Orçamentos Familiares 2002-2003. Tabela de aquisição alimentar domiciliar per
capita anual [internet] [cited 2008 Oct 10]. Available from: http://www.ibge.gov.br/home/estatistica/populacao/condicaodevida/pof/2002/ tab312.pdf.
METHODS
Experimental study in which 12 food items were select-ed: six fruits and six vegetables commonly consumed in Brazil according to Tabela de Aquisição Domiciliar de Alimentos (Table of Household Acquisition of Foods), extracted from a survey (Pesquisa de Orçamentos Familiares 2002/ 2003 - 2002/2003 Family Budget Survey)b conducted in Brazil by Instituto Brasileiro de
Geografi a e Estatística (IBGE - Brazilian Institute for Geography and Statistics). The selected fruits, classifi ed as “tropical fruits” in the table, were: pineapple (Ananas comosus), apple banana (Musa acuminata), sweet orange (Citrus sinensis), papaya (Carica papaya), mango (Mangifera indica) and mandarin orange (Citrus reticulata). Concerning the six selected vegetables, two were classifi ed as “leafy and fl oral vegetables”: broccoli (Brassica oleracea var. Italica) and white cabbage (Brassica oleracea var. Capitata); two as “fruit vegetables”: potato (Solanum tuberosum L.) and tomato (Lycopersicon esculentum var. Carmem); and two as “tuberous vegetables”: garden onion (Allium cepa) and wild carrot (Daucus carota).
The experiments were conducted in duplicate in three distinct moments during August and September of 2006. The food items were acquired in retail markets from the city of Rio de Janeiro (RJ).Approximately 1.0 kg of each vegetable or at least three units of the food items with great volume (pineapple, mango, broccoli, cabbage) were acquired for each analysis moment. Fruits and vegetables cultivars were chosen according to their availability in the markets of Rio de Janeiro, as this was not specifi ed in the IBGE survey. The food items were washed in running water and dried with paper towels. Foods were manually peeled (bananas and mandarin oranges), peeled with a knife (the other fruits and tomatoes) or with a domestic vegetable peeler (potatoes and carrots). The part analyzed in these foods was the pulp. The broccolis were manu-ally divided into leaves, fl ower buds and stalk, and the three parts were used for analysis in similar portions. The external part of the white cabbage (the three most external leaves) was discarded and the internal fraction (the rest of the vegetable) was analyzed, simulating the domestic preparation process that is normally applied. Damaged or bruised foods were discarded. After prepared, the food items were processed using a juice extractor model Samsom GB-9001 (Greenbison Inc, USA), resulting in a fl uid extract which was im-mediately used for analysis.
-a Ministério da Saúde. Secretaria de Atenção à Saúde. Coordenação-Geral da Política de Alimentação e Nutrição Guia alimentar para a população brasileira: promovendo a alimentação saudável. Brasília; 2005. (Série A. Normas e manuais técnicos)
cations. Samples of 100 μL of freshly extracted juice were put in Eppendorf tubes with corks and, subse-quently, 500 μL of the extraction solution, constituted of 1.2 M hydrochloric acid in 50% methanol/ distilled water, were added. The Eppendorf tubes were heated in a double boiler at 90ºC for three hours. Subsequently, they were removed from the boiler and left to cool at room temperature, having the volume completed to 1 mL with pure methanol. After that, samples were centrifuged at 500 rpm for fi ve minutes; the superna-tant was removed using an automatic pipette and was denominated polyphenol extracts. The extractions were performed in duplicate.
The determination of polyphenols was performed us-ing the Folin-Ciocalteu reagent accordus-ing to Karou et al11 (2005). The Folin solution was prepared using the Folin-Ciocalteu (Merck) reagent and deionized water 1:1 (v/v). The polyphenol extract, 30μL, was put in an Eppendorf tube, and 75 μL of Folin solution, prepared as above, were added. After fi ve minutes of chemi-cal reaction, 75 μL of sodium carbonate (20%) were added and the volume was completed to 600 μL with deionized water. The solution reacted for 30 minutes. Subsequently, the measurement was verifi ed with a spectrophotometer (Beckman 6300) at 750 nm using Gallic acid as standard. The results were expressed in Gallic acid equivalent (GAE) mg by 100 g of fresh food. The determination of polyphenols was performed in three independent experiments, each one in duplicate.
The national availability of polyphenols was estimated using the values in grams of each vegetable, weighed when fresh. The daily per capita value in Brazil and its regions was calculated by adding the daily amount of polyphenols supplied by each food, according to the following equation:
Daily amount from food = (polyphenol contents per gram x annual acquisition)/365 days
Each vegetable’s representativeness in the daily amount of total polyphenols was calculated with the proportion of phenolic compounds present in each food in one day, divided by the total daily availability. The result was expressed in percentage, as the following formula:
% = [daily amount of total polyphenols (in each veg-etable) x 100]/daily consumption of total polyphenols
A consumption suggestion was developed, including the recommendation of fruit and vegetables (fi ve to nine portions a day) and the analyzed foods, based on the food portion recommendation described in the Guia Alimentar para a População Brasileira (Food Guide for the Brazilian Population)a published by the Ministry
of Health in 2005. The total caloric value (TCV) of the proposed menu was approximately 2000 kcal; thus, the main public is the healthy adult population. The food groups were distributed according to the Ministry of Health’s proposition.
The food preparations selected for developing the menu had their composition and caloric values listed by Franco & Chaloub7 (1992). They were: lettuce salad, cooked carrots, fruit salad, cabbage salad, “pirão” (a meal made of manioc fl our boiled in water) and cooked broccoli.
The mean value, standard deviation and Pearson cor-relation were calculated using an electronic panel applicative.
RESULTS
The mean contents of total polyphenols in fruits and vegetables are described in Table 1. For the analyzed fruits, polyphenol content varied from 15.3 to 215.7 mg GAE/ 100 g of fresh weight (papaya and banana, re-spectively). For the vegetables, the mean values varied from 13.7mg GAE/ 100g of fresh weight in tomatoes to 113.2 mg GAE/ 100g of fresh weight in onions.
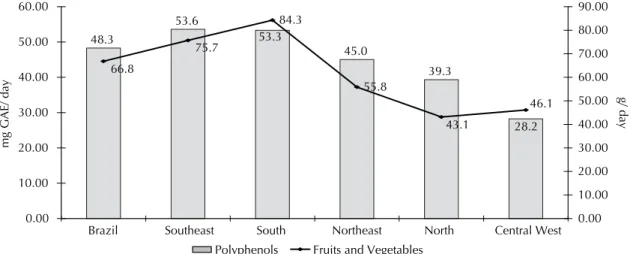
The Figure shows the daily polyphenol consumption per capita in relation to the daily consumed volume of the studied fruits and vegetables. The mean availability of offered polyphenols was 48.3mg/ day in Brazil, and the highest values were found in the South region (53.6 mg), followed by the Southeast (53.3 mg), the Northeast (45.0 mg), the North (39.3 mg) and the Central-West regions (28.2 mg). The higher daily consumption of fruit and vegetables was positively related to a higher supply of these compounds, presenting a 0.87 Pearson correlation coeffi cient.
Among the food items in the present study, the banana stood out due to the polyphenol contents supplied daily, which represent 33.6% of total polyphenols supplied by these foods in Brazil. In second and third positions were onions (22.3%) and potatoes (9.4%) (Table 2). Poly-phenols’ main food source in the South and Central-West regions was the onion. In the South region, the potato and the mandarin orange were eminent sources of polyphenols, with percentages similar to that of the banana. The broccoli had a reduced participation as source of polyphenols in all regions.
DISCUSSION
The content of polyphenols in foods is infl uenced and varies according to different factors, such as: the planta-tions’ geographic area, variations in sunlight exposure, methods of cultivation and the fertilizers used, analyzed cultivation, among others. This can explain differences observed for papaya, potatoes, broccoli and tomatoes, in relation to other research studies. All the other studies, except for that of Mélo et al15 (2006), were not carried out in Brazil; thus, they probably presented differences concerning climatic conditions, sun incidence and cul-tivation. Nevertheless, although Mélo et al15 conducted their study in Brazil, the food items were acquired in Recife (Northeast region), which already represents differences in values when compared to the present study, carried out in the Southeast region.
The higher daily per capita availability of polyphenols presented by the Southeast and South regions may be related to the populations’ higher purchasing power in these regions, which allows a greater acquisition and consumption of fruits and vegetables.9 The cost of fruits and vegetables and family income are directly associ-ated with the reduced participation of these foods in the Brazilian diet.6 However, the position of the Northeast, in third place, might indicate that the economic factor alone cannot explain the obtained results. The higher ac-cess to establishments that supply fruits and vegetables in this region could have contributed to this result. Easy access is positively associated with the increase in the consumption of these food groups.16 Furthermore, other studies show that the size of the fruit and vegetable section in supermarkets, as well as the diversity of
of-Figure. National per capita polyphenol and fruits and vegetables availability in Brazil and its macroregions, 2006.
48.3
53.6
45.0
39.3
28.2 53.3
84.3
55.8
46.1
43.1 66.8
75.7
0.00 10.00 20.00 30.00 40.00 50.00 60.00
Brazil Southeast South Northeast North Central West
mg GAE/ day
0.00 10.00 20.00 30.00 40.00 50.00 60.00 70.00 80.00 90.00
g/ day
Polyphenols Fruits and Vegetables
Source: Instituto Brasileiro de Geografi a e Estatística (Brazilian Institute for Geography and Statistics). Pesquisa de Orçamentos Familiares 2002-2003 (2002/2003 Family Budget Survey). Tabela de aquisição alimentar domiciliar per capita
anual (Annual per capita household food acquisition table) [internet] [cited 2008 Oct 10]. Available from: http://www.ibge. gov.br/home/estatistica/populacao/condicaodevida/pof/2002/tab312.pdf.
Table 1. Comparison between total polyphenol values in fruits and vegetables from Brazil and from literature data.
Food Mean (SD)a Mélo et al,15 Brazil Brat et al,4 France Ciéslik et al,5 Poland Wu et al,23 United States
Pineapple 85.1 (5.8) 66.3 47.2 - 174.0
Banana 215.7 (3.5) - 51.5 - 231.0
Orange 114.6 (1.3) 92.4 31.0 217.0
-Papaya 15.3 (0.3) 75.4 - - 337.0
Mango 110.5 (9.6) 72.3 - - 266.0
Mandarin orange 134.1 (6.5) - - - 192.0
Potato 31.5 (2.1) 43.2 23.1 - 163.0
Broccoli 68.0 (9.4) - 98.9 290.0 337.0
Onion 113.2 (3.8) 82.2 76.1 - 91.0
Carrot 45.1 (4.7) 12.9 10.1 - 125.0
White cabbage 66.9 (17.0) 47.3 - 108.0 203.0
Tomato 13.7 (1.2) 30.8 13.7 62.0
fered products, contribute to the higher acquisition of vegetal products.3
The variation in polyphenols’ availability among re-gions, especially in the Central-West and North rere-gions, may be due to the selected food items in the present study. Whilst contemplating foods of larger national consumption, regional food habits and consumption of typical foods were disregarded.8 The presence of regional food items is more evident when it comes to fruit, due to the biodiversity in these regions. For example: the açaí berry (Euterpe oleracea), cupuaçu
(Theobroma grandifl orum) and taperebá (Spondias mombin) in the North, and pequi (Caryocar brasil-iense)and gabiroba (Myrtaceae)in the Central-West. Brazilian native tropical fruits have signifi cant contents of phenolic compounds. Lima et al13 (2002) observed that red pitanga berries (Eugenia unifl ora) contain ap-proximately 257 mg of catechin in every 100 g of fresh fruit, a value that is similar to other red fruits, such as blueberry and mulberry (270 and 174 mg GAE/ 100g of fresh fruit, respectively), which are mild climate fruits, recognized as sources of polyphenols.19 The açaí berry presents a high proportion of anthocyanin, a sub-group of polyphenols, with 267 mg/ 100g of fresh fruit.2 Thus, the availability of polyphenols in the North and Central-West regions may have been underestimated in this study, for the typical foods and native fruits of these regions were not evaluated. Nevertheless, considering only these twelve food items, the estimated consump-tion for Brazil is equivalent, in some cases superior, to that of other countries such as Spain (18-31mg/ d), Denmark (23-46 mg/ d), Japan (25-40 mg/ d) and the United States (20-34 mg/ d).4
The different regions’ infl uence on eating habits is also shown by the amount of polyphenols offered daily by each fruit or vegetable. Only in the South and Central-West regions, the banana was not found to be a main food source of polyphenols (Table 2). In the South region, the potato supplies 16.7% of the daily polyphe-nols, the highest percentage observed for this food item among the regions. The North and Northeast regions presented high consumption of other tubercles such as manioc, cará (Dioscorea alata) and sweet potato (Ipomoea batatas), which implies a low consumption of potatoes, around 5% of daily polyphenols. The banana presents a high proportion of total polyphenols in 100 g, and has an annual per capita acquisition of 2.7 kg.9 On the other hand, the potato presents only one tenth of the polyphenol content found in the banana; however, its great consumption in the South region (10.3 kg/ per capita/per year)9 makes it a signifi cant food item when it comes to polyphenol supply. Vinson et al20 (2001) showed a similar profi le in the North American popula-tion: even though onions contained a higher polyphenol concentration when raw, the great consumption of potatoes in the United States made them the main food source of the population.
As previously described, different external factors (exposure to sunlight, cultivation and soil composition, for example) are capable of infl uencing the contents of polyphenols in foods, thus it is essential to analyze items produced and consumed nationally. Furthermore, many of the foods recognized as polyphenol sources do not correspond to those commonly consumed in Brazil, which is the case of red fruits, soya bean and drinks such as green tea.4 The quantifi cation of polyphenols in food
Table 2. Quantity of total polyphenols supplied by each food item in relation to daily per capita amount and regions. Brazil,
2006.
Food item Daily amount of total polyphenols per food item (%)
Brazil North Northeast Southeast South Central West
Pineapple 4.1 2.6 5.6 3.9 2.3 6.1
Banana 33.6 54.1 44.2 32.0 16.2 21.8
Potato 9.4 5.2 5.2 9.8 16.7 9.2
Broccoli 0.4 0.0 0.0 0.7 0.5 0.1
Onion 22.3 21.9 23.4 20.1 25.5 28.2
Carrot 4.5 2.8 4.1 4.8 4.1 7.3
Orange 2.0 1.4 1.1 2.6 2.0 0.8
Papaya 1.6 1.1 1.3 1.9 1.4 1.6
Mango 5.6 3.1 7.2 5.5 4.7 3.5
Cabbage 3.8 2.7 2.0 3.4 7.3 6.8
Tomato 3.9 3.1 4.1 3.9 3.4 6.1
Mandarin orange 8.9 1.8 1.8 11.4 15.9 8.4
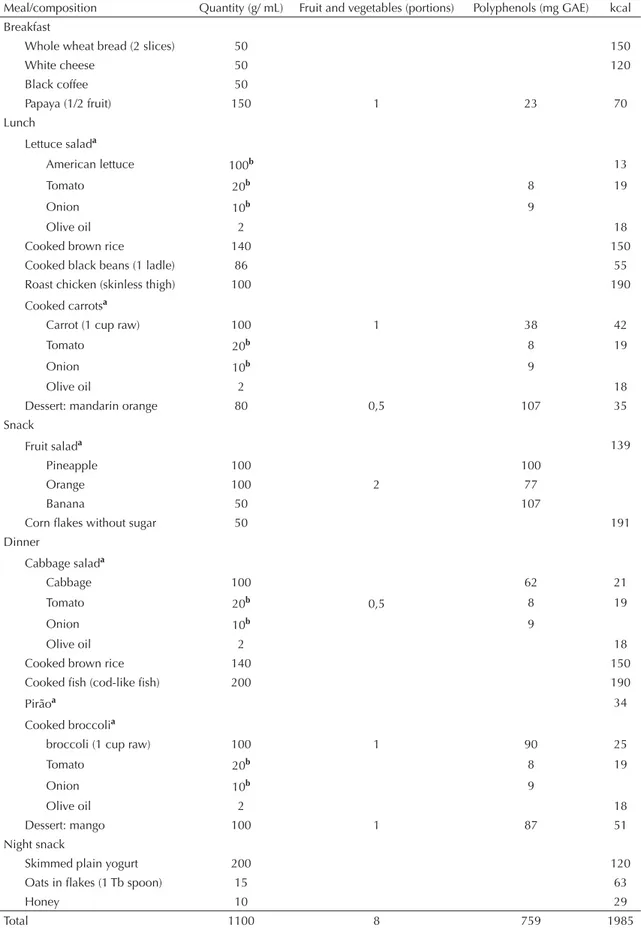
Table 3. Menu suggestion for healthy adults (2000 kcal).
Meal/composition Quantity (g/ mL) Fruit and vegetables (portions) Polyphenols (mg GAE) kcal Breakfast
Whole wheat bread (2 slices) 50 150
White cheese 50 120
Black coffee 50
Papaya (1/2 fruit) 150 1 23 70
Lunch
Lettuce salada
American lettuce 100b 13
Tomato 20b 8 19
Onion 10b 9
Olive oil 2 18
Cooked brown rice 140 150
Cooked black beans (1 ladle) 86 55
Roast chicken (skinless thigh) 100 190
Cooked carrotsa
Carrot (1 cup raw) 100 1 38 42
Tomato 20b 8 19
Onion 10b 9
Olive oil 2 18
Dessert: mandarin orange 80 0,5 107 35
Snack
Fruit salada 139
Pineapple 100
2
100
Orange 100 77
Banana 50 107
Corn fl akes without sugar 50 191
Dinner
Cabbage salada
Cabbage 100
0,5
62 21
Tomato 20b 8 19
Onion 10b 9
Olive oil 2 18
Cooked brown rice 140 150
Cooked fi sh (cod-like fi sh) 200 190
Pirãoa 34
Cooked broccolia
broccoli (1 cup raw) 100 1 90 25
Tomato 20b 8 19
Onion 10b 9
Olive oil 2 18
Dessert: mango 100 1 87 51
Night snack
Skimmed plain yogurt 200 120
Oats in fl akes (1 Tb spoon) 15 63
Honey 10 29
Total 1100 8 759 1985
a According to the Guia Alimentar para a População Brasileira (Food Guide for the Brazilian Population) published by the
items consumed in Brazil can lead to the identifi cation of new food sources, and it also allows a better estimate of the availability of polyphenols in the country.
The consumption of only 66.8 g/ day of fruit and veg-etables, derived from the twelve food items studied here, is much inferior to that recommended by the Food and Agriculture Organization (FAO), 400 g a day. However, the increase in the consumption of fruit and vegetables can lead to a higher supply of polyphenols. In the hypo-thetic menu, based on the Guia Alimentar para a Popula-ção Brasileira (Food Guide for the Brazilian Population) (Table 3), the daily availability of polyphenols reaches 759 mg, equivalent to an increase of almost 16 times the amount estimated in this study. Even so, this value is underestimated, considering that other food items of the Brazilian diet, such as rice and beans, coffee, and lettuce, were not investigated in the present study.
1. Arts ICW, Hollman PCH. Polyphenols and disease risk in epidemiologic studies. Am J Clin Nutr. 2005;81(Supl 1):S317-25.
2. Bobbio FO, Druzian JI, Abrão PA, Bobbio PA, Fadelli S. Identifi cação e quantifi cação das antocianinas do fruto do açaizeiro (Euterpe oleracea) Mart. Cienc Tecnol Aliment.2000;20(3):388-90. DOI: 10.1590/S0101-20612000000300018
3. Bodor JN, Rose D, Farley TA, Swalm C, Scott SK. Neighbourhood fruit and vegetable availability and consumption: the role of small food stores in an urban environment. Public Health Nutr. 2008;11(4);413-20. DOI: 10.1017/S1368980007000493
4. Brat P, Georgé S, Bellamy A, Du Chaffaut L, Scalbert A, Mennen L, et al. Daily polyphenol intake in France from fruit and vegetables. J Nutr. 2006;136(9):2368-73.
5. Ciéslik E, Greda A, Adamus W. Contents of
polyphenols in fruit and vegetables. Food Chem. 2006; 94(1):135-42. DOI: 10.1016/j.foodchem.2004.11.015
6. Claro RM, Carmo HCE, Machado FMS, Monteiro CA. Renda, preço dos alimentos e participação de frutas e hortaliças na dieta. Rev Saude Publica. 2007;41(4):557-64. DOI: 10.1590/S0034-89102007000400009
7. Franco G, Chaloub SR. Dietas e receitas: valores calóricos e propriedades gerais dos alimentos. 3. ed. Rio de Janeiro: Atheneu; 1992.
8. Galeazzi MM, Marchesich R, Siano R. Nutrition country profi le of Brazil. Rome: FAO; 2002.
9. Jaime PC, Monteiro CA. Fruit and vegetable intake by Brazilian adults, 2003. Cad Saude Publica. 2005;21(Supl 1):S19-24.
10. Jaime PC, Machado FMS, Westphal MF, Monteiro CA. Educação nutricional e consumo de frutas e hortaliças: ensaio comunitário controlado. Rev Saude Publica. 2007;41(1):154-7. DOI: 10.1590/S0034-89102006005000014
11. Karou D, Dicko MH, Simpore J, Traore AS. Antioxidant and antibacterial activities of polyphenols from ethnomedicinal plants of Burkina Faso. Afr J Biotechnol. 2005;4(8):823-8.
12. Levy-Costa RB, Sichieri R, Pontes NS, Monteiro CA. Disponibilidade domiciliar de alimentos no Brasil:
distribuição e evolução (1974-2003). Rev Saude Publica. 2005;39(4):530-40. DOI: 10.1590/S0034-89102005000400003
13. Lima VL, Mélo EA, Lima DES. Fenólicos e carotenóides totais em pitanga. Sci Agric. 2002;59(3):447-50. DOI: 10.1590/S0103-90162002000300006
14. Manach C, Scalbert A, Morand C, Rémésy C, Jiménez L. Polyphenols: food sources and bioavailability. Am J Clin Nutr. 2004;79(5):727-47.
15. Mélo EA, Lima VLAG, Maciel MIS. Polyphenol, ascorbic acid and total carotenoid contents in common fruits and vegetables. Braz J Food Technol. 2006;9(2):89-94.
16. Morland K, Wing S, Diez Roux A. The contextual effect of the local food enviorenmnt on residents’ diets: the atherosclerosis risk in communities study. Am J Public Health. 2002;92(11):1761-7. DOI: 10.2105/ AJPH.92.11.1761
17. Ross JA, Kasum CM. Dietary fl avonoids:
bioavailability, metabolic effects, and safety. Annu Rev Nutr. 2002;22:19-34. DOI :10.1146/annurev. nutr.22.111401.144957
18. Scalbert A, Johnson IT, Saltmarsh M. Polyphenols: antioxidants and beyond. Am J Clin Nutr. 2005;81(1 Supl.):S215-7.
19. Sellappan S, Akok C, Krewer G. Phenolic compounds and antioxidant capacity of Georgia-grown
blueberries and blackberries. J Agric Food Chem. 2002;50(8):2432-8. DOI: 10.1021/jf011097r
20. Vinson JA, Su X, Zubik L, Bose P. Phenol antioxidant quantity and quality in foods: fruits. J Agric Food Chem.2001;49(11):5315-21. DOI: 10.1021/jf0009293
21. Williamson, G. Protective effects of fruits and vegetables in the diet. Nutr Food Sci. 1996;96(1):6-10. DOI: 10.1108/00346659610105806
22. World Health Organization. Diet, nutrition and the prevention of chronic diseases. Report of a Joint WHO/ FAO Expert Consultation. Geneva; 2003. (WHO Technical Report Series, 916).
23. Wu X, Beecher GR, Holden JM, Haytowitz DB, Gebhardt SE, Prior RL. Lipophilic and hydrophilic antioxidant capacities of common foods in the United States. J Agric Food Chem. 2004;52(12):4026-37. DOI: 10.1021/jf049696w
REFERENCES