Luciana Correia AlvesI Iúri da Costa LeiteII Carla Jorge MachadoIII
I Centro de Saúde Escola Germano Sinval Faria. Escola Nacional de Saúde Pública Sergio Arouca (ENSP). Fundação Oswaldo Cruz (Fiocruz). Rio de Janeiro,
RJ, Brasil
II Departamento de Epidemiologia e Métodos Quantitativos em Saúde. ENSP. Fiocruz. Rio de Janeiro, RJ, Brasil
III Centro de Desenvolvimento e Planejamento Regional. Faculdade de Ciências
Econômicas. Universidade Federal de Minas Gerais. Belo Horizonte, MG, Brasil Correspondence:
Luciana Correia Alves
Sala da Coordenação de Ensino e Pesquisa CSEGSF
R. Leopoldo Bulhões, 1480 – Manguinhos 21041-210 Rio de Janeiro, RJ, Brasil E-mail: [email protected] ocruz.br Received: 2/4/2009
Approved: 12/4/2009
Article available from www.scielo.br/rsp
Factors associated with
functional disability of elderly
in Brazil: a multilevel analysis
ABSTRACT
OBJECTIVE: To analyze the infl uence of demographic, socioeconomic, health, and contextual factors of the Brazilian federation units on the functional disability of the elderly.
METHODS: Cross-sectional study based on data from the 2003 PNAD (Brazilian National Household Survey), of IBGE (Brazilian Institute of Geography and Statistics) and Ipea (Institute of Applied Economic Research). The sample was composed of 33,515 individuals aged 60 years and older. The
dependent variable was functional disability, measured by diffi culty in climbing
slopes or stairs. The independent variables were divided into two levels: individual (demographic, socioeconomic and health-related characteristics) and contextual (Gini Index and Gross Domestic Product per capita by Brazilian state in 2000). A multinomial and multilevel logistic regression model was utilized in order to estimate the effect of the independent variables on the functional disability of the elderly.
RESULTS: Functional disability was associated with demographic, socioeconomic and health factors. At the individual level, sex, level of schooling, income, occupation, self-perception of health and chronic diseases were the factors that were most strongly related to functional disability. At the
contextual level, income inequality proved to exert an important infl uence.
CONCLUSIONS: Self-perception of health is the factor that is most strongly related to the functional disability of the elderly in Brazil, followed by chronic diseases. Sex, occupation, level of schooling and income are also highly associated with it. Actions that approach the main factors associated with
functional disability can contribute signifi cantly to the well-being and quality
of life of the elderly.
DESCRIPTORS: Aged. Frail Elderly. Functional Capacity.
Socioeconomic Factors. Multilevel Analysis. Cross-Sectional Studies. Health of the Elderly. Quality of Life.
INTRODUCTION
Brazil has been undergoing a quick and sharp process of aging and extension of the population’s longevity. With the acceleration of this process, there is an increase in the prevalence of chronic-degenerative diseases and of functional disability.1
Functional disability can be defi ned by the individual’s diffi culty or need of
help concerning the execution of basic or more complex daily tasks that are necessary for an independent life in the community, like, for example,
functional consequences have implications that are more visible and perceptible to the elderly, since func-tional loss causes greater vulnerability and dependence in old age.12
The functional disability of the elderly can be deter-mined by activities of daily living (ADL), by instru-mental activities of daily living (IADL) and by physical mobility.2
Individual factors have been viewed as responsible for the functional disability process. Previous studies have shown that functional decline is related to
demographic, socioeconomic and health factors.1,4,5,6
However, few studies in Brazil focus on the relation-ship of the determinants of functional disability among the elderly.8,19,24
At the contextual level, socioeconomic conditions can explain regional variations and the great diversity of the levels of health and functional disability among the elderly. Income inequality can cause contextual or extra-individual effects on the social environment that affect health. To Porell & Miltiades21 (2002), the impact of
adverse socioeconomic conditions on individuals’ health is higher in regions with highly unequal income
distribu-tion. According to Kaplan et al13 (1996), high income
inequality measured in the national, state or community level is associated with worse population’s health.
Brazil is among the countries with the highest degrees of social inequality. A study using data from Pesquisa Nacional por Amostra de Domicílios (PNAD - Brazilian National Household Survey) indicated that the functional
capacity of the elderly is strongly infl uenced by the
socioeconomic situation.15 It is likely that individuals
living in areas with better socioeconomic conditions have greater access to medical goods and services and, consequently, are capable of maintaining good
health conditions and functional capacity over time.21
Nevertheless, there are no studies in Brazil that investi-gate the relations between socioeconomic inequalities at the level of federation units (states and the Federal District), important geographic spaces for application of public policies, and functional disability of the elderly.
The aim of the present study was to analyze the infl
u-ence of demographic, socioeconomic, health and contextual factors of the federation units on the func-tional disability of the elderly.
METHODS
Cross-sectional study based on data from PNAD-2003, from Instituto Brasileiro de Geografia e Estatística (IBGE – Brazilian Institute of Geography
a Instituto Brasileiro de Geografi a e Estatística. Pesquisa Nacional por Amostras de Domicílio 2003 – Available in CD-ROM. b Instituto de Pesquisa Econômica Aplicada. [internet] [cited 2008 Apr 21] Available from: http://www.ipeadata.gov.br/ipeaweb.dll/ ipeadata?65370046
and Statistics)b and Instituto de Pesquisa Econômica
Aplicada (IPEA – Institute of Applied Economic
Research).b In 1998, PNAD included in its
question-naire a health supplement whose information should
be collected every fi ve years, and 2003 was the most
recent available information.
The present study included individuals aged 60 years or older, whose data were obtained by PNAD by means of home interviews. Overall, 1,527 elderly people who did not answer the questions regarding the study’s variables were excluded. The studied sample was composed of 33,515 elderly individuals.
The dependent variable was functional disability. To measure it, the physical mobility variable “ability to climb slopes or stairs” was used, considered a robust indicator of future functional decline among the elderly.12
In addition, the choice of the physical mobility indicator to the detriment of the ADL derives from its capacity to detect an early stage of functional losses, enabling the discrimination of disability in the community.17 The
interviewee answered the following question: “Do you
usually have diffi culty in climbing slopes or stairs?”
Four categories were used in the functional disability classifi cation: does not have diffi culty, has low level of diffi culty, has high level of diffi culty and cannot do it. The independent variables were subdivided into two levels: individual and contextual. At the individual level, the variables were classifi ed into three blocks: demographic, socioeconomic, and health. The demo-graphic variables were: age (considered as continuous because capacity loss has a direct relationship to aging), sex, family arrangement (lives alone and lives with someone), race/color (white, black and mixed ethnicity) and household situation (urban and rural). In PNAD, individuals classify themselves in terms of race/color as: white, black, yellow, mixed ethnicity and indigenous. Indigenous individuals, yellow ones and those who did not declare their race/color were excluded because the relative frequency was below 1%. The socioeconomic variables were: level of schooling, (no schooling, 1-4, 5-8, 9-11 and 12 years of schooling or more), monthly family income (lower
than one minimum salary, one to three, three to fi ve,
fi ve to ten and ten or more) and occupation (occupied
(dichotomized into yes and no), hospitalizations in the last 12 months (yes and no) and affi liation to a private health plan (yes and no).
The independent contextual variables that were included
were: Gini Indexb and Gross Domestic Product (GDP)c
per capita by federation unit (FU) in 2000.
According to Pinheiro & Torres20 (2006), individuals
living in the same FU are more similar concerning health problems when compared to those living in another FU, because they are submitted to the same context (socioeconomic conditions, cultural factors, among others). Thus, inside the FU, observations would not be independent and there would be violation of the presuppositions of the traditional regression models. In light of the fact that the data structure is hierarchical and the response variable has four categories, to estimate the association between functional disability and the demographic, socioeconomic and health variables, the multilevel multinomial logistic regression model
was employed, with the fi rst level represented by the
individuals, and the second, by the FU.9
Initially, a univariate multinomial logistic regression analysis was carried out with the variables of the individual level. The statistically signifi cant variables (p<0.25) in the univariate regression analysis were selected for multivariate analysis. In the multivariate analysis, the variables of the individual level were included fi rst, followed by the variables of the contex-tual level with the fi xed coeffi cients. The evaluation of the effect of the contextual variables on functional disability was carried out through the analysis of the statistical signifi cance (p≤0.05) of its coeffi cient and through the reduction in the random effect variance, in comparison with the model that has only the indi-viduals’ characteristics.
The results of the fi nal model (individual and contextual variables) were interpreted in probabilities, calculated for each statistically signifi cant variable (p≤0.05), and
the other variables were centered on the mean.23 The
software MLwiN was used for data analysis.22
RESULTS
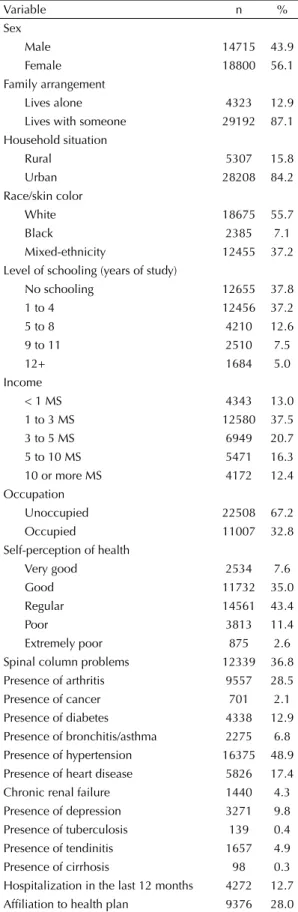
The elderly individuals’ age varied from 60 to 106 years (Table 1), and the mean and median ages were 69.8 and 68 years, respectively (SD = 7.7). The popula-tion was predominantly female (56.1%) and 87.1% of the elderly lived with someone; 84.2% lived in urban areas; 55.7% referred to their color as white; 37.8% did not have any schooling; 37.5% earned from one to three minimum salaries; 32.8% were occupied. As for health aspects, 35% perceived their health as
good; 12.7% reported hospitalization in the last 12 months and 28% had a private health plan. Arterial hypertension was the most frequent chronic disease (48.9%), followed by spinal column problems (36.8%), arthritis/rheumatism (28.5%), heart disease (17.4%) and diabetes (12.9%) (Table 1).
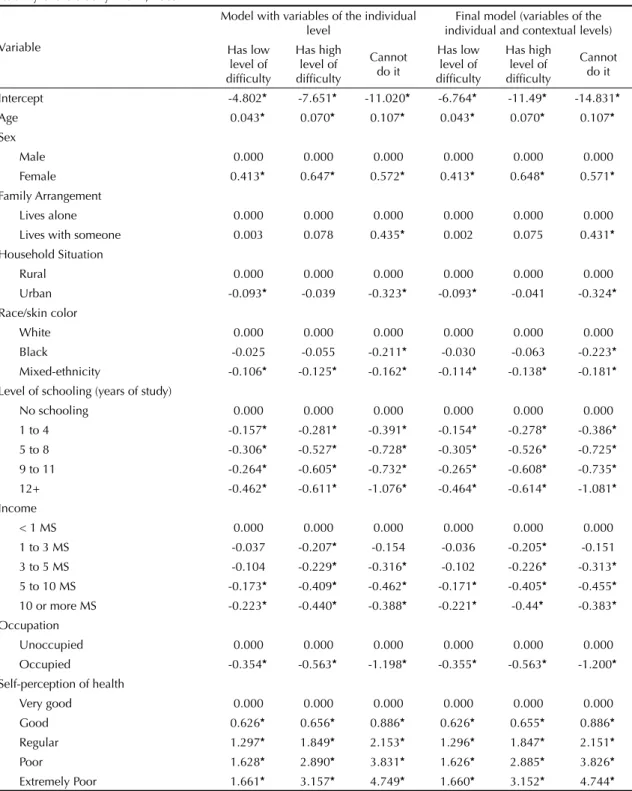
The estimates of the coefficients of the fixed and random effects of the models with the variables of the
individual level and fi nal model are in Table 2. The
model with the individual level variables showed that part of the variability in the probability of the elderly individual to have low level of diffi culty, high level of diffi culty and not being able to climb slopes or stairs was explained by the level of the FU (2
j=0.054; 0.091;
0.150; p<0.05; respectively).
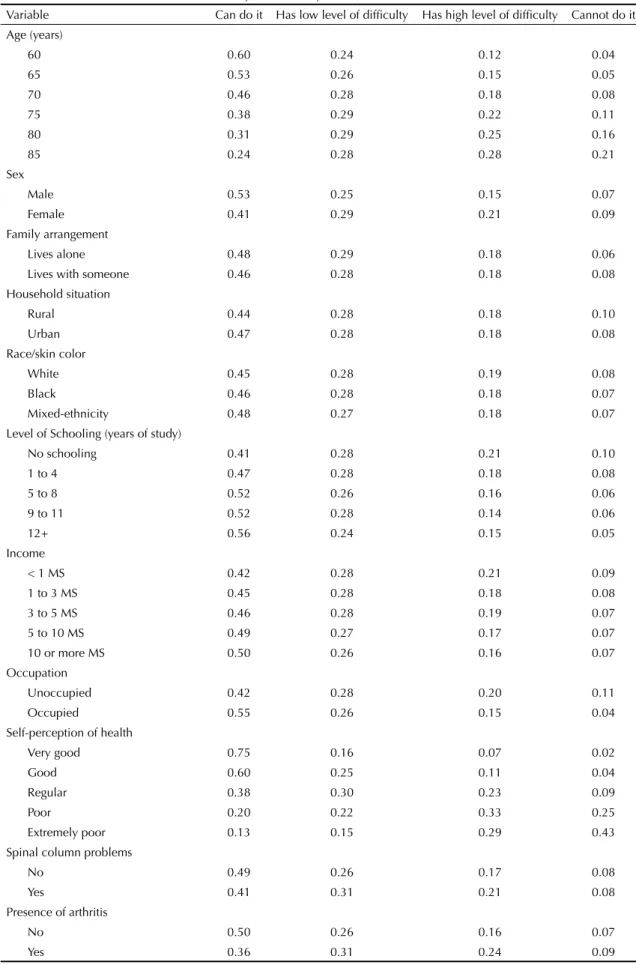
After controlling the factors of the contextual level, there was reduction of 13%, 36.3% and 36.7% in the random effect variance, which continued to be statisti-cally different from zero for the three categories of the dependent variable, indicating that there still was vari-ability in the contextual level, which might be reduced with the additional inclusion of variables of this level in the model. The inclusion of the contextual variables in the model did not cause important modifi cations in the esti-mates of the coeffi cients of the individual variables. The interpretation of the fi nal model was carried out in terms of probabilities (Table 3). The probability of the individual to be able to climb slopes or stairs decreased as age increased (0.60 at 60 years of age and 0.24 at 85 years) and increased in the category cannot do it (0.04 at 60 years of age and 0.21 at 85 years). The female sex showed higher probability to have high level of
diffi culty (0.21) and not to be able to do it (0.09)
compared to men (0.15 and 0.07, respectively). The probability of the elderly who lived with someone to fail in the execution of the activity was higher compared to those who lived alone (0.08 and 0.06, respectively). As for the household situation, the elderly who lived in the rural area presented higher probability to fail to do it compared to those living in the urban area (0.10 and 0.08, respectively). Having black and mixed (black and white) skin color reduced the probability of the elderly to fail to climb slopes or stairs (0.07). As for level of schooling and income, as the levels increased, the probability of the elderly individuals to be able to carry out the activity increased. Income lower than one minimum salary increased the probability of failure in the accomplishment of the activity (0.09). The occupied elderly individuals had lower probability to present high level of diffi culty (0.15) in relation to the unoc-cupied individuals. The unocunoc-cupied individuals, in turn, presented high probability (0.11) of failure, compared to the occupied ones (0.04).
Concerning the health indicators, the elderly who self-perceived their health as poor (0.25) and extremely poor (0.43) had much higher propensity to fail in carrying out the activity. Regarding chronic diseases, the absence of spinal column problems increased the probability (0.49) of success in the accomplishment of the activity. Those suffering from arthritis, diabetes, bronchitis, hyperten-sion, heart disease, chronic renal failure, depression and tuberculosis presented increased probability to have high level of diffi culty (probabilities of 0.24; 0.21; 0.27; 0.20; 0.25; 0.22; 0.21; 0.32; respectively) compared to individuals without those diseases (probabilities of 0.16; 0.18; 0.18; 0.17; 0.17; 0.18; 0.18; 0.18; respectively). The presence of cancer increased the probability to fail to accomplish the activity (0.11) compared to those who did not suffer from it (0.08). Tendinitis and cirrhosis did not have a statistically signifi cant association. In the case of occurrence of hospitalizations in the last 12 months, the elderly had high probability of high level of diffi culty (0.22) and of failure in climbing slopes or stairs (0.15) compared to those who were not hospitalized (0.18 and 0.07, respectively). Elderly individuals who owned a health plan had lower probability to present high level of diffi culty (0.16) in accomplishing the activity compared to those who did not have a health plan (0.19).
In relation to the contextual variables, the Gini Index in 2000 presented a statistically signifi cant association with the functional disability of the elderly. The elderly who lived in FU with greater levels of economic inequality presented higher probabilities to have high level of diffi culty (0.21) or to fail (0.09) to climb slopes or stairs compared to the elderly who lived in States with lower economic disadvantages (0.16 and 0.07, respectively). The GDP in 2000 did not show a statistically signifi cant effect on the functional disability of the elderly.
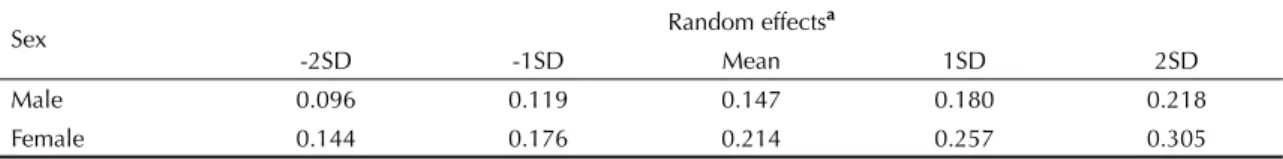
Table 4 presents the probabilities for the sex variable categories, taking into account different levels of the random effect on the category having high level of diffi culty. In areas located in the mean, the probability of a woman to present high level of diffi culty proved to be 45% higher compared to that of men (0.214/0.147). However, this probability may increase considerably if we compare women living in areas located two SD above the mean with men living in areas located two SD below the mean (218%). Due to the overlap, the prob-ability to present high level of diffi culty may be higher among men if we compare, for example, men living in FU two SD above the mean (0.218) with women living in FU located two SD below the mean (0.144).
DISCUSSION
The multinomial logistic regression model enabled to disaggregate functional capacity into more than two categories.1 Some aspects, however, limit the use of these
models. Firstly, functional disability might be understood
Table 1. Relative distribution (%) of demographic, socio-economic and health characteristics of the elderly. Brazil, 2003. (n = 33,515)
Variable n %
Sex
Male 14715 43.9
Female 18800 56.1
Family arrangement
Lives alone 4323 12.9 Lives with someone 29192 87.1 Household situation
Rural 5307 15.8
Urban 28208 84.2
Race/skin color
White 18675 55.7
Black 2385 7.1
Mixed-ethnicity 12455 37.2 Level of schooling (years of study)
No schooling 12655 37.8
1 to 4 12456 37.2
5 to 8 4210 12.6
9 to 11 2510 7.5
12+ 1684 5.0
Income
< 1 MS 4343 13.0 1 to 3 MS 12580 37.5 3 to 5 MS 6949 20.7 5 to 10 MS 5471 16.3 10 or more MS 4172 12.4 Occupation
Unoccupied 22508 67.2 Occupied 11007 32.8 Self-perception of health
Very good 2534 7.6
Good 11732 35.0
Regular 14561 43.4
Poor 3813 11.4
as ordered and the risk might be estimated in relation to the immediately previous category. Nevertheless, even though an underlying order exists, the comparison between types of disability and full capacity allows to assess the effect of the several variables, having the same baseline for comparison, which makes sense because, ideally, all the elderly might be capable. Another
important aspect of the modeling process was the utili-zation of multilevel models, which allowed to estimate more accurately the parameters associated with the individual and contextual variables simultaneously.
At the individual level, the results indicate that func-tional disability was highly associated with sex. Elderly
Table 2. Estimates of the fi xed and random coeffi cients of the multilevel multinomial logistic regression models for the functional disability of the elderly. Brazil, 2003.
Variable
Model with variables of the individual level
Final model (variables of the individual and contextual levels) Has low
level of diffi culty
Has high level of diffi culty
Cannot do it
Has low level of diffi culty
Has high level of diffi culty
Cannot do it
Intercept -4.802* -7.651* -11.020* -6.764* -11.49* -14.831* Age 0.043* 0.070* 0.107* 0.043* 0.070* 0.107* Sex
Male 0.000 0.000 0.000 0.000 0.000 0.000 Female 0.413* 0.647* 0.572* 0.413* 0.648* 0.571* Family Arrangement
Lives alone 0.000 0.000 0.000 0.000 0.000 0.000 Lives with someone 0.003 0.078 0.435* 0.002 0.075 0.431* Household Situation
Rural 0.000 0.000 0.000 0.000 0.000 0.000 Urban -0.093* -0.039 -0.323* -0.093* -0.041 -0.324* Race/skin color
White 0.000 0.000 0.000 0.000 0.000 0.000 Black -0.025 -0.055 -0.211* -0.030 -0.063 -0.223* Mixed-ethnicity -0.106* -0.125* -0.162* -0.114* -0.138* -0.181* Level of schooling (years of study)
No schooling 0.000 0.000 0.000 0.000 0.000 0.000 1 to 4 -0.157* -0.281* -0.391* -0.154* -0.278* -0.386* 5 to 8 -0.306* -0.527* -0.728* -0.305* -0.526* -0.725* 9 to 11 -0.264* -0.605* -0.732* -0.265* -0.608* -0.735* 12+ -0.462* -0.611* -1.076* -0.464* -0.614* -1.081* Income
< 1 MS 0.000 0.000 0.000 0.000 0.000 0.000 1 to 3 MS -0.037 -0.207* -0.154 -0.036 -0.205* -0.151 3 to 5 MS -0.104 -0.229* -0.316* -0.102 -0.226* -0.313* 5 to 10 MS -0.173* -0.409* -0.462* -0.171* -0.405* -0.455* 10 or more MS -0.223* -0.440* -0.388* -0.221* -0.44* -0.383* Occupation
Unoccupied 0.000 0.000 0.000 0.000 0.000 0.000 Occupied -0.354* -0.563* -1.198* -0.355* -0.563* -1.200* Self-perception of health
women had higher probability to present higher func-tional loss than men. These results corroborate those
found by Giacomin et al8 (2008). Some hypotheses
might explain this difference. The fi rst one is associated with women’s longer survival. The second refers to the higher prevalence of non-fatal incapacitating conditions among women. The third hypothesis would be the women’s ability to report a higher number of health
conditions compared to men of the same age.18
The present study showed that aging increased the prob-ability of the elderly to present functional disprob-ability, in
agreement with previous studies.11,16
Black and mixed (black and white) race/color was a protective factor of functional disability, contradicting the fi ndings of Guralnik & Kaplan10 (1989) in the USA.
It is possible that black and mixed ethnicity elderly indi-viduals in our study were healthier compared to whites, given that those with worse health conditions may have experimented higher mortality rates. It is important to remember that in Brazil, race/color is directly associ-ated with the individual’s socioeconomic situation.
Living in urban areas was a protective factor for functional disability, contradicting results found by Parahyba et al19 (2005) in Brazil. It is likely that the
elderly who live in urban areas present better life condi-tions, greater availability and access to prevention and primary or specialized medical assistance services.
Living with someone was a determinant factor for functional disability. Elderly individuals who live with someone are more likely not to be able to climb slopes or stairs compared to those who live alone. Our fi ndings corroborate those of Rosa et al24 (2003), suggesting that
elderly people who live alone are probably healthier and more independent.
The higher the level of schooling and income, the lower the probability of the elderly person to report
a worse functional capacity, which confi rms previous
fi ndings.4,15 Schooling brings diverse advantages to
health because it infl uences psychosocial and
behav-ioral factors.7 Elderly individuals with higher level of
schooling are less likely to be exposed to the risk factors for diseases and to submit themselves to inadequate working conditions. Higher level of schooling favors
Table 2 continuation
Variable
Model with variables of the individual level
Final model (variables of the individual and contextual levels) Has low
level of diffi culty
Has high level of diffi culty
Cannot do it
Has low level of diffi culty
Has high level of diffi culty
Cannot do it
Spinal column problemsa 0.374* 0.394* 0.139* 0.374* 0.396* 0.141*
Presence of arthritisa 0.488* 0.710* 0.587* 0.488* 0.708* 0.584*
Presence of cancera -0.047 0.041 0.312* -0.044 0.045 0.319*
Presence of diabetesa 0.152* 0.275* 0.269* 0.153* 0.275* 0.269*
Presence of bronchitis/asthmaa 0.440* 0.745* 0.579* 0.443* 0.749* 0.584*
Presence of hipertensiona 0.266* 0.348* 0.247* 0.267* 0.349* 0.247*
Presence of heart diseasea 0.375* 0.713* 0.576* 0.377* 0.716* 0.582*
Chronic renal failurea 0.209* 0.403* 0.550* 0.210* 0.405* 0.556*
Presence of depressiona 0.186* 0.340* 0.646* 0.188* 0.343* 0.651*
Presence of tuberculosisa 0.517 0.960* -0.022 0.517 0.961* -0.02
Presence of tendinitisa 0.056 0.088 0.128 0.056 0.091 0.13
Presence of cirrhosisa 0.110 0.452 0.594 0.111 0.455 0.595
Hospitalization in the last 12 monthsa 0.215* 0.447* 1.009* 0.216* 0.448* 1.01*
Affi liation to health plana -0.079 -0.285* -0.331* -0.078 -0.284* -0.331*
Gini Index in 2000 0.03 0.059* 0.061*
Gross Domestic Product (GDP) in 2000 0.006 0.017 -0.007 Random effect 0.054* 0.091* 0.150* 0.047* 0.058* 0.095* Fontsource: PNAD (National Household Survey) 2003;IBGE (Brazilian Institute of Geography and Statistics) 2000; Institute of Applied Economic Research 2000
* p 0.05
a Reference group = no (0.000)
Table 3. Probabilities for the functional disability of the elderly. Brazil, 2003.
Variable Can do it Has low level of diffi culty Has high level of diffi culty Cannot do it Age (years)
60 0.60 0.24 0.12 0.04
65 0.53 0.26 0.15 0.05
70 0.46 0.28 0.18 0.08
75 0.38 0.29 0.22 0.11
80 0.31 0.29 0.25 0.16
85 0.24 0.28 0.28 0.21
Sex
Male 0.53 0.25 0.15 0.07
Female 0.41 0.29 0.21 0.09
Family arrangement
Lives alone 0.48 0.29 0.18 0.06
Lives with someone 0.46 0.28 0.18 0.08
Household situation
Rural 0.44 0.28 0.18 0.10
Urban 0.47 0.28 0.18 0.08
Race/skin color
White 0.45 0.28 0.19 0.08
Black 0.46 0.28 0.18 0.07
Mixed-ethnicity 0.48 0.27 0.18 0.07
Level of Schooling (years of study)
No schooling 0.41 0.28 0.21 0.10
1 to 4 0.47 0.28 0.18 0.08
5 to 8 0.52 0.26 0.16 0.06
9 to 11 0.52 0.28 0.14 0.06
12+ 0.56 0.24 0.15 0.05
Income
< 1 MS 0.42 0.28 0.21 0.09
1 to 3 MS 0.45 0.28 0.18 0.08
3 to 5 MS 0.46 0.28 0.19 0.07
5 to 10 MS 0.49 0.27 0.17 0.07
10 or more MS 0.50 0.26 0.16 0.07
Occupation
Unoccupied 0.42 0.28 0.20 0.11
Occupied 0.55 0.26 0.15 0.04
Self-perception of health
Very good 0.75 0.16 0.07 0.02
Good 0.60 0.25 0.11 0.04
Regular 0.38 0.30 0.23 0.09
Poor 0.20 0.22 0.33 0.25
Extremely poor 0.13 0.15 0.29 0.43
Spinal column problems
No 0.49 0.26 0.17 0.08
Yes 0.41 0.31 0.21 0.08
Presence of arthritis
No 0.50 0.26 0.16 0.07
Yes 0.36 0.31 0.24 0.09
the access to: information, lifestyle modifi cations, adoption of healthy habits and visits to healthcare services.25 Probably, poorer elderly individuals attend
the healthcare services less frequently, and have less access to treatments and medicines. Occupation also exerts a protective effect. The occupied elderly person is less likely to present worse functional capacity. These results are in agreement with those reported by Cheng
et al6 (2002) in which occupied elderly individuals
present few diffi culties in activities of daily living when compared to those who do not work. It is reasonable to suppose that elderly people who work are more independent and healthier.
Concerning their self-perception of health, the prob-ability of an increase in the dependence degree was higher for the elderly who rated their health as poor, confi rming previous fi ndings.14
Chronic diseases had a strong infl uence on the functional capacity of the elderly. Alves et al1 (2007) investigated
the influence of chronic diseases on the functional capacity of the inhabitants of the municipality of São Paulo, southeast of Brazil, in 2000, observing that the chronic conditions had a signifi cant infl uence on func-tional dependence and that heart disease, pulmonary disease, hypertension and arthropathy presented the greatest effects.
Table 3 continuation
Variable Can do it Has low level of diffi culty Has high level of diffi culty Cannot do it Presence of cancer
No 0.46 0.28 0.18 0.08
Yes 0.45 0.26 0.19 0.11
Presence of diabetes
No 0.47 0.28 0.18 0.08
Yes 0.42 0.29 0.21 0.09
Presence of bronchitis/asthma
No 0.47 0.27 0.18 0.08
Yes 0.33 0.30 0.27 0.10
Presence of hypertension
No 0.50 0.26 0.17 0.08
Yes 0.42 0.29 0.20 0.08
Presence of heart disease
No 0.48 0.27 0.17 0.07
Yes 0.36 0.29 0.25 0.10
Chronic renal failure
No 0.46 0.28 0.18 0.08
Yes 0.38 0.28 0.22 0.11
Presence of depression
No 0.47 0.28 0.18 0.08
Yes 0.39 0.28 0.21 0.12
Presence of tuberculosis
No 0.46 0.28 0.18 0.08
Yes 0.31 0.31 0.32 0.05
Hospitalization in the last 12 months
No 0.47 0.28 0.18 0.07
Yes 0.37 0.27 0.22 0.15
Affi liation to a health plan
No 0.45 0.28 0.19 0.08
Yes 0.49 0.28 0.16 0.07
Gini Index in 2000
Percentile 25 0.50 0.27 0.16 0.07
Percentile 50 0.48 0.27 0.17 0.08
Percentile 75 0.42 0.28 0.21 0.09
Sources: PNAD (National Household Survey) 2003; IBGE (Brazilian Institute of Geography and Statistics) 2000; Institute of Applied Economic Research) 2000
As for hospitalizations, the associations that were found coincided with those of the study carried out by
Boyd et al5 (2005), in which the elderly became more
vulnerable to functional decline and dependence after hospitalization.
An important relationship was observed between affi liation to health plan and functional disability. The elderly affi liated to health plans had lower probability to fail to climb slopes or stairs. Although we have not found studies on the relationship between health plan and functional disability of the elderly, it is probable that individuals with health plan attend the healthcare services more frequently and present higher adher-ence to treatments, which contribute to improve their functional capacity.
The results showed an effect of the income inequality of the FU on the functional disability of the elderly, even when controlled by the average income level (GDP). Although there are many studies about the relationship between income inequality and health status, this kind of investigation is still rare in Brazil. The main results indicate lack of relationship between income inequality
and health status. However, Noronhad (2005) found
that the individuals who live in unequal places have smaller chances of being healthy. This effect would express the characteristics associated with the context in which the individual is inserted rather than shortage of material resources or the lower purchasing power of poorer individuals.
Other fi ndings of the present study show that the elderly who live in more unequal states have higher probability to present functional loss. The mechanisms through which income inequality affects functional disability in Brazil can be explained taking into account the particularities of the Brazilian reality. The country presents one of the worst income distributions in the world and is characterized by the presence of individual
and regional inequalities, which defi nes, on one side,
richer cities and regions, with socioeconomic and health indicators that are similar to those of more developed economies, and on the other side, very poor cities and regions, like those observed in the FU of the North and Northeast of Brazil. The presence of these inequities
results in unequal distribution of resources across the cities and, consequently, unequal access to goods and services that are important to the level of health of the individual and of the population, such as healthcare
services, education and basic sanitation.3
The investigation of the relationship between functional disability and individual and contextual factors related to the economic situation is relevant, due to the deep socioeconomic disparities observed among individuals
and among states. We did not fi nd in the Brazilian
literature any references to studies about this kind of analysis that assesses the effect of income inequality on functional disability in the FU, and also analyzes the characteristics of the individuals and of the context, considering the hierarchic structure of the data.
Even after controlling through variables of the contex-tual level, we verifi ed the existence of a variability that still needs to be explained. Thus, future research could investigate other important aspects of the contextual level related to functional disability of the elderly in Brazil.
As for the study’s limitations, the few works about multilevel analysis and functional disability in the international literature, the lack of studies in Brazil, the difference concerning the context variables used in the analysis hindered the comparison between the present
fi ndings. Another limitation refers to the cross-sectional design, which prevented causal inferences.
The identifi cation of factors associated with the
func-tional disability of the elderly provides relevant elements for prevention and intervention measures and is funda-mental in the present society. The study suggests that policies focusing on the reduction in social and economic inequalities should be encouraged, like for example: guaranteeing education in the early phases of life and the permanence of the elderly in the labor market. Finally, the present study strengthens the importance of strategies targeted at the maintenance of health and of a life without disability, with preventive actions and the organization of the health system so as to meet the real needs of this portion of the population, which is the one that has the highest growth rate in Brazil. Thus, the individuals would be able to age in a healthier way, living their additional years of life with higher quality.
Table 4. Probabilities of an elderly individual to have high level of diffi culty in climbing slopes or stairs, by sex and random effect levels. Brazil, 2003.
Sex Random effects
a
-2SD -1SD Mean 1SD 2SD
Male 0.096 0.119 0.147 0.180 0.218
Female 0.144 0.176 0.214 0.257 0.305
a Random effect levels: 2 standard deviations below the mean, 1 standard deviation below the mean, mean, 1 standard deviation
above the mean, 2 standard deviations above the mean
1. Alves LC, Leimann BCQ, Vasconcelos MEL, Carvalho MS, Vasconcelos AGG, Fonseca TCO, et al. A infl uência das doenças crônicas na capacidade funcional dos idosos do Município de São Paulo, Brasil. Cad Saude Publica. 2007;23(8):1924-930. DOI:10.1590/S0102-311X2007000800019
2. Alves LC, Leite IC, Machado CJ. Conceituando e mensurando a incapacidade funcional da população idosa: uma revisão de literatura. Cienc Saude Coletiva. 2008;13(4):1199-207. DOI:10.1590/S1413-81232008000400016
3. Barros RP, Mendonça R. Os determinantes da desigualdade no Brasil. In: Instituto de Pesquisa Econômica Aplicada. A economia brasileira em perspectiva, 2006. Rio de Janeiro; 1996. v.2, p.421-73.
4. Berkman CS, Gurland BJ. The relationship among income, other socioeconomic indicators, and functional level in older persons. J Aging Health. 1998;10(1):81-98. DOI:10.1177/089826439801000105
5. Boyd CM, Xue QL, Simpson CF, Guralnik JM, Fried LP. Frailty, hospitalization, and progression of disability in a cohort of disabled older women.
Am J Med. 2005;118(11):1225-31. DOI:10.1016/j. amjmed.2005.01.062
6. Cheng YH, Chi I, Boey KW, Ko LS, Chou KL. Self-rated economic condition and the health of elderly persons in Hong Kong. Soc Sci Med. 2002;55(8):1415-24. DOI:10.1016/S0277-9536(01)00271-4
7. Elo IT, Preston SH. Educational differentials in mortality: United States, 1979-85. Soc Sci Med. 1996;42(1):47-57. DOI:10.1016/0277-9536(95)00062-3
8. Giacomin KC, Peixoto SV, Uchoa E, Lima-Costa MF. Estudo de base populacional dos fatores associados à incapacidade funcional entre idosos na Região Metropolitana de Belo Horizonte, Minas Gerais, Brasil. Cad Saude Publica. 2008;24(6):1260-70. DOI:10.1590/S0102-311X2008000600007
9. Goldstein H. Multilevel statistical models. London: Arnold; 2003. (Kendall’s library of statistics, 3).
10. Guralnik JM, Kaplan GA. Predictors of healthy aging: prospective evidence from the Alameda County study.
Am J Public Health. 1989;79(6):703-8. DOI:10.2105/ AJPH.79.6.703
11. Guralnik JM, LaCroix AZ, Abbott RD, Berkman LF, Satterfi eld S, Evans DA, et al. Maintaining mobility in late life. I. Demographic characteristics and chronic conditions. Am J Epidemiol. 1993;137(8):845-57.
12. Guralnik JM, Fried LP, Salive ME. Disability as a public health outcome in the aging population. Annu Rev Public Health. 1996;17:25-46. DOI:10.1146/annurev. pu.17.050196.000325
13. Kaplan GA, Pamuk ER, Lynch JW, Cohen RD, Balfour JL. Inequality in Income and mortality in the United States: analysis of mortality and potential pathways.
BMJ. 1996;312(7037):999-1003.
14. Lee Y, Shinkai S. A comparison of correlates of self-rated health and functional disability of older persons in the Far East: Japan and Korea. Arch Gerontol Geriatr. 2003;37(1):63-76. DOI:10.1016/S0167-4943(03)00021-9
15. Lima-Costa MF, Matos DL, Camarano AA. Evolução das desigualdades sociais em saúde entre idosos e adultos brasileiros: um estudo baseado na Pesquisa Nacional por Amostra de Domicílios (PNAD 1998, 2003). Cienc Saude Coletiva. 2006;11(4):941-50. DOI:10.1590/S1413-81232006000400016
16. Maciel ACC, Guerra RO. Infl uência dos fatores biopsicossociais sobre a capacidade funcional de idosos residentes no nordestes do Brasil. Rev Bras Epidemiol. 2007;10(2):178-89. DOI:10.1590/S1415-790X2007000200006
17. Melzer D, McWillians B, Brayne C, Johnson T, Bond J. Profi le of disability in elderly people: estimates from a longitudinal population study. BMJ.
1999;318(7191):1108-11.
18. Murtagh KN, Hubert HB. Gender differences in physical disability among an elderly cohort. Am J Public Health. 2004;94(8):1406-11. DOI:10.2105/ AJPH.94.8.1406
19. Parahyba MI, Veras R, Melzer D. Incapacidade funcional entre as mulheres idosas no Brasil. Rev Saude Publica. 2005;39(3):383-91. DOI: 10.1590/ S0034-89102005000300008
20. Pinheiro RS, Torres TZG. Uso de serviços
odontológicos entre os Estados do Brasil. Cienc Saude Coletiva. 2006;11(4):999-1010. DOI:10.1590/S1413-81232006000400021
21. Porell FW, Miltiades HB. Regional differences in functional status among the aged. Soc Sci Med. 2002;54(8):1181-98. DOI:10.1016/S0277-9536(01)00088-0
22. Rasbash J, Browne W, Goldstein H, Yang M, Plewis I, Healy M, et al. A user’s guide to MLwiN. London: Institute of Education; 2000.
23. Rutherford RD, Chloe MK. Statistical models for causal analysis. New York: Wiley; 1993.
24. Rosa TEC, Benício MHA, Latorre MRDO, Ramos LR. Fatores determinantes da capacidade funcional entre idosos. Rev Saude Publica. 2003;37(1):40-8. DOI:10.1590/S0034-89102003000100008
25. Ross CE, Wu CL. Education, age, and the
cumulative advantage in health. J Health Soc Behav.
1996;37(1):104-20. DOI:10.2307/2137234 REFERENCES
LC Alves was supported by Conselho Nacional de Desenvolvimento Científi co e Tecnológico (National Council for Scientifi c and Technological Development - CNPq; doctoral scholarship; Process no.: 141861/2005-3).