Abstract
Objective: To assess the effects of a nutritional education program on the prevalence of overweight/obesity and on the foods eaten by schoolchildren in the 2nd grade of primary education.
Methods: The sample was made up of 135 schoolchildren, recruited from one private and one public school in Florianópolis, Brazil, and allocated to either an intervention group (n = 55) or a no-intervention group (n = 80). The children underwent two anthropometric assessments and two dietary intake assessments, before and after attending a nutritional education program. The program consisted of eight fortnightly meetings and covered subjects related to healthy diets, how to make healthy snacks, and physical activity. Nutritional status was classiied according to body mass index for age, using the Centers for Disease Control and Prevention growth charts as reference, and the foods the children ate at school were classiied according to the Santa Catarina School Canteens Act. Data were analyzed using the Statistical Package for the Social Sciences, and values of p ≤ 0.05 were deined as signiicant.
Results: The percentage of overweight/obese schoolchildren increased from 21.8 to 23.6% in the intervention group and from 33.7 to 35.0% in the no-intervention group (p > 0.05). The intervention group signiicantly (p = 0.013) reduced its intake of artiicial juice, which is prohibited by the Act. In the no-intervention group, there was a signiicant increase in intake of prohibited foods, such as mass-produced snacks (p = 0.021) and soda (p = 0.031). Furthermore, the intake of breakfast cereal, which is appropriate for eating at school, decreased (p = 0.039).
Conclusion: Despite its short duration, after attending the nutritional education program, there were improvements in the quality of the food the schoolchildren were eating.
J Pediatr (Rio J). 2009;85(4):315-321: Dietary and nutritional education, nutritional assessment, dietary habits, anthropometry, overweight, obesity.
ORiginAl ARtiCle
Copyright © 2009 by Sociedade Brasileira de Pediatria315
evaluating the effect of nutritional education
on the prevalence of overweight/obesity
and on foods eaten at primary schools
Patrícia S. Fernandes,1 Carla de O. Bernardo,2Rosângela M. M. B. Campos,3 Francisco de A. g. de Vasconcelos4
1. Nutricionista, Curso de Graduação em Nutrição, Centro de Ciências da Saúde, Universidade Federal de Santa Catarina (UFSC), Florianópolis, SC, Brazil. 2. Mestranda, Programa de Pós-Graduação em Nutrição, Centro de Ciências da Saúde, UFSC, Florianópolis, SC, Brazil.
3. Nutricionista, Pesquisadora voluntária, Centro de Ciências da Saúde, UFSC, Florianópolis, SC, Brazil. 4. Doutor. Professor, Departamento de Nutrição, Centro de Ciências da Saúde, UFSC, Florianópolis, SC, Brazil.
Financial support: Fundação de Apoio à Pesquisa Científica e Tecnológica do Estado de Santa Catarina (FAPESC) and Conselho Nacional de Desenvolvimento Científico e Tecnológico (CNPq) (protocol no. 501656/2004-9).
No conflicts of interest declared concerning the publication of this article.
Suggested citation: Fernandes PS, Bernardo CO, Campos RM, de Vasconcelos FA. Evaluating the effect of nutritional education on the prevalence of overweight/ obesity and on foods eaten at primary schools. J Pediatr (Rio J). 2009;85(4):315-321.
Manuscript submitted Nov 24 2008, accepted for publication May 19 2009. doi:10.2223/JPED.1917
introduction
The prevalence of obesity in children and adolescents has been increasing in many different countries worldwide, including in Brazil. This is strongly associated with changes in lifestyle and dietary habits, such as easy access to and the low cost of foods that contain high proportions of fats and sugars.1
International organizations recommend that healthy dietary habits should be promoted in the school
environment,2 since these habits must be solidiied right from early childhood.
The implementation of nutritional education programs in schools and consequent creation of an environment that is favorable for health and the promotion of healthy dietary habits and lifestyles are important strategies for dealing with dietary and nutritional problems such as obesity and the non-infectious chronic diseases that are associated with it.4
According to the American Dietetic Association (ADA), the school environment is an important place for implementing intervention strategies for nurturing healthy lifestyle habits, and one where it is possible to provide schoolchildren with nutritionally balanced snacks, regular physical exercise and nutritional education programs.5
Aiming at health promotion and the prevention of obesity and the diseases associated with it, the World Health Organization (WHO) launched the “Global Strategy on Diet, Physical Activity and Health” initiative, which was approved by 191 countries in 2004. Of note among the recommendations are those that are designed to promote healthy dietary habits within the school environment, such as regulation of the foods sold in school canteens.6
Particularly if done before the age of 10 years, nutritional interventions with children have shown greater reductions in the severity of obesity than when carried out with adults, since during childhood parents can have an inluence on changing their children’s diet and physical activity habits.7
Pérez et al.,8 writing about a nutritional intervention with schoolchildren, described improvements in nutritional knowledge and attitudes and in the dietary habits of schoolchildren, and also detected an effect on the dietary habits of their families. Studies undertaken in the United Kingdom with children aged 7 to 11 years that evaluated the effectiveness of nutritional education programs at stimulating children to eat healthy foods, found signiicant improvements in the quality of dietary intake, but these changes did not have any effect on body mass index (BMI).9,10
In the state of Santa Catarina, signiicant changes were introduced to school diets when the Canteens Regulation Act was passed.11 It became illegal to sell alcoholic beverages, candies, lollipops, chewing gum, soda, artiicial juice, fried or mass-produced snacks and mass-produced popcorn, and it became obligatory to offer at least two types of in-season fruit for sale every day.
The objective of this article is to present the results of a controlled intervention study of the effectiveness of a nutritional education program aiming at the prevention of obesity and at improving the dietary intake proile of schoolchildren enrolled on the 2nd grade of primary education at two schools in the city of Florianópolis, Brazil.
Methods
Sample
This was an intervention study carried out with schoolchildren in the 2nd grade of primary education attending one of two institutions in Florianópolis, one public and the other private, chosen on a non-random basis by judgment from among 16 schools that had taken part in an earlier investigation.12
The schoolchildren were allocated to one of two investigation groups: 1) an intervention group (n = 55), comprising two classes from the public school and two classes from the private school and who attended the nutritional education; and 2) a no-intervention group (n = 80), comprising four classes from the public school and one from the private school who did not attend the nutritional education.
The sample included all schoolchildren enrolled at the two schools whose parents gave permission and who attended on both data collection days. Schoolchildren were excluded if they did not have parental consent, were absent on one or both of the data collection days or did not agree to take part. From the 192 schoolchildren enrolled at the two institutions, a total of 135 (70.3%) took part in the study from start to inish. Of the remaining 57 schoolchildren (29.7%), 37 did not take part because they did not have parental consent, seven had changed schools and 13 were absent on data collection days.
Collection of anthropometric data and dietary intake data
The anthropometric measurements (weight and height) were taken after the research team had been trained according to the standardization criteria recommended by the WHO.13
Weight was recorded in kilograms and measured with a Martedigital balance (accurate to 100 grams), with children unshod, wearing light clothing and standing in the center of the balance platform. Height was measured using an Alturaexata portable stadiometer (accurate to 0.1 cm), with children unshod, in orthostatic position, arms by their sides, feet together, knees straight, head aligned along the Frankfort horizontal plane and in apnea after a deep breath.
Data were collected twice, once before and once after the nutritional education program, during March and July of 2006.
The study was approved by the Human Research Ethics Committee at the Universidade Federal de Santa Catarina (protocol no. 120/04). The students consented to take part voluntarily and their parents gave authorization in the form of signed Free and Informed Consent Forms, which guaranteed conidentiality of information and included an undertaking to return the results to the schools and other interested parties.
Nutritional education program
The nutritional education program was designed to provide children with information on diet and nutrition, with the aim of forming healthy dietary habits as a means of preventing obesity.
The information was taught using learning-through-play teaching methods, including games, puppet theatres, posters, group games, songs and children’s stories. Care was taken to priorities the schoolchildren’s interaction and participation, aiming to create an interactive and dynamic educational process.
The program consisted of eight fortnightly meetings, each lasting 50 minutes and covering the following subjects: digestion of food and uptake of nutrients, food groups, foods and nutrients, the food pyramid guide, using the food pyramid guide to create a healthy menu, physical activity guide, a review of the whole program content and a puppet theatre play about diet.
The tool used to introduce the food groups and the foods in each group was the food pyramid,16 which visually represents important dietary concepts such as variety, proportion and moderation, i.e., it is a summary of what the daily diet should be like.17
The teachers of those classes who were not attending the intervention were instructed by the research team and the school administration not to teach them about diet and nutrition during the study period.
Data processing and analysis
Data were analyzed with the aid of the Statistical Package for the Social Sciences (SPSS) for Windows version 15.0.
Nutritional status was deined on the basis of BMI for age and sex, using the Centers for Disease Control and Prevention reference data.18 After nutritional assessment, the schoolchildren were classiied into one of two groups: not overweight/obese (those whose BMI was < 85th percentile) and overweight/obese (those whose BMI was ≥ 85th percentile).
The foods listed by the schoolchildren were classiied as permitted or prohibited by the Canteens Act11 and were
analyzed on the basis of the frequency with which they were eaten by children in the intervention and no-intervention groups before and after the nutritional education program. As set out in the Law,11 the following foods were deined as prohibited: candies, lollipops, chewing gum, soda, artiicial juice, produced snacks, fried snacks and mass-produced popcorn. The Law11 also makes it compulsory to offer at least two types of in-season fruit every day, but it does not deine which foods are permitted. This being so, for the purposes of this study all other foods were considered to be permitted.
In order to analyze the effectiveness of the program with relation to dietary intake, schoolchildren were classiied according to the number of days covered by the recall on which they ate prohibited foods (0-1 day or 2-3 days).
The descriptive analysis is presented in terms of means, medians, standard deviations and minimum and maximum values.
The Mann-Whitney test was used to compare the means for the variable age, and the chi-square test was used to compare the variables sex, nutritional status and dietary intake between the two groups (intervention and no-intervention), and the McNemar test was used to identify any possible changes in nutritional status and dietary intake from before to after the intervention. Results were considered signiicant where p was ≤ 0.05.
Results
A total of 135 schoolchildren from the 2nd grade of primary education took part in this study. Of these, 64 (47.4%) were male and 71 (52.6%) were female. With relation to their educational institution, 44 (32.6%) were enrolled at the public school and 91 (67.4%) were enrolled at the private school.
Table 1 shows the distribution of the schoolchildren by sex, age, nutritional status and the frequency with which they ate foods prohibited by the School Canteens Act at the time of the irst data collection, before the nutritional education program. It will be observed that the tests of homogeneity did not detect any signiicant differences between the schoolchildren in the intervention and no-intervention groups.
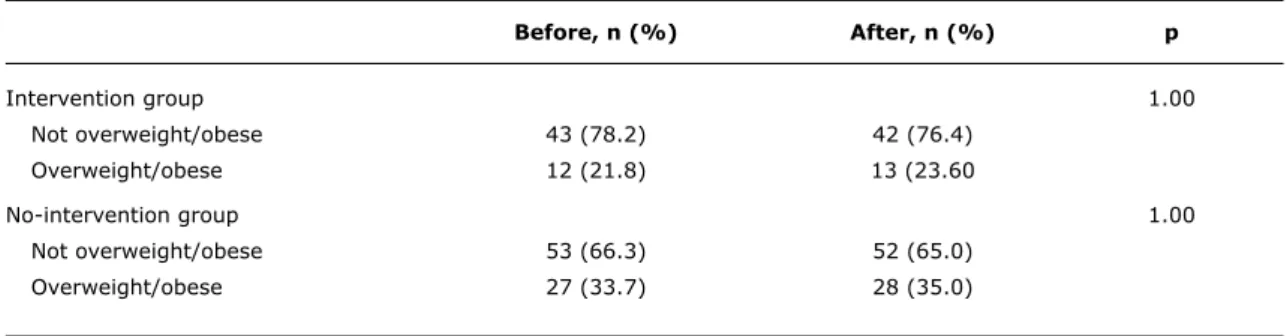
With relation to nutritional status, it can be observed that the prevalence of overweight/obesity in the intervention group rose from 21.8% before the nutritional education program to 23.6% after the program (p = 1.000). In the no-intervention group, this prevalence rose from 33.7 to 35.0% (p = 1.000) (Table 2).
intervention (n = 55) no-intervention (n = 80)
n (%) n (%) p
Sex 0,075
Male 21 (15.5) 43 (31.9)
Female 34 (25.2) 37 (27.4)
Age (years), mean ± standard deviation 8.2±0.76 8.1±0.48 0.485
Nutritional status 0.133
Not overweight/obese 43 (31.9) 53 (39.2)
Overweight/obese 12 (8.9) 27 (20.0)
Eats prohibited foods 0.102
0-1 day 34 (25.2) 60 (44.5)
2-3 days 21 (15.5) 20 (14.8)
table 1 - Distribution of the schoolchildren by sex, age, nutritional status and frequency of eating foods prohibited by the School Canteens Act at the irst data collection, before the nutritional education program, for the inter-vention and no-interinter-vention groups (Florianópolis, Brazil - July 2006)
Before, n (%) After, n (%) p
Intervention group 1.00
Not overweight/obese 43 (78.2) 42 (76.4)
Overweight/obese 12 (21.8) 13 (23.60
No-intervention group 1.00
Not overweight/obese 53 (66.3) 52 (65.0)
Overweight/obese 27 (33.7) 28 (35.0)
table 2 - Distribution of percentages of overweight/obese schoolchildren in the intervention and no-intervention groups, at both data collection points (Florianópolis, Brazil - July 2006)
(p = 0.302). In the no-intervention group the percentage of children eating these foods on 2 or 3 days dropped from 25 to 21.3%, which was also not statistically signiicance (p = 0.629).
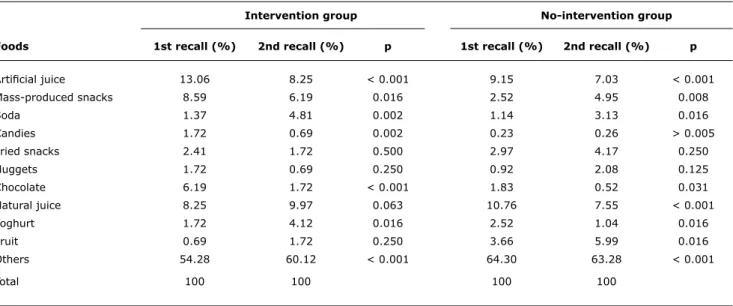
In the intervention group, there was a signiicant reduction in intake of artiicial juice (p = 0.013), which is prohibited by the School Canteens Act,11 after the program (Table 4). The percentage of intervention group children eating mass-produced snacks also reduced, from 38.2 to 29.1% (p = 0.332), but this reduction was not statistically signiicant. In contrast, in the no-intervention group, the percentage eating this particular food increased signiicantly (p = 0.021), indicating improved dietary choices among the schoolchildren who attended the nutritional education.
There were also reductions in the percentage of children in the intervention group eating candies/lollipops/chewing gum from 12.7 to 3.6% (p = 0.125) and the percentage eating mass-produced popcorn fell from 7.3 to 0% (p = 125), all of which are prohibited by the Act.11 These reductions were not statistically signiicant, possibly because of the small sample size, but they do indicate important changes in the dietary intake of the children who had received nutritional education that might become signiicant in studies of larger populations.
1st dietary recall (before) 2nd dietary recall (after)
0-1 day (%) 2-3 days (%) p 0-1 day (%) 2-3 days (%) p
Intervention (n = 55) 61.8 38.2 70.9 29.1
No-intervention (n = 80) 75.0 25.0 0.302 78.7 21.3 0.629
table 3 - Frequency of eating foods prohibited by the School Canteens Act, as recorded by the schoolchildren themselves, in the interven-tion and no-interveninterven-tion groups, for the two 3-day dietary recalls conducted (Florianópolis, Brazil - July 2006)
intervention group no-intervention group
Foods 1st recall (%) 2nd recall (%) p 1st recall (%) 2nd recall (%) p
Artiicial juice 13.06 8.25 < 0.001 9.15 7.03 < 0.001
Mass-produced snacks 8.59 6.19 0.016 2.52 4.95 0.008
Soda 1.37 4.81 0.002 1.14 3.13 0.016
Candies 1.72 0.69 0.002 0.23 0.26 > 0.005
Fried snacks 2.41 1.72 0.500 2.97 4.17 0.250
Nuggets 1.72 0.69 0.250 0.92 2.08 0.125
Chocolate 6.19 1.72 < 0.001 1.83 0.52 0.031
Natural juice 8.25 9.97 0.063 10.76 7.55 < 0.001
Yoghurt 1.72 4.12 0.016 2.52 1.04 0.016
Fruit 0.69 1.72 0.250 3.66 5.99 0.016
Others 54.28 60.12 < 0.001 64.30 63.28 < 0.001
Total 100 100 100 100
table 4 - Distribution of percentages of children in the intervention and no-intervention groups eating certain foods, on the two dietary recalls (Florianópolis, Brazil - July 2006)
in contrast with the increase in the intervention group (p = 0.109).
With relation to those foods that the nutritional education program encouraged students to eat, since they were more nutritionally appropriate for eating at school, an increase was observed in the percentage of students in the intervention group eating breakfast cereal, from 1.8 to 7.3% (p = 0.375), and there was a signiicant reduction in the percentage eating this food in the no-intervention group, from 11.3 to 2.5% (p = 0.039). There was also an increase in the percentage of children in the intervention group who ate sandwiches, from 3.6 to 12.7% (p = 0.180), while in the no-intervention group, the percentage eating sandwiches dropped from 7.6 to 2.5% (p = 0.289).
Discussion
One limitation of this study was the proximity of the classes chosen for the intervention and no-intervention groups, which could have resulted in contamination and alteration of results. Nevertheless, the teachers of classes in the no-intervention group were instructed both by the research team and by the school administrations not to teach them anything about diet and nutrition during the whole investigation period. The support of the school administrations was essential to ensuring that the teachers reformulated their lesson plans as instructed.
This result may be due to the program having been of short duration, while the process of changing habits requires a long period of time before it is relected in changed nutritional status.
A similar result was observed by Gabriel et al.19 in a study carried out with schoolchildren aged 7 to 10 years in Florianópolis, in which, although nutritional education did not result in signiicant changes to the BMI of the schoolchildren, the authors did observed an increase in the frequency of healthy dietary habits after their intervention. That study19 also considered that the intervention period had not been long enough to provoke signiicant changes to their population’s anthropometric measurements.
An intervention carried out in the United Kingdom, involving children aged 7 to 11 years from 10 primary schools and including training of teachers, changes to school meals and changes to the school curriculum (with the addition of physical education and nutritional education), found that there was no change in the BMI of the schoolchildren after the intervention. Nevertheless, the nutritional quality of the dietary intake of the intervention group did improve.10
It is important to point out that dietary choices are part of a complex system, and one that is primarily determined by a child’s parents and by the cultural practices of their group. For this reason, becoming or staying healthy and learning what is necessary for care to be healthy and weight to be maintained involves long-term goals,20 that are primarily to be achieved through educational activities that also involve schoolchildren’s family members.
Bearing in mind that dietary habits are formed very early on, the dificulty in achieving changes is clear, particularly with older children, who have already become independent eaters, choosing the foods they will eat at school for themselves.21 Nevertheless, the use of continuous nutritional education programs from early childhood appears to be the best method of attempting to revert unhealthy dietary habits.22 This study corroborates that idea, indicating signiicant changes in the dietary intake of schoolchildren who underwent the intervention, such as a reduction in consumption of artiicial juice. These results show that, even over a short period of time, it is possible to observe positive changes in the dietary choices made by schoolchildren.
Ronderos et al.23 found a signiicant reduction (p < 0.05) in weight, BMI and the intake of high-energy foods by obese schoolchildren, in addition to changes in their knowledge and attitudes with relation to diet, after they had attended a nutritional education program. Gaglianone et al.24 analyzed the implementation and the impact of a nutritional education program on knowledge and attitudes relating to healthy dietary habits, and observed improvements in dietary choices and a reduction in intake of foods with a high energy density, and also observed
improvements in teachers’ knowledge about and attitudes to the prevention of obesity.
A study with obese children aged 7 to 13 carried out in the state of Rio Grande do Sul compared a nutritional education program with an out-patients obesity management clinic and observed that the program exhibited similar results to the clinic in terms of reduction of indices of body composition and calorie consumption, demonstrating the importance of this type of nutritional intervention, particularly if carried out with the involvement and active participation of parents.25
The reductions in the percentage of children eating foods prohibited by the School Canteens Act11 may not have been signiicant in the majority of cases due to the small sample size. Nevertheless, the reductions can be considered as an improvement in the quality of the foods eaten by the intervention group children. It is believed that these children began to choose healthier foods to eat at school on the basis of knowledge acquired in the classroom.
It should be pointed out that a large proportion of the foods reported by children at the public school come from the National School Meals Program (Programa Nacional de Alimentação Escolar, PNAE). This program aims to meet the nutritional requirements while at school of children in preschool and primary education at public schools and philanthropic schools, contributing to their growth, development, learning and performance, and also to the formation of healthy dietary habits.26 This is, therefore, a limitation of this study, since the intake of different foods at the public school was dependent on the frequency with which these were offered to the children. One example is fruit, the intake of which was increased on the second dietary recall because the PNAE had begun to provide it with greater frequency after the irst dietary recall. Similarly, a study carried out by Perry et al.,27 that used strategies designed to encourage eating of fruit, salad and vegetables by schoolchildren aged six to nine, was able to observe an increase in the quantity of these foods in school meals after the intervention.
It should also be pointed out that the canteen at the private school is in compliance with the School Canteens Act11 whereas the canteen at the public school is not in compliance, and continues to sell prohibited foods, such as fried and mass-produced snacks. This emphasizes the need for and importance of inspections of the canteens to ensure that they are only selling foods recommended by the law. In order to effectively promote healthy dietary habits, it is necessary to work using interventions in the classroom with schoolchildren and with parents in their own homes, but it is also essential that school canteens provide healthy food.28
References
1. Wang Y, Monteiro C, Popkin BM. Trends of obesity and underweight
in older children and adolescents in the United States, Brazil,
China and Russia. Am J Clin Nutr. 2002;75:971-7.
2. Organización Pan-Americana de la Salud. Rede Latinoamericana de Escuelas Promotoras de la Salud. Washington, DC: FAO; 1999. 3. New South Wales Centre for Public Health Nutrition. Best options
for promoting healthy weight and preventing weight gain in NSW. New South Wales: University of Sidney; 2005.
4. Buss PM. Promoção e educação em saúde no âmbito da Escola de Governo em Saúde da Escola Nacional de Saúde Pública. Cad Saude Publica. 1999;15 Suppl 2:177-85.
5. Briggs M, Safaii S, Beall DL; American Dietetic Association; Society for Nutrition Education; American School Food Service Association. Position of the American Dietetic Association, Society for Nutrition Education, and American School Food Service Association
-Nutrition services: an essential component of comprehensive school health programs. J Am Diet Assoc. 2003;103:505-14. 6. World Health Organization (WHO). Global strategy on diet, physical
activity and health. Consultation process. http://www.who.int/ hpr/qs.consultation.document.shtml. Access: 11/07/2008. 7. Leão LS, Araújo LM, Moraes LT, Assis AM. Prevalência de obesidade
em escolares de Salvador, Bahia. Arq Bras Endocrinol Metab. 2003;47:151-7.
8. Pérez-Rodrigo C, Aranceta J. School-based nutrition education:
lessons learned and new perspectives. Public Health Nutr. 2001;4:131-9.
9. Warren JM, Henry CJ, Lighttowler HJ, Bradshaw SM, Perwaiz S.
Evaluation of a pilot school programme aimed at the prevention of obesity in children. Health Promot Int. 2003;18:287-96. 10. Sahota P, Rudolf MC, Dixey R, Hill AJ, Barth JH, Cade J. Evaluation
of implementation and effect of primary school based intervention to reduce risk factors for obesity. BMJ. 2001;323:1027-9. 11. Santa Catarina. Lei nº 12.061, de 18 de dezembro de 2001.
Dispõe sobre critérios de concessão de serviços de lanches e bebidas nas unidades educacionais, localizadas no Estado de Santa Catarina. Lex: Diário Oicial do Estado de Santa Catarina, p.1, 20 dez, 2001.
12. de Assis MA, Rolland-Cachera MF, Grosseman S, de Vasconcelos FA, Luna ME, Calvo MC, et al. Obesity, overweight and thinness
in schoolchildren of the city of Florianópolis, Southern Brazil.Eur J Clin Nutr. 2005;59:1015-21.
13. World Health Organization (WHO). Expert Committee on Physical status: the use and interpretation of anthropometry. Technical series report 854. Geneva: WHO; 1995.
14. Vasconcelos FA. Tendências históricas dos estudos dietéticos no Brasil. Hist Cienc Saude-Manguinhos. 2007;14:197-219. 15. Vasconcelos FA. Avaliação nutricional de coletividades. 4 ed.
Florianópolis: UFSC; 2007.
16. Philippi ST, Latterza AR, Cruz AT, Ribeiro LC. Pirâmide alimentar adaptada: guia para a escolha dos alimentos. Rev Nutr. 1999;12:65-80.
17. Martins C, Abreu SS. Pirâmide de Alimentos: manual do educador. Curitiba: Nutroclínica;1997.
18. CDC/NCHS (Center for Disease Control and Prevention / National Center for Health Statistics) 2000. Growth Charts for the United States: methods and development. Series report 11, no. 246.201. Atlanta, GA: CDC; 2000.
19. Gabriel CG, Santos MV, Vasconcelos FA. Avaliação de um programa para promoção de hábitos alimentares saudáveis em escolares de Florianópolis, Santa Catarina, Brasil. Rev Bras Saude Matern Infant. 2008;8:299-308.
20. Assis MA, Nahas MV. Aspectos motivacionais em programas de mudança de comportamento alimentar. Rev Nutr. 1999;12:33-41.
21. Kranz S, Findeis JL, Shrestha SS. Use of the Revised Children’s Diet Quality Index to assess preschooler’s diet quality, its
sociodemographic predictors, and its association with body weight status. J Pediatr (Rio J). 2008;84:26-34.
22. Muller MJ, Dnielzik S, Pust S. School and family-based interventions
to prevent overweight in children. Proc Nutr Soc. 2005; 4:249-54.
23. Ronderos MP, Solís VE. Modelo educativo nutricional para la reducción de factores de riesgo cardiovascular en niños escolares obesos. Rev Costarric Salud Publica. 2003;12:1-15.
24. Gaglianone CP, Taddei JA, Colugnati FA, Magalhães CG, Davanço GM, Macedo L, et al. Nutrition education in public elementary schools of São Paulo, Brazil: the Reducing Risks of Illness and Death in Adulthood project. Rev Nutr. 2006;19:309-20. 25. de Mello ED, Luft VC, Meyer F. Atendimento ambulatorial
individualizado versus programa de educação em grupo: qual oferece mais mudança de hábitos alimentares e de atividade física em crianças obesas? J Pediatr (Rio J). 2004;80:468-74. 26. Brasil. Ministério da Educação. Fundo Nacional de Desenvolvimento
da Educação (FNDE). Resolução nº 32, de 10/8/2006. Estabelece normas para a execução do Programa Nacional de Alimentação Escolar – PNAE. ftp://ftp.fnde.gov.br/web/resolucoes_2006/ res032_10082006.pdf . Access: 02/07/2008.
27. Perry CL, Bishop DB, Taylor GL, Dans M, Story M, Gray C, et al. A
randomized school trial of environmental strategies to encourage fruit and consumption among children. Health Educ Behav. 2004;31:65-76.
28. French AS, Stables G. Environmental interventions to promote vegetable and fruit consumption among youth in school settings.
Prev Med. 2003;57:593-610.
Correspondence:
Francisco de Assis Guedes de Vasconcelos
Departamento de Nutrição, Centro de Ciências da Saúde Universidade Federal de Santa Catarina
Campus Universitário Trindade
CEP 88040-900 - Florianópolis, SC - Brazil E-mail: fguedes@ccs.ufsc.br
and eating fried snacks increased, indicating the need for a longer-duration, continuous program and one with greater scope that reaches teachers, canteen workers and parents, in order that the effect will be more promising and effective.