Early Transcriptome Signatures from
Immunized Mouse Dendritic Cells Predict
Late Vaccine-Induced T-Cell Responses
Nicolas Dérian1,2,3, Bertrand Bellier1,2,3, Hang Phuong Pham1,3¤a, Eliza Tsitoura4¤b,
Dorothea Kazazi4, Christophe Huret1,3¤c, Penelope Mavromara4, David Klatzmann1,2,3
*, Adrien Six1,2,3*
1Sorbonne Universités, UPMC Univ Paris 06, UMRS 959, Immunology, Immunopathology, Immunotherapy, Paris, France,2AP-HP, Clinical Investigation Center in Biotherapy, Hôpital Pitié-Salpêtrière, Paris, France, 3INSERM, UMRS 959, "Immunology, Immunopathology, Immunotherapy", Paris, France,4Molecular Virology Laboratory, Hellenic Pasteur Institute, Athens, Greece
¤a Current address: ILTOO Pharma, iPEPS—ICM Hôpital Pitié Salpêtrière, 47/83 Boulevard de l’Hôpital, Paris France
¤b Current address: Laboratory of Molecular and Cellular Pneumonology, Medical School, University of Crete, Heraklion, Greece
¤c Current address: CNRS UMR7216 Epigenetics and Cell Fate, Université Paris Diderot, Sorbonne Paris Cité, Paris, France
*[email protected](DK);[email protected](AS)
Abstract
Systems biology offers promising approaches for identifying response-specific signatures to vaccination and assessing their predictive value. Here, we designed a modelling strategy aim-ing to predict the quality of late T-cell responses after vaccination from early transcriptome analysis of dendritic cells. Using standardized staining with tetramer, we first quantified anti-gen-specific T-cell expansion 5 to 10 days after vaccination with one of a set of 41 different vaccine vectors all expressing the same antigen. Hierarchical clustering of the responses defined sets of high and low T cell response inducers. We then compared these responses with the transcriptome of splenic dendritic cells obtained 6 hours after vaccination with the same vectors and produced arandom forestmodel capable of predicting the quality of the
later antigen-specific T-cell expansion. The model also successfully predicted vector classifi-cation as low or strong T-cell response inducers of a novel set of vaccine vectors, based on the early transcriptome results obtained from spleen dendritic cells, whole spleen and even peripheral blood mononuclear cells. Finally, our model developed with mouse datasets also accurately predicted vaccine efficacy from literature-mined human datasets.
Author Summary
Vaccines are designed to elicit effective immune responses against antigens. The various vector platforms used in vaccine development are diverse and complex, rendering the selection of promising vaccines vector challenging. We have designed a modeling strategy
OPEN ACCESS
Citation:Dérian N, Bellier B, Pham HP, Tsitoura E, Kazazi D, Huret C, et al. (2016) Early Transcriptome Signatures from Immunized Mouse Dendritic Cells Predict Late Vaccine-Induced T-Cell Responses. PLoS Comput Biol 12(3): e1004801. doi:10.1371/ journal.pcbi.1004801
Editor:Grégoire Altan-Bonnet, Memorial Sloan-Kettering Cancer Center, UNITED STATES
Received:May 22, 2015
Accepted:February 8, 2016
Published:March 21, 2016
Copyright:© 2016 Dérian et al. This is an open access article distributed under the terms of the
Creative Commons Attribution License, which permits unrestricted use, distribution, and reproduction in any medium, provided the original author and source are credited.
Data Availability Statement:Microarray data are available on GEO:http://www.ncbi.nlm.nih.gov/geo/ query/acc.cgi?token=ijejgwimldunhax&acc= GSE66991. Data are publicly available since July 1st, 2015.
that predicts the propensity of vaccine vectors to elicit strong late T-cell responses using transcriptome material obtained 6 hours after vaccination. Our model, designed with mouse datasets, also predicted vector efficacy from mined human data. Thus, molecular signatures obtained 6 hours after vaccination can predict vaccine efficacy at 2 weeks post vaccination, which should help in vaccine development.
Introduction
The development of vaccines against complex chronic diseases such as HIV or cancer has been largely unsuccessful so far. Novel vaccine technologies are rationally designed to generate appropriate protective immune responses [1], notably efficient T-cell responses. Such vaccine vectors include plasmid DNA, viral and bacterial vectors, and virus-like particles (VLPs). The intrinsic characteristics of these vectors, including their capacity to stimulate innate immunity and to activate and target the antigen to antigen-presenting cells, determine in large part their immunogenicity and thus their potency as vaccine or gene therapy vectors [2–4]. However the rational design of vectors is limited by various aspects, such as the partial understanding of the factors governing the induction of optimal immunity (i.e. the activation of the innate immune system by various vector components, the effect upon adaptive immunity. . .) or the possible
dependence of vector efficacy on the specificity of the target diseases.
Systems biology has been introduced in vaccine development to assist in circumventing these limitations and shorten the vaccine development process. Systems biology may not only help to better understand, analyze and reconstruct the complex immune interactions between the patho-gen/vaccine and host immune system, but may also improve thein silicotesting models for vaccine candidates. Systems biology approaches have proven capable to predict immune responses induced after vaccination [5,6]. For example, expression patterns of genes associated with the efficient pro-cessing of peptides for major histocompatibility complex presentation have been identified as use-ful surrogate markers of vaccine efficacy, obviating the need to perform challenge studies [7]. Signatures derived from antibody repertoire profiling on peptide microarrays during the natural course of influenza infection were shown to be predictive of the efficacy of influenza vaccines [8]. Multivariate analysis performed on human peripheral blood mononuclear cell (PBMC) microarray data, obtained 3 days after vaccination, identified innate immune response–related signatures that predicted the late adaptive immune response to the YF-17D yellow fever vaccine [9].
In this manuscript, we describe a methodology that enabled us to successfully predict the adaptive immune responses induced by large sets of vaccine vectors of different classes, ranging from infectious particles to VLPs and DNA. All these vectors expressed the same antigen, the immune response to which was measured using a validated standardized method. We devel-oped our model based on the analysis of transcriptomic data, obtained 6 hours after vaccina-tion, that could predict the antigen-specific immune responses induced at the peak of the response, 5–10 days later. It is noteworthy that this model, developed in mice, successfully pre-dicted vaccine-induced responses from literature-mined human datasets.
Results
Vaccine vector classification according to antigen-specific T-cell expansion
Forty-one vectors classified in 13 categories of vaccines and all expressing the same antigen were evaluated and compared for their ability to induce an adaptive T-cell immune response after vaccination (S1 Table). The forty-one vectors included (i) recombinant viral vectorsEarly Mouse Dendritic Cell Transcriptome Modelling Predicts Vaccine Efficacy
agence-nationale-recherche.fr). CH, ET and DKa were supported by the CompuVac consortium (www. compuvac.eu). PHP was supported by a doctoral fellowship from the Ministère de la Recherche et de la Technologie (http://www.enseignementsup-recherche. gouv.fr). The funders had no role in study design, data collection and analysis, decision to publish, or preparation of the manuscript.
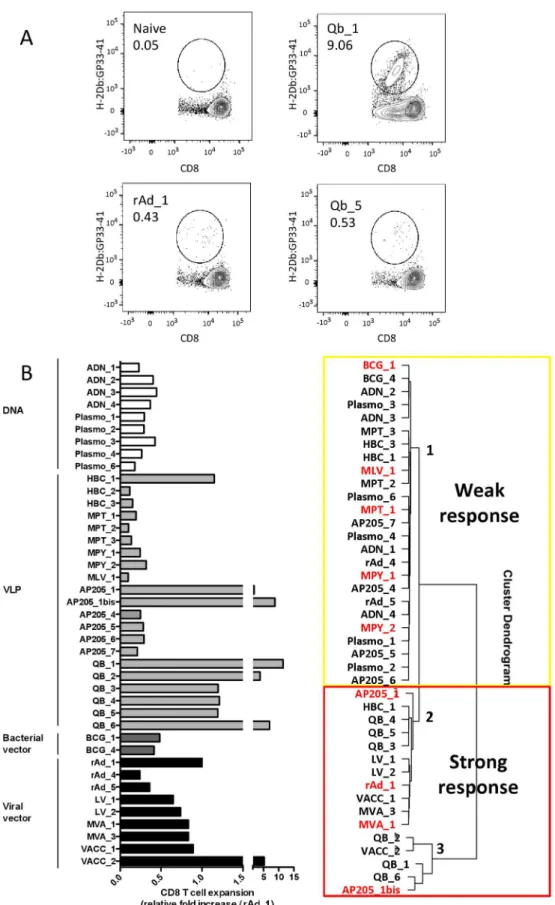
derived from adenovirus (rAd), vaccinia (VACC), modified vaccinia Ankara (MVA) and lenti-virus (LV), (ii) recombinant bacteria vectors derived from Bacille de Calmette et Guérin (BCG), (iii) recombinant VLPs made of the AP205 [10] or Qbeta (Qb) [11] proteins from bac-teriophage, the VP2 proteins from murine polyoma virus (MPY) [12] or murine pneumotropic virus (MPT), the Gag capsid proteins from murine leukaemia virus (MLV) [13], the core from hepatitis B virus (HBc), and (iv) plasmid encoding a recombinant protein (DNA) or recombi-nant MLV-VLPs (plasmoVLPs) [13,14]. Each vaccine platform was engineered to display or express the immunodominant LCMV gp33-41 epitope model antigen [15] in order to compare the different vaccine-induced CD8+ T-cell specific responses. In the framework of CompuVac (www.compuvac.eu), we standardized the method for measuring the gp33-41-specific T-cell response using tetramer staining (Fig 1A). Mice were immunized with each vector and we eval-uated the gp33-41-specific T-cell response in PBMCs at days 5, 7 and 10, following the fre-quency of circulating gp33-41/H-2Db tetramer+ CD8+ T cells. In each experiment we included control mice that were injected with PBS or rAd (rAd_1 batch) to provide negative and positive controls. Data for each experimental group were normalized as the experimental to rAd vector response ratio allowing cross-laboratory data comparisons.
We observed a wide range of immune responses that were triggered by the different vectors. The maximal CD8+ T-cell expansion was induced with bacteriophage-derived VLPs, while very low but significant responses were observed with MPT and HBc VLPs (Fig 1B). Interestingly, dif-ferent vector designs within the same vector platform led to difdif-ferent responses. As an example, Qb-derived VLPs induced variable CD8+ T-cell expansion depending on their production pro-cesses that were designed to modify their TLR-ligand composition (i.e. Qb_5 devoid of viral RNA and CpG in contrast to Qb_1;Fig 1A). We took into consideration all the vectors and per-formed hierarchical clustering on normalized values that defined 3 clusters (C). The first cluster comprised vectors with low ratio values, characterizing weak inducers of antigen-specific T cells, hereafter referred as“Weak”vectors. The other 2 clusters included vectors inducing high or intermediate responses, defining the“Strong”vector class. This class comprised the different recombinant viral vectors (rAd, MVA, VACC, LV) expressing rather than displaying the antigen, and which have been extensively developed as CD8+ T-cell vaccines [16–18]. It also contained bacteriophage-adjuvanted VLPs, in agreement with previous reports [10,19].
Modelling strategy
As dendritic cell activation is key to the initiation of immune responses, we investigated whether transcriptome data from sorted spleen dendritic cells (DCs) sampled 6 hours after immunization could be predictive of the antigen-specific T-cell response measured several days later, at the peak of the response. To address this question, we devised a stepwise model-ling scheme. DC-sorted transcriptome datasets were initially produced for 19 vectors on the Codelink platform, corresponding to 7 different vaccine platforms, for which the antigen-spe-cific T-cell response was also measured (S1 Table).
ICA is an unsupervised algorithm extracting independent componentsYfrom original data-setsXby searching for the demixing matrixW:
Y ¼XW
Wmatrix is calculated by maximizing the non gaussianity of the components measured as the negentropyJ:
JðyÞ ¼HðyGaussÞ HðyÞ;
whereH(y) andH(yGauss) are the Shannon entropy for a vectoryand a random Gaussian vec-tor with same variance asy[21].
The use of ICA to analyze microarray data is justified by the hypothesis thatXis a mix of signals from underlying cellular pathways. Therefore, columns ofYcontain a summary of gene contributions in the extracted components. The RNA expression value of a gene is thus the superposition of several signals of this gene in each component which add up. From each com-ponenty, two reduced gene sets can be extracted by selecting genes with critical contribution on both sides of the distribution [22].
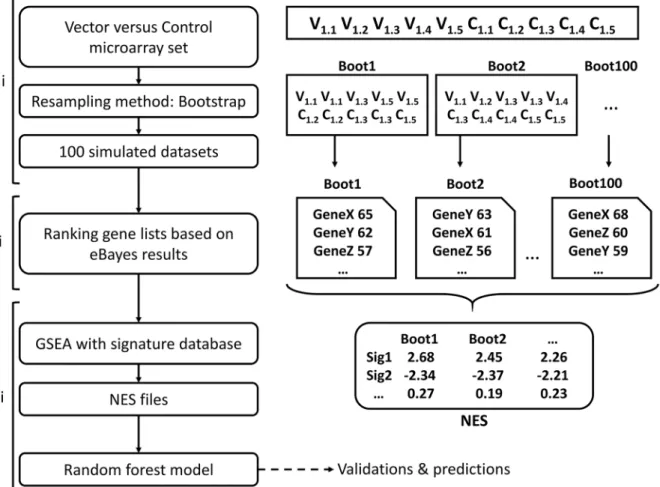
We first performed ICA on the 19 available datasets, yielding 210 molecular signatures char-acterizing the variability within each dataset, and likely linked to vector properties. We then analyzed the differential gene expression between the controls and the tested vectors using bootstrapping [23,24], in order to increase the model’s sensitivity. Bootstrapping consists in sampling series of additional datasets by randomly drawing samples with replacement of equal size from an original dataset, as described inFig 2. We sampled 100 consecutive bootstrapped datasets from each of the 19 original datasets and generated 100 corresponding ranking lists of genes based on modified t-test statistics. The previously identified signatures were then tested for their behavior vis-à-vis the gene lists using GSEA, generating normalized enrichment scores (NES). Molecular signatures from GSEA software (>5000) were added at this step in order to
increase the efficiency of the normalization procedure. NES of molecular signatures from ICA were then extracted for the next steps. This yielded a matrix, containing 1900 columns (100 bootstrapped datasets for each of the 19 original datasets) and 210 lines (the number of calcu-lated NES). This matrix was then used to create random forest (RF) classification models (Fig 2). NES values and T-cell response classification were used as predictors and dependent vari-ables, respectively, in the randomForest package, which as output provides classification results and associated probabilities for each T-cell response class.
Model stability and confidence
An initial predictive model was built with 9 vector datasets (in red inFig 1B) for which the anti-gen-specific T-cell responses were available (900 bootstrapped datasets and 100 signatures). Predictions of 10 additional datasets, including independent experiments done with the same or different batches of these vectors, were very consistent (see Tables1andS2). The model sen-sitivity for the“Weak”and“Strong”vector classes (respectively equal to the specificity for the
“Strong”and“Weak”classes) are 0.89 and 0.98, respectively. The positive predictive value
responses were evaluated at days 5, 7 and 10 in groups of 3–5 vaccinated mice. The normalized“CD8 T-cell expansion”value was calculated as the average of the peak response for each mouse against the value obtained for the internal standard experimental group (rAd_1). C. Hierarchical clustering (Euclidean/Ward. D2) performed on normalized T-cell response values defined as“Weak”(cluster 1) and“Strong”(clusters 2 and 3) vectors. Vectors in red were used to build the initial prediction model (see Model stability and confidence in theResultssection).
(PPV) is stable for the two classes (“Weak”: 0.96,“Strong”: 0.93). This 9-vector model is already efficient to classify the vector platform with 0.94 accuracy. These results led us to construct the final predictive model (called RFM model) including all the 19 datasets, based on the analysis of the 210 signatures across the 1900 bootstrapped datasets. This complete training set con-tained enough information to discriminate clearly between the 2 vector classes, as demon-strated by the misclassification rate parameter reaching zero after 100 simulated trees.
The RandomForest algorithm provides a ranked list of the signatures based on their impor-tance to the efficacy of the classification in the model. This score is based on the decrease of the Gini impurity criterion for each child node of a split. The result of this calculus is the mean of this decrease for each signature present in the trees of the forest. 27 most important signatures, having a mean decrease score higher than ten, were selected. Clustering methods were then
Fig 2. Modelling strategy.(i) For each pre-processed dataset, composed of microarray measures for mice injected with vector 1 (V1.1, V1.2. . .) and control (C1.1, C1.2. . .), one hundred datasets were created by bootstrapping samples among V and C. (ii) Ranked gene lists, according to the eBayes statistical comparison of vector and control conditions, were generated. (iii) Potential signatures were tested for enrichment on each of the 100 ranked gene lists by GSEA. The resulting NES matrix was then used to build the random forest model.
doi:10.1371/journal.pcbi.1004801.g002
Table 1. Model’s sensitivity and accuracy.
Model Sensitivity Strong (Specificity Weak)
Sensitivity Weak (Specificity Strong)
PPV Strong (NPV Weak)
PPV Weak (NPV Strong)
Accuracy
9-vector 0.98 0.89 0.93 0.96 0.94
RFM 1 0.97 0.96 1 0.98
doi:10.1371/journal.pcbi.1004801.t001
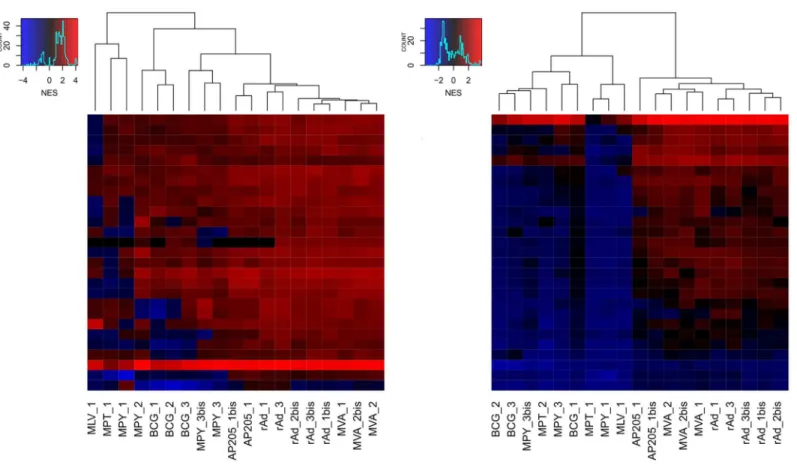
applied (i) on NES values of these 27 signatures calculated on original datasets (Fig 3A) and (ii) on the mean NES values calculated on the bootstrapped datasets (Fig 3B). The interest of boot-strap is clearly revealed with clusters more explicitly defined after bootboot-strap.
We then asked whether RFM was biased toward particular vector datasets. We first used the leave-one-out methodology, where 19 models were iteratively built using only 18 out of 19 datasets, and then assessing how accurately such models predict the 100 bootstraps from the left-out dataset. All vectors were classified as expected for at least 96 of the 100 bootstrapped datasets, except MPY_3 for which 16 bootstrapped datasets were misclassified (S3 Table). This result shows overall very high prediction stability and no significant bias of the RFM model.
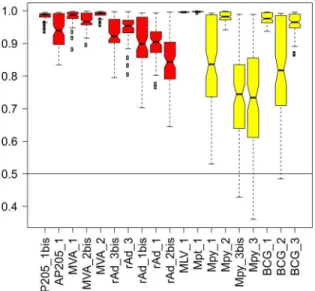
We verified that RFM was not biased for a given vector platform. One hundred new models were constructed, each based on one randomly selected representative of the 7 vector platforms (rAd, AP205, MVA, MPY, MPT, MLV and BCG). For each vector, the probabilities to be clas-sified as expected were calculated and the prediction distribution across the 100 models is shown inFig 4. Vaccines from the“Strong”vector class (in red) showed good consistency in their prediction distribution, with no value under 0.6 (100% confidence). Vaccines from the
“Weak”vector class showed more variability: in particular, 2 MPY vaccines (MPY_3 &
MPY_3bis; same vector batch (#3) used in 2 independent experiments) were not classified as expected in 16 models out of 100 (84% confidence); these 16 misclassifying models all used MPY_2 as the MPY representative. Note that this specific preparation (#2) of MPY vaccine was produced using baculovirus machinery in insect-derived cells, while the other MPYs were produced in yeast.
Fig 3. Hierarchical clustering (distance method: Euclidean; agglomeration method: Complete) of NES values of the 27 selected signatures, provided by the RFM model, on original vector datasets (A) and of mean NES values calculated on bootstrapped datasets (B).
Model validation with novel vectors
RFM was then used to predict the vector class of 4 new vectors belonging to 3 vector platforms: 2 batches of lentivirus (LV) vectors -a category of vaccine not represented during the model establishment, one new batch of AP205 (AP205_3) and one of MLV (MLV_2). We had inde-pendently determined that LV vectors induced strong antigen-specific T-cell responses after immunization and were classified in the“Strong”vector class (Fig 1). As shown in Tables1
and2A, these 4 bootstrapped datasets were classified as expected with high precision (>95%)
while sensitivity and PPV of the model increased compared to the 9-vector model, especially the sensitivity for the“Weak”vector class now reaching 0.97 (from 0.89) with RFM. These results highlight that RFM (i) is not vaccine platform-dependent, (ii) correctly predicts a vector platform unknown to the model, and (iii) efficiently predicts both“Weak”and“Strong” vectors.
Model prediction of whole spleen and PBMC data
RFM was built on transcriptome data obtained from sorted spleen DCs. In our next experi-ment, we assessed whether RFM would be sensitive enough to classify transcriptome datasets derived from whole spleen samples obtained 6 hours after immunization, where DCs represent 1–2% of total splenocytes. As summarized inTable 2B, all bootstrapped datasets from whole spleens were well classified, with at least 91% of the expected classification, thus demonstrating our model’s sensitivity in classifying vectors in whole spleen transcriptome datasets.
We then tested microarray datasets for whole spleen samples obtained 6, 48 and 72 hours after vaccination with one vector, the rAd vector that we used as a standard. Strikingly, only datasets sampled 6 hours after injection were classified as expected (as“Strong”) (Table 2D).
Similarly, we tested the performance of our model in classifying vectors using PBMC-derived microarray datasets. The rationale for this experiment is that PBMCs, less than 1% of which are DCs, offer a more accessible sample source than spleen, especially in humans. As
Fig 4. Vector prediction confidence.One hundred different models were created using one representative of each vector platform. The probabilities for a vector being classified as expected were calculated for its 100 bootstrapped datasets and averaged as a vector mean probability. Vector mean probabilities are displayed as boxplots. A value of 1 means that the bootstrapped dataset was successfully predicted 100 times over the 100 models.“Strong”and“Weak”vectors are colored red and yellow, respectively.
doi:10.1371/journal.pcbi.1004801.g004
shown inTable 2C, all but one vectors were classified as expected with high precision (90%). AP205_1 was classified as expected, though with less confidence (73%).
Model prediction of human PBMC data
Finally, we tested whether our model could classify datasets obtained from the literature. We found datasets from the Merck Ad5/HIV trial reported by Zak et al. [25] PBMC transcriptome data were generated from samples obtained at 6, 24 and 72 hours after vaccination. We boot-strapped the samples of Zak et al., taking patient-paired samples before and after vaccination. 100% and 91% of the bootstrapped paired samples were predicted as“Strong”at 24 and 72 hours, respectively (Table 3), in line with the authors’original observations. The same analysis
Table 2. Vector class prediction efficiency.
RFM model predictions*
Vectors Material Strong Weak
LV_1 DC 100 0
LV_2 DC 100 0
A AP205_3 DC 3 97
MLV_2 DC 5 95
AP205_1 Spleen 99 1
MVA_1 Spleen 100 0
B rAd_1 Spleen 98 2
MLV_1 Spleen 9 91
MPT_1 Spleen 0 100
AP205_1 PBMC 73 27
MVA_1 PBMC 90 10
Qb_1 PBMC 99 1
Qb_2 PBMC 95 5
C Qb_3 PBMC 100 0
Qb_4 PBMC 100 0
Qb_5 PBMC 98 2
MLV_1 PBMC 0 100
MPT_1 PBMC 0 100
rAd_1_6 Spleen 98 2
D rAd_1_48 Spleen 0 100
rAd_1_72 Spleen 2 98
*Number of the 100 bootstrapped datasets predicted as“Strong”or“Weak”.
doi:10.1371/journal.pcbi.1004801.t002
Table 3. Predictions of human PBMC transcriptome data derived 6, 24 and 72 hours after vaccination by MRKAd5/HIV published in [25].
RFM model predictions*
Time point Material Strong Weak
6 h PBMCs 31 69
24 h PBMCs 100 0
72 h PBMCs 91 9
*Number of the 100 bootstrapped datasets predicted as“Strong”or“Weak”.
performed with the 6-hour time point gave a“Strong”prediction for 31% of the bootstrapped paired samples. The latter finding is consistent with the conclusion of Zak et al. that transcrip-tomic modifications at 6 hours were not significant. These results demonstrate the capacity of RFM generated from mouse DC transcriptome datasets to classify human PBMC datasets.
Biological insight
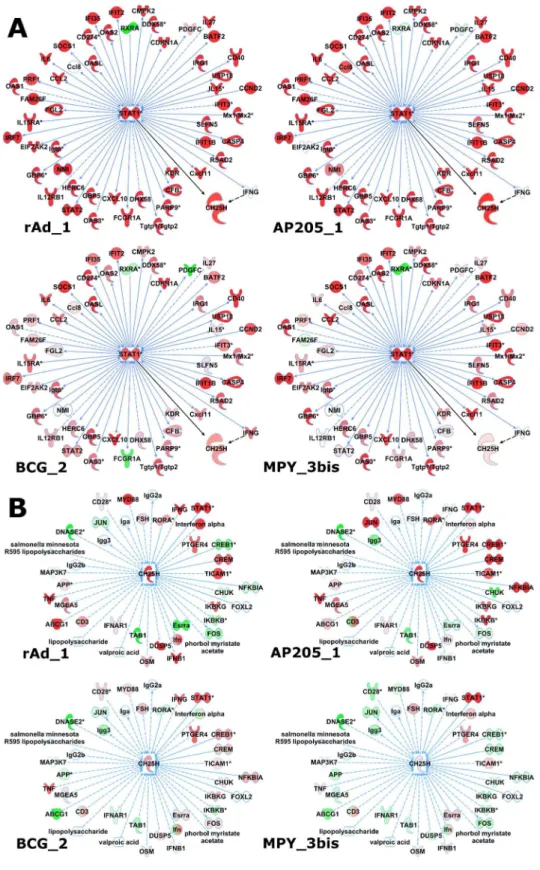
Biological annotation of the 27 most important signatures of RFM reveals one signature (Sig1) with statistical functional enrichments related to immune processes (FDR p-values 10−4
–10−8). This signature is highly focused on STAT-1 with 51 genes having strong biological connections (Fig 5A). Interestingly, Sig1 is upregulated in all the vectors, but with higher intensity in the
“Strong”as compared to the“Weak”vectors.
No specific molecular pathway was clearly identified by QIAGEN’s Ingenuity Pathway Analysis (IPA) functional analysis for the other 26 important signatures in our model. How-ever, visual inspection of these signatures identified the CH25H gene as highly modulated by strong vectors. Since this gene has been recently described as playing a role in DC maturation [26], we analyzed its network of connected genes with IPA (Fig 5B). This network was also globally more modulated by“Strong”rather than“Weak”vectors, and comprised genes impli-cated in DC function such as MYD88, DUSP5 and ABCG1.
Discussion
Understanding and predicting innate immune response to vector platforms is primordial for fast and effective production of new vaccination or gene therapy protocols. Systems biology tools efficiently extract information from large datasets in computing predictive models and have already played a major role in recent discoveries in this field [5,27]. In this paper, we ini-tially focused on early transcriptomic changes of DCs since these are first-line players in the innate immune response and directly contribute to the triggering of the adaptive response. Our aim was to identify transcriptomic signatures predictive of the late CD8+ CTL responses to the LCMV gp33-41 model antigen conveyed by a variety of vaccine vectors.
Based on molecular signatures extracted using the non-supervised ICA method [20,22], we produced and validated a prediction model taking into account 19 available datasets generated with different vector platforms. We chose the random forest learning algorithm for its reported efficiency among classification methodologies [28–30]. The originality of our strategy was the use of signatures rather than genes to classify samples. Our results showed that this model con-sistently predicts both“Weak”and“Strong”vectors, with greater confidence for the latter. This suggests that there are shared gene expression modifications induced by“Strong”vectors, while changes induced by“Weak”vectors are more diverse. Consistent with this, Li et al. recently reported that different types of vaccine lead to different transcriptomic modifications in humans 3 days after vaccination [31], with vaccines inducing high transcriptomic modifica-tions being those that induce robust antibody responses.
Among the 27 signatures selected for their importance in the RFM model, one (Sig1; seeS4 Table) is related to immune components, including“viral infection”,“role of RIG1-like recep-tors in antiviral innate immunity”and“interferon signalling”pathways. Previous studies have characterized gene expression modifications in the early stages of vaccination consistent with Sig1 annotation. Querec et al. investigated the transcriptome of patient PBMCs at days 0, 1, 3, 7 and 10 after vaccination with yellow fever vaccine [9]. Of 65 regulated genes, 26 were related in part to interferon and the antiviral response, including MX1, IFIT1, IFIT2, IFIT3, OAS1, OAS2, OAS3 and OASL, and 7 were related to signal transduction, including STAT1 and IRF7. Similarly, Zak et al. [25] applied the modular transcriptome analysis framework described in
Chaussabel et al. [32] to study the innate immune response to MRKAd5/HIV in PBMCs 6, 24, 72 and 168 hours after patient vaccination. They identified genes highly regulated at 6 and 24 hours, including STAT1, STAT2, IFITs, MXs and OASs (also identified in Querec et al.). Strik-ingly, all these genes are also part of Sig1, emphasizing further their key role in the early response to the vaccine. Furthermore, DDX60, a newly described antiviral factor that induces Rig-1-like receptor-mediated signaling [33], present in Sig1, was reported by Querec et al. as well [9]. Interestingly, Sig1 is upregulated in vaccinated samples compared to control group, but to a lesser extent in“Weak”vs.“Strong”vectors (see Figs3and5).
Our cross-analysis of Zak et al.’s microarray data on Merck Ad5/HIV-vaccinated human PBMC samples, which yield good predictions for the 24- and 72-hour time points, demon-strates that our prediction model, solely based on mouse DC-sorted transcriptome data, effi-ciently predicts human transcriptome data. This can be explained by the high similarity of gene expression in immunological cell lineages between mice and humans [34], although the kinet-ics of the immune response to vaccine is different.
No specific molecular pathway was clearly identified by IPA annotations for the other 26 important signatures in our model. This is somewhat surprising since these signatures have been selected by the model to best distinguish“Strong”and“Weak”vectors and are therefore expected to represent differentially regulated biological pathways. In this line, none of the 27 signatures corresponds to a peculiar behavior of a vector but they rather reveal similar behavior within“Strong”or“Weak”groups (Fig 3). Moreover, the identified signatures were extracted from 13 out of 19 different vector datasets (9“Strong”and 4“Weak”vectors). We believe that these signatures are unlikely artifactual but related to yet undefined biological processes. Indeed, the constant improvement of annotation databases can reveal secondary or additional functions of genes. For example, CH25H, a gene found in one of the 26 signatures and clearly upregulated in“Strong”vectors, is primarily involved in cholesterol metabolism, but has recently been shown to play a role in the early stage of DC maturation [26].Fig 5shows how the expression of this gene is related to dendritic cell through direct or indirect interactions with STAT-1 or IFNγ, both members of Sig1, and with several genes known to be important in early dendritic cell activation: for example, MYD88 is a gene involved in toll-like receptor sig-naling [35], DUSP5 is known to be upregulated during dendritic cell maturation [36], and ABCG1 is a gene playing a role in adaptive immune responses [37]. The comparative analysis of gene expression modulation of this interaction network shown inFig 5reveals a similar pat-tern of differential expression for“Strong”vectors (rAd_1, AP205_1) different than that observed for“Weak”vector datasets (BCG_2, MPY_3bis). This again points at a significant dif-ference in early dendritic cell activation-related gene behavior in“Strong”vs.“Weak”vectors.
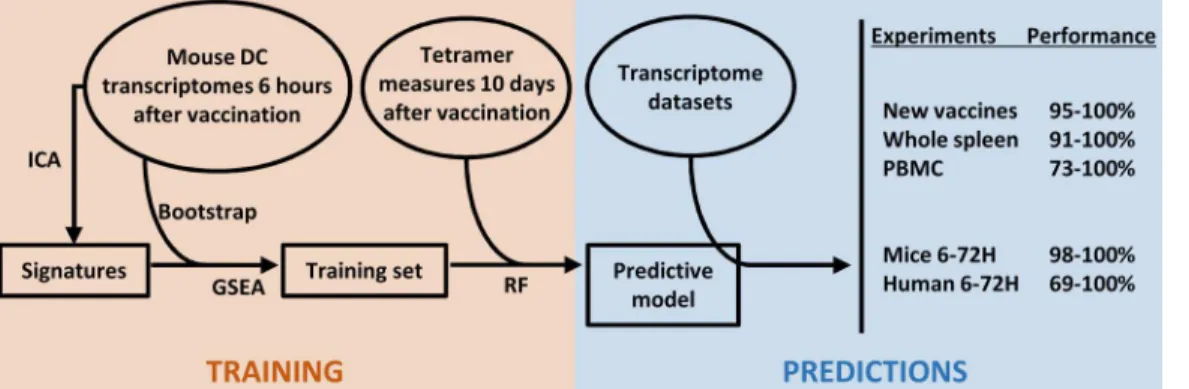
Altogether, our results underline the relevance of the CompuVac initiative that consisted in producing, in a standardized manner, immunological and transcriptome data related to vac-cine candidates in order to predict their capacity to elicit strong antigen-specific responses. Our model was based on transcriptome data from sorted spleen DCs of mice vaccinated with various“Strong”and“Weak”T-cell inducer vectors. This prediction model accurately pre-dicted the behavior of these and other candidate vaccines only 6 hours after injection. The model was powerful enough to produce a relevant vector classification even when using whole mouse spleen and PBMCs, or even human PBMCs (Fig 6), and across 3 microarray platforms (CodeLink, Illumina and Affymetrix). The accuracy and sensitivity of the model are likely high because it is built with very different vaccine platforms therefore representative of possible
analyses (red: upregulated, green: downregulated) performed on rAd_1, AP205_1, MPY_3bis and BCG_2 vector datasets; color intensities were set to be in the same range in all experiments.
doi:10.1371/journal.pcbi.1004801.g005
vector behaviors in triggering the early immune response. This study further supports the potential of systems immunology approaches in facilitating the development and characteriza-tion of vaccines, offering robustin silicosolutions to study the early events of the immune response to vaccines.
Material and Methods
Ethics statement
Experimental protocols complied with French law (Décret: 2001–464 29/05/01) and EEC regu-lations (86/609/CEE) for the care and use of laboratory animals and were carried out under Authorization for Experimentation on Laboratory Animals Number 75-673-R. Our animal protocol (Ce5/2009/042) was approved by the“Charles Darwin”Ethics Committee for Animal Experimentation (CNREEA 05) and performed in the licensed animal facility A75-13-08.
Vector platforms
Recombinant adenovirus- and MVA-derived viral vectors, BCG-derived bacterial vector, AP205 [10] or Qb [11] bacteriophage-, MPT- and MPY- [12] or MLV-derived [13] VLPs used as an antigenic platform and DNA vaccines were included in this study. According to the Com-puVac evaluation scheme, each vaccine platform was engineered to display / express the LCMV gp33-41 model antigen [15] in order to measure the vaccine-induced T-cell specific responses and dendritic cell transcriptome changes (see following sections). The sequence IIT-SIKAVYNFATCGILAL corresponding to the GP33-41 epitope flanked upstream and down-stream by 5 of its natively neighboring amino acids was used. The 53 vectors considered in this paper (S1 Table) are displayed in 13 vector platforms 7 of which were used for a training set (rAd, MVA, AP205, MPT, MPY, MLV and BCG) and 2 for prediction of new platforms (LV and Qb).
Evaluation of antigen-specific T-cell responses
Groups of three to five 7-week-old female C57BL/6 mice (Charles River, France and Germany) were immunized with a controlled quantity of vector particles as defined in CompuVac assay protocols (www.compuvac.eu). For monitoring T-cell responses, each vector was injected with
its“best”route of administration: subcutaneously for VLP vectors; intramuscularly for
recom-binant antigen-expressing vectors and by intra-dermally by gene gun for DNA vaccines. Con-trol mice were injected with 100μL of phosphate buffered saline solution (PBS). For each
Fig 6. Strategy followed in this study for a high-performance predictive model of transcriptome datasets obtained from new vector platforms, cells from whole organs (spleen, blood).RF: random forest.
vector (n = 41), the T-cell immune response measurement was performed independently one to three times. T-cell immune responses induced against the LCMV gp33-41 model antigen were measured by MHC-I gp33-41/H-2Db tetramer (ProImmune, UK) staining of PBMCs at 5, 7 and 10 days after injection. The highest measure was kept for each mouse and the mean value was then calculated for the group. Values were normalized against measures monitored in parallel in mice immunized with the rAd_1 control vector.
Microarray data
Experimental groups comprised of 3 to 6 mice immunized with vaccine candidates by the intravenous route. Mice were sacrificed 6 hours after immunization. Spleen DCs were purified with CD11c+-conjugated MACS magnetic beads (Miltenyi Biotec) according to the manufac-turer's instructions. After incubation for 20 minutes at 4°C, cells were washed and passed over a MACS column. Purity was checked routinely by FACS and found to be greater than 96±2%. 2x10⁶CD11c+ cells were used for total RNA extraction using Nucleospin RNAII (Macherey Nagel). For test dataset generation, whole PBMCs and/or whole splenocytes and/or sorted spleen DCs were collected at 6 hours, and at 48- and 72-hour time points for the kinetic follow-up. RNA was checked for quality using gel electrophoresis and for quantity using a Nanodrop spectrophotometer (Thermo Scientific). Microarrays were performed using either Applied Microarrays (CodeLink Mouse Whole Genome Bioarray) or Illumina (WG6 Mouse BeadAr-ray) technologies (S1 Table). The MessageAmp II aRNA Amplification Kit (Ambion) was used for cDNA and cRNA production from 1μg of total RNA. 10μg of amplified cRNA was subse-quently fragmented and hybridized for 20 hours using the Applied Microarrays hybridization and washing buffer kit. Slides were scanned using the GenePix Personal 4100A scanner for CodeLink array or the Illumina BeadArray 500GX Reader for Illumina array. Hybridization and raw data extraction were performed using either GenePix Pro 6.0 (for CodeLink array) or BeadStudio (for Illumina array) software, respectively (GEO accession GSE66991).
Each tested vector dataset comprised“vector-immunized”and corresponding PBS control samples. Quantile normalization was performed with the limma package [38] on R software [39], and then a log2 transformation was applied. Probes with a detection p-value above 0.05 in all samples in a dataset were discarded.
Signature database and enrichment analysis
Following our two-step ICA!GSEA signature discovery strategy [20], signatures were extracted using the fastICA algorithm R package [40] following modifications in [22]. Parame-ters were set as default, except for the unmixing matrix A-1convergence threshold set to 10-6. Ranked gene lists were calculated using the limma modified t-test. ES were calculated using GSEA [41] with the pre-ranked gene list protocol. Normalized ES are then calculated based on the permutation performed on gene sets collection, allowing comparison between experiments. The ICA-extracted signature database was complemented with the MsigDB C2 (curated gene sets of biological pathways) and C5 (Gene Ontology gene sets) databases (www.broad.mit.edu/ gsea) in order to increase universe of genes available for permutation of gene sets. Signatures with fewer than 7 detected genes were ignored.
Random forest classification and validation
For each model produced in the Results section, classification was performed on a matrix of fastICA extracted signature NES values (see above section) calculated for bootstrapped vector datasets (100 bootstraps per vector dataset), using the random forest algorithm implemented in the randomForest R package to produce a forest of 2000 trees [42]. The number of randomly
selected signatures used at each of the 2000 runs was set according to themtryfunction imple-mented in the randomForest package. The class prediction of the new dataset was deduced by the probability to be“Weak”or“Strong”>0.5. The overall vector class was then obtained as
the majority of“Weak”or“Strong”class assignments over the 100 bootstraps.
For classification model validation, we implemented the leave-one-out methodology con-sisting in creating models with n-1 datasets, where n is the total number of datasets, and classi-fying the dataset left out. In addition, we implemented a“multi-model”methodology based on the classification of bootstrapped datasets over 100 models created as above. Each model was computed on an NES matrix of a random selection of one representative vector dataset of each of the 7 represented vector platforms (seeVector platformssection andS1 Table). Vector mean probabilities were calculated as the average probability of being“Weak”or“Strong”over the 100 bootstrapped vector datasets, and their distribution over the 100 models was analyzed.
Signature annotation
For biological insight evaluation of the signatures, microarray data were analyzed through the use of QIAGEN’s Ingenuity Pathway Analysis (IPA, QIAGEN Redwood City,www.qiagen. com/ingenuity).
Supporting Information
S1 Table. List of studied vectors.(PDF)
S2 Table. Classification of vectors based on the 9-vector model.
(PDF)
S3 Table. Predictions of dendritic cell transcriptome data derived from mice vaccinated with different vectors in the leave-one-out validation step.
(PDF)
S4 Table. List of genes in Sig1.
(PDF)
Acknowledgments
We thank Bruno Gouritin and Fabien Pitoiset for sample preparation, Wassila Carpentier for microarray datasets generated on the P3S platform (Groupe Hospitalier Pitié-Salpétrière, Paris), and Wahiba Chaara and Ioannis Drakos for proofreading. The authors wish to thank all the CompuVac consortium members (www.compuvac.eu).
Author Contributions
Conceived and designed the experiments: ND BB PHP DKl AS. Performed the experiments: ND AS. Analyzed the data: ND BB DKl AS. Contributed reagents/materials/analysis tools: CH BB PM ET DKa. Wrote the paper: ND BB DKl AS.
References
1. Nabel GJ, Fauci AS. Induction of unnatural immunity: prospects for a broadly protective universal influ-enza vaccine. Nat Med. 2010 Dec; 16(12):1389–91. doi:10.1038/nm1210-1389PMID:21135852
3. Douek DC, Nabel GJ. Vaccines. Immunol Rev. 2011 Jan; 239(1):5–7. doi:10.1111/j.1600-065X.2010. 00986.xPMID:21198661
4. Bellier B, Six A, Thomas-Vaslin V, Klatzmann D. Predicting immune responses to viral vectors and transgenes in gene therapy and vaccination: the coming of systems biology. In: The Clinibook: Clinical gene transfert state of art. EDK, groupe EDP Sciences, Paris. Cohen-Haguenauer, O.;
5. Nakaya HI, Pulendran B. Systems vaccinology: its promise and challenge for HIV vaccine develop-ment. Curr Opin HIV AIDS. 2012 Jan; 7(1):24–31. doi:10.1097/COH.0b013e32834dc37bPMID: 22156839
6. Mooney M, McWeeney S, Sékaly R- P. Systems immunogenetics of vaccines. Semin Immunol. 2013 Apr; 25(2):124–9. doi:10.1016/j.smim.2013.06.003PMID:23886894
7. Vahey MT, Wang Z, Kester KE, Cummings J, Heppner DG Jr, Nau ME, et al. Expression of genes asso-ciated with immunoproteasome processing of major histocompatibility complex peptides is indicative of protection with adjuvanted RTS,S malaria vaccine. J Infect Dis. 2010 Feb 15; 201(4):580–9. doi:10. 1086/650310PMID:20078211
8. Legutki JB, Johnston SA. Immunosignatures can predict vaccine efficacy. Proc Natl Acad Sci USA. 2013 Nov 12; 110(46):18614–9. doi:10.1073/pnas.1309390110PMID:24167296
9. Querec TD, Akondy RS, Lee EK, Cao W, Nakaya HI, Teuwen D, et al. Systems biology approach pre-dicts immunogenicity of the yellow fever vaccine in humans. Nat Immunol. 2009 Jan; 10(1):116–25. doi:10.1038/ni.1688PMID:19029902
10. Tissot AC, Renhofa R, Schmitz N, Cielens I, Meijerink E, Ose V, et al. Versatile virus-like particle carrier for epitope based vaccines. PLoS ONE. 2010; 5(3):e9809. doi:10.1371/journal.pone.0009809PMID: 20352110
11. Maurer P, Jennings GT, Willers J, Rohner F, Lindman Y, Roubicek K, et al. A therapeutic vaccine for nicotine dependence: preclinical efficacy, and Phase I safety and immunogenicity. Eur J Immunol. 2005 Jul; 35(7):2031–40. PMID:15971275
12. Franzén AV, Tegerstedt K, Holländerova D, Forstová J, Ramqvist T, Dalianis T. Murine polyomavirus-VP1 virus-like particles immunize against some polyomavirus-induced tumours. In Vivo. 2005 Apr; 19 (2):323–6. PMID:15796193
13. Bellier B, Dalba C, Clerc B, Desjardins D, Drury R, Cosset F-L, et al. DNA vaccines encoding retrovirus-based virus-like particles induce efficient immune responses without adjuvant. Vaccine. 2006 Mar 24; 24(14):2643–55. PMID:16481074
14. Bellier B, Huret C, Miyalou M, Desjardins D, Frenkiel M- P, Despres P, et al. DNA vaccines expressing retrovirus-like particles are efficient immunogens to induce neutralizing antibodies. Vaccine. 2009 Sep 25; 27(42):5772–80. doi:10.1016/j.vaccine.2009.07.059PMID:19656495
15. Gallimore A, Glithero A, Godkin A, Tissot AC, Plückthun A, Elliott T, et al. Induction and exhaustion of lymphocytic choriomeningitis virus-specific cytotoxic T lymphocytes visualized using soluble tetrameric major histocompatibility complex class I-peptide complexes. J Exp Med. 1998 May 4; 187(9):1383–93. PMID:9565631
16. Shiver JW, Fu T-M, Chen L, Casimiro DR, Davies M-E, Evans RK, et al. Replication-incompetent ade-noviral vaccine vector elicits effective anti-immunodeficiency-virus immunity. Nature. 2002 Jan 17; 415 (6869):331–5. PMID:11797011
17. Tatsis N, Lin S-W, Harris-McCoy K, Garber DA, Feinberg MB, Ertl HCJ. Multiple immunizations with adenovirus and MVA vectors improve CD8+ T cell functionality and mucosal homing. Virology. 2007 Oct 10; 367(1):156–67. PMID:17590405
18. Di Nunzio F, Félix T, Arhel NJ, Nisole S, Charneau P, Beignon A-S. HIV-derived vectors for therapy and vaccination against HIV. Vaccine. 2012 Mar 28; 30(15):2499–509. doi:10.1016/j.vaccine.2012.01. 089PMID:22342915
19. Bessa J, Schmitz N, Hinton HJ, Schwarz K, Jegerlehner A, Bachmann MF. Efficient induction of muco-sal and systemic immune responses by virus-like particles administered intranamuco-sally: implications for vaccine design. Eur J Immunol. 2008 Jan; 38(1):114–26. PMID:18081037
20. Pham HP, Dérian N, Chaara W, Bellier B, Klatzmann D, Six A. A novel strategy for molecular signature discovery based on independent component analysis. Int J Data Min Bioinform. 2014; 9(3):277. PMID: 25163169
21. Kong W, Vanderburg C, Gunshin H, Rogers J, Huang X. A review of independent component analysis application to microarray gene expression data. BioTechniques. 2008 Nov; 45(5):501–20. doi:10. 2144/000112950PMID:19007336
22. Chiappetta P, Roubaud MC, Torrésani B. Blind source separation and the analysis of microarray data. J Comput Biol. 2004; 11(6):1090–109. PMID:15662200
23. Efron B. Bootstrap Methods: Another Look at the Jackknife. Ann Stat. 1979 Jan; 7(1):1–26.
24. Singh S, Sedory SA. Sufficient bootstrapping. Comput Stat Data An. 2011 Apr; 55(4):1629–37. 25. Zak DE, Andersen-Nissen E, Peterson ER, Sato A, Hamilton MK, Borgerding J, et al. Merck Ad5/HIV
induces broad innate immune activation that predicts CD8+ T-cell responses but is attenuated by pre-existing Ad5 immunity. Proc Natl Acad Sci USA. 2012; 109(50):E3503–12. doi:10.1073/pnas. 1208972109PMID:23151505
26. Park K, Scott AL. Cholesterol 25-hydroxylase production by dendritic cells and macrophages is regu-lated by type I interferons. J Leukocyte Biol. 2010 Aug 10; 88(6):1081–7. doi:10.1189/jlb.0610318 PMID:20699362
27. Buonaguro L, Wang E, Tornesello ML, Buonaguro FM, Marincola FM. Systems biology applied to vac-cine and immunotherapy development. BMC Syst Biol. 2011; 5(1):146.
28. Díaz-Uriarte R, Alvarez de Andrés S. Gene selection and classification of microarray data using ran-dom forest. BMC Bioinformatics. 2006; 7:3. PMID:16398926
29. Moorthy K, Mohamad MS. Random forest for gene selection and microarray data classification. Bioin-formation. 2011; 7(3):142–6. PMID:22125385
30. Okun O, Priisalu H. Random Forest for Gene Expression Based Cancer Classification: Overlooked Issues. In: Proceedings of the 3rd Iberian conference on Pattern Recognition and Image Analysis, Part II. Girona, Spain: Springer-Verlag; 2007. p. 483–90.
31. Li S, Rouphael N, Duraisingham S, Romero-Steiner S, Presnell S, Davis C, et al. Molecular signatures of antibody responses derived from a systems biology study of five human vaccines. Nat Immunol. 2014 Feb; 15(2):195–204. doi:10.1038/ni.2789PMID:24336226
32. Chaussabel D, Quinn C, Shen J, Patel P, Glaser C, Baldwin N, et al. A modular analysis framework for blood genomics studies: application to systemic lupus erythematosus. Immunity. 2008 Jul 18; 29 (1):150–64. doi:10.1016/j.immuni.2008.05.012PMID:18631455
33. Miyashita M, Oshiumi H, Matsumoto M, Seya T. DDX60, a DEXD/H box helicase, is a novel antiviral factor promoting RIG-I-like receptor-mediated signaling. Mol Cell Biol. 2011 Sep; 31(18):3802–19. doi: 10.1128/MCB.01368-10PMID:21791617
34. Shay T, Jojic V, Zuk O, Rothamel K, Puyraimond-Zemmour D, Feng T, et al. Conservation and diver-gence in the transcriptional programs of the human and mouse immune systems. Proc Natl Acad Sci USA. 2013 Feb 19; 110(8):2946–51. doi:10.1073/pnas.1222738110PMID:23382184
35. Hammer GE, Ma A. Molecular control of steady-state dendritic cell maturation and immune homeosta-sis. Annu Rev Immunol. 2013; 31:743–91. doi:10.1146/annurev-immunol-020711-074929PMID: 23330953
36. Türeci Ö, Bian H, Nestle FO, Raddrizzani L, Rosinski JA, Tassis A, et al. Cascades of transcriptional induction during dendritic cell maturation revealed by genome-wide expression analysis. FASEB J. 2003; 17(8):836–47. PMID:12724343
37. Draper DW, Gowdy KM, Madenspacher JH, Wilson RH, Whitehead GS, Nakano H, et al. ATP Binding Cassette Transporter G1 Deletion Induces IL-17-Dependent Dysregulation of Pulmonary Adaptive Immunity. J Immunol. 2012 Jun 1; 188(11):5327–36. doi:10.4049/jimmunol.1101605PMID:22539789
38. Smyth GK. Limma: linear models for microarray data. In: Gentleman R, Carey V, Dudoit S, Irizarry R, Huber W, editors. Bioinformatics and Computational Biology Solutions using R and Bioconductor. New York: Springer; 2005. p. 397–420.
39. Team RDC. R: A Language and Environment for Statistical Computing [Internet]. Vienna, Austria; 2011. Available from:http://www.R-project.org
40. Marchini JL, Heaton C, Ripley BD. fastICA: FastICA Algorithms to perform ICA and Projection Pursuit [Internet]. 2012. Available from:http://CRAN.R-project.org/package=fastICA
41. Subramanian A, Tamayo P, Mootha VK, Mukherjee S, Ebert BL, Gillette MA, et al. Gene set enrichment analysis: A knowledge-based approach for interpreting genome-wide expression profiles. Proc Natl Acad Sci USA. 2005 Oct 25; 102(43):15545–50. PMID:16199517
![Table 3. Predictions of human PBMC transcriptome data derived 6, 24 and 72 hours after vaccination by MRKAd5/HIV published in [25].](https://thumb-eu.123doks.com/thumbv2/123dok_br/18199837.333343/9.918.299.865.913.1016/table-predictions-human-transcriptome-derived-vaccination-mrkad-published.webp)