SPATIAL VARIABILTY OF AMBIENT TEMPERATURE, RELATIVE HUMIDITY AND AIR
VELOCITY IN A COLD STORE
SERAP AKDEMIR
a*, SELCUK ARIN
baTrakya University, Tekirdag Vocational School, Airconditioning and Refrigeration Programme , 59030 Tekirdag, Turkey
Phone:+90 282 2931438, Fax:+90 282 2931454, Corresponding author’s E-mail: serapakdemir@yahoo.com
bTrakya University, Tekirdag Agricultural Faculty, Agricultural Machinery Department, 59030 Tekirdag, Turkey
Manuscript received: March 16, 2006; Reviewed: April 27, 2006; Accepted for publication: May 9, 2006
ABSTRACT
Spatial distribution the ambient temperature, relative humidity and air velocity were determined for different storage temperatures such as 0 oC, 1 oC, 2 oC and 3 oC in an experimental cold store. Mapping software were used to show
the variability.
Spatial distribution of the temperature and the relative humidity was not uniform in the cold store. Reason of bad spatial distributions was bad spatial distribution of air velocity distributed by evaporator. A temperature and/or a relative humidity sensor are used in cooling systems to measure temperature and relative humidity. The umber of sensors are not enough to determine variability of temperature and relative humidity. There should be additional sensors located different places to give idea for cold storage.
INTRODUCTION
Deterioration of fruits and vegetables during the storage depends largely on temperature. One way to slow down this change and so increase the length of time fruits and vegetables can be stored, is by lowering the temperature to an appropriate level.
For most produce, a high but not saturated, relative humidity is required, eg. 85-95%.
shows specifi c relative humidity for fruits and vegetables. There is always some moisture loss during cold storage but excessive moisture loss is a problem. It is essential that the relative humidity is kept above 85%.
Temperature variation is minimized with adequate air circulation. Most stores are designed to provide an airfl ow of 0.3m3/min. per ton of product, based on the maximum
amount of product that can be stored in the room. This is needed to cool product to storage temperature and also may be needed if the product has a high respiration rate. This high airfl ow rate can cause excessive weight loss from products, and fans are a signifi cant source of heat, so the system should be designed to reduce airfl ow to 0.06 m3/min to 0.12 m3/min. of airfl ow per ton Motor
speed control systems, such as variable rate –frequency control controllers for alternating current motors, are used to control fan speed at the lowest possible speed that will prevent unacceptably warm product in the storage [2]. Most storage facilities use mechanical refrigeration to control storage temperature. The cooling system consists of a condenser, compressor, evaporator, refrigerant, expansion valve, lines and other related parts.
Storage temperature and relative humidity are usually measured from the back of the evaporator in a cold store. Cooling system sets due to this measured temperature value. However, distribution of the temperature and relative humidity in a cold store is generally not same because the ventilation of the air affects the distribution of the cold store temperatures.
Bad temperature control and low relative humidity are some of the problems in the cold storage [5].
The spatio-temporal temperature distribution in the imperfectly mixed airspace around plants has a considerable effect on the physiological plant processes. In a fully instrumented climate chamber, eight identifi cation experiments were carried out to model the spatio-dynamic temperature response around plants to variations in the supply air temperature and the sensible heat, produced by the lamps (directly related to the light intensity), as control inputs. From the experimental data, a minimally parameterized, linear, discrete–time transfer function matrix (TFM) model was identifi ed, capturing the dominant model behavior of the dynamic
process. Based on statistical considerations, a fi rst–order TFM model came out as the best model structure. The fi rst–order model provided a good compromise between goodness of fi t and parametric effi ciency (standard error), characterized the airfl ow behavior very well, and formed an adequate basis for model–based process control [3]. Air velocity should be 0.2 m/s. Its mean is equivalent velocity to change empty volume of cold store for 25-30 times per hour [4].
Airfl ow inside a cold store is investigated using computational fl uid dynamics. The airfl ow model is based on the steady state incompressible, Reynolds-averaged Navier±Stokes equations. The turbulence is taken into account using a k ¡ “ model. The standard as well as the Renormalisation-Group (RNG) version of the k ¡ “ model is investigated. The forced circulation air cooler unit is modeled with an appropriate body force and resistance, corresponding to the characteristics of the fan and the tube-bank evaporator [6].
Spatial distribution of the air velocity, ambient temperature and relative humidity is important to protect agricultural product in a cold store. Aim of this article is to show spatial variability of the temperatures, relative humidity and air velocity in a cold store. In this research; an experimental cold store was used for this aim. Temperatures, relative humidity and air velocity of different places in the experimental cold store were measured to determine spatial distribution of these factors. Ambient temperatures, relative humidity and air velocity were determined at ceiling, medium and fl oor level in the cold store for different storage temperatures as 0 oC, 1 oC, 2 oC and 3 oC. The results were used to produce
spatial distribution maps of ambient temperature, relative humidity and air velocity.
MATERIALS
Cold store
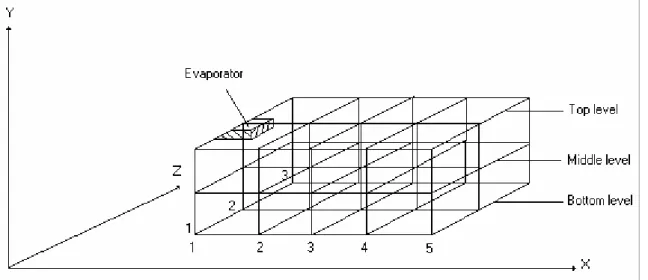
Dimensions of cold storage were (length x width x height) 4.52 m in length x 1.90 m in width x 2.22 m in height. The volume of the cold store was 19.07 m3. A
compressor was located in the outside of the cold store. A condenser, a condenser ventilator, a fl uid hopper and a drier were gathered as a group inside the compressor chassis. An evaporator was put on the ceiling of the cold storage with steel screws. Thermostatic expansion valve was fi tted in the evaporator inlet and on the high-pressure side of the compressor. A control panel, which includes a thermometer-thermostat, a manometer and a humidity gauge, was placed on the front wall of the cold store. The refrigerant was R404A.
10460 kJ/h. An electrical motor of 1.49 kW powered the compressor. The condenser was cooled by air. It consists of copper pipes, aluminum plates and an axial type ventilator. Its capacity was 12540 kJ/h. The evaporator was made of copper pipes and outside surface covered with aluminum plates. An axial ventilator was located on the back of the evaporator to distribute the cooled air into the cold store. An electrical heater was used to defrost. The capacity of evaporator was 10460 kJ/h.
SENSORS
Measurement limits of the temperature sensors ranged between -20oC and +100oC. Accuracy of the temperature
sensors was ± 1%. Measurement limits of the relative humidity sensors ranged between 0 % and 100%. Accuracy of the relative humidity sensors was ± 5 %. Measurement limits of the air velocity sensors ranged between 0 m/s and 20 m/s. Accuracy of the relative humidity sensors was ± 1%.
METHODS
Ambient temperature, relative humidity and air velocity of different places in this the cold store were measured to determine spatial distribution of these factors. Ambient temperatures, relative humidity and air velocity were measured in top, medium and fl oor of the cold store for different storage temperatures as 1 oC, 2 oC, 3 oC and 4oC.
The results were used to produce spatial distribution maps for temperatures, relative humidity and air velocity. Measurement points are given in Figure 1.
Surfer Graphic Programme was used to create maps.
Measured data arranged in a fi le to use by Surfer Programme. Surfer Programme created grid data fi les. The grid data fi les were used to create contour maps [1]. The maps were investigated to determine changing of the temperature, air velocity and relative humidity in the cold store.
The results of the air velocity, ambient temperatures and relative humidity were evaluated by using mean, maximum, minimum, standard deviation, and coeffi cient of variation (CV) [7].
RESULTS
Spatial distribution of the air velocity, ambient temperature and relative humidity are given in fi gure 2, fi gure 3, fi gure 4 and fi gure 5. Descriptive statistics of the data used to create maps are given table 1, table 2, table 3 and table 4.
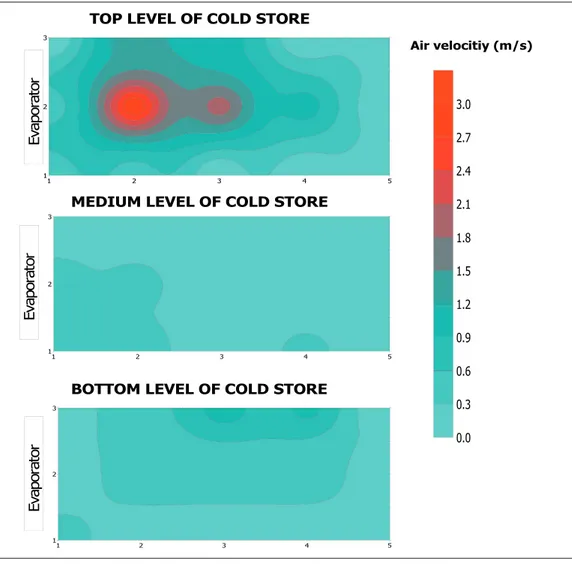
Figure 1 is showing that there is variability between air velocity values of top, middle and bottom level of the cold store. When Figure 1 and Table 1 investigated, air velocity and maximum CV (%) can be determined as 2.93m/s, 136.76 % for top level located in front of evaporator. Variation of the air velocity at the middle and bottom of the cold store were less then that top level of the cold store because evaporator was placed at top of the cold store.
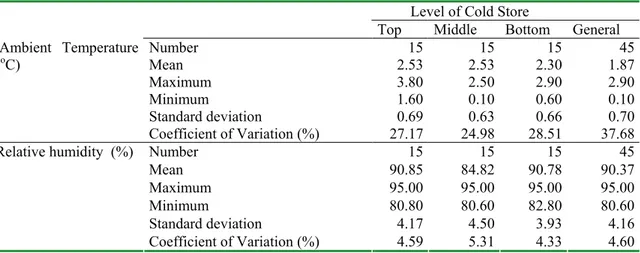
Variation of the ambient temperature of the cold store at 0 oC storage temperature changed between 0.1 oC and 2.9 oC. Coeffi cient of variations of top, middle and bottom
level at the cold store were 40.5 %, 24.98 % and 28.51 %, respectively. Maximum CV was determined for top
1 2 3 4 5 1
2 3
0.0 0.3 0.6 0.9 1.2 1.5 1.8 2.1 2.4 2.7 3.0
Air velocitiy (m/s)
TOP LEVEL OF COLD STORE
MEDIUM LEVEL OF COLD STORE
1 2 3 4 5
1 2 3
BOTTOM LEVEL OF COLD STORE
1 2 3 4 5
1 2 3
Ev
ap
or
at
or
Ev
ap
or
at
or
Ev
ap
or
at
or
Figure 2. Distribution of air velocity in the experimental cold store.
Table 1. Descriptive statistics for air velocity distribution. Level of Cold Store
Top Middle Bottom General
Number 15 15 15 45
Mean 0.64 1.08 0.31 0.36
Maximum 2.93 0.49 1.08 2.93
Minimum 0.00 0.00 0.00 0.00
Standard deviation 0.87 0.22 0.38 0.59
Air velocity (m/s)
1 2 3 4 5 1
2 3
0 1 2 3 4 5 oC
Ambient temperature Relative Humidity
TOP LEVEL OF COLD STORE
MEDIUM LEVEL OF COLD STORE
1 2 3 4 5
1 2 3
BOTTOM LEVEL OF COLD STORE
1 2 3 4 5
1 2 3
1 2 3 4 5
1 2 3
80 82 84 86 88 90 92 94 96 98 100
1 2 3 4 5
1 2 3
1 2 3 4 5
1 2 3
Ev
ap
or
at
or
Ev
ap
or
at
or
Ev
ap
or
at
or
Figure 3. Spatial distribution of temperature and RH for 0oC storage temperature.
Table 2. Descriptive statistics for ambient temperature and relative humidity at 0oC storage temperature.
Level of Cold Store
Top Middle Bottom General
Number 15 15 15 45
Mean 2.53 2.53 2.30 1.87
Maximum 3.80 2.50 2.90 2.90
Minimum 1.60 0.10 0.60 0.10
Standard deviation 0.69 0.63 0.66 0.70
Ambient Temperature (oC)
Coefficient of Variation (%) 27.17 24.98 28.51 37.68
Number 15 15 15 45
Mean 90.85 84.82 90.78 90.37
Maximum 95.00 95.00 95.00 95.00
Minimum 80.80 80.60 82.80 80.60
Standard deviation 4.17 4.50 3.93 4.16
Relative humidity (%)
level because maximum air velocity variation was also determined for the top level of the cold store.
Ambient relative humidity of the cold store was not controlled by the cooling system, automatically. But the coeffi cient of variation of the relative humidity was changed between 4.33 % and 5.31 %. It is good. The variation of the relative humidity was small because researchers controlled relative humidity during the experiments.
Variation of the ambient temperature of the cold store at 1oC storage temperature changed between 1.5 oC and 3.9 oC. Coeffi cient of variations of top, middle and bottom
level at the cold store were 27.17 %, 21.55 % and 21.92 %, respectively.
The coeffi cient of variation of the relative humidity was changed between 3.59 % and 5.13 %. The relative humidity was changed between 81.1 % and 95 %. The ambient temperature at 2oC storage temperature
changed between 2.7oC and 5.3oC. Coeffi cient of
variations of top, middle and bottom level at the cold store were 19.76 %, 15.19 % and 15.17%, respectively. The coeffi cient of variation of the relative humidity was changed between 3.59 % and 5.13 %. The relative humidity was changed between 85.2% and 95%.
Variation of the ambient temperature of the cold store at 3oC storage temperature changed between 3.5oC and 5.7 oC. Coeffi cient of variations of top, middle and bottom
level at the cold store were 10.66 %, 9.45 % and 12.26%, respectively.
The coeffi cient of variation of the relative humidity was changed between 0.49 % and 1.81 %. The relative humidity was changed between 90.30 % and 95 %.
CONCLUSIONS
Spatial distribution of the air velocity, ambient temperature and relative humidity is important to protect agricultural product in a cold store. In this research an experimental cold store was used to determine spatial distribution of the air velocity, ambient temperature and relative humidity. Temperature and relative humidity sensors are generally located at one point of a cold room. Temperature and relative humidity can measure only one point and the cooling system can be set due to this measured values. The measurements of these sensors are not enough to get a decision for storage temperature and relative humidity. There should be additional sensors located different places to give idea for cold storage. The storage temperature is controlled by the coling system. The relative humidity of the cold store is not generally controlled automatically in practice. Wet jute sack used to control humidity in cold stores.
The ambient temperatures, the relative humidity and the air velocity were determined at ceiling, medium and fl oor level in the cold store for different storage temperatures as 0oC, 1oC, 2oC and 3oC. Mapping software and descriptive
statistics (mean, maximum, minimum, standard deviation and coeffi cient of variation) were used to evaluate spatial distribution of these data in a cold store.
The air velocity changed between 0 m/s and 2.9, m/s. Coeffi cient of the variation for ceiling and fl oor (136,76 % and 124.17 %, respectively) of the cold store was bigger than that middle of the cold store 820.06%). Ambient temperature varied between 0.1oC and 2.9oC for
0oC storage temperature, 1.5oC and 3,9 oC for 1oC storage
temperature, 2.7oC and 5.3oC for 2oC storage temperature,
3.5oC and 5.7oC for 3oC storage temperature.
Ambient relative humidity changed between 80.60 % and 95 % for 0oC storage temperature, 81.1 % and 95
% for 1oC storage temperature, 85.20 % and 95 % for
2oC storage temperature, and 90.30 % and 95 % for 3oC
storage temperature.
The results showed that distribution of the ambient temperature and the relative humidity was not uniform for this experimental system. Reason of bad spatial distribution of ambient temperature is bad spatial distribution of air velocity generated by evaporator fan. Mapping software can be used to show spatial distribution of the storage factors such as temperature, relative humidity and air velocity for a cold storage to apply best management techniques. Bad distribution area for ambient temperature, relative humidity, and air velocity can be determined by using these maps. If it is required, ventilation of the air can be directed to the bad distribution area or added new ventilation units to correct bad distributions of these factors in a cold store.
Further investigation should be done for different cooling systems and then solutions of the determined problems should be investigated.
REFERENCES
[1] Akdemir, B., Blackmore S, Yield mapping preparation techniques, Agricultural Machinery National Turkey. Symposium, 46-57. Mechanical Engineering Chamber, Mersin, Turkey, 2001.
[2] Arkema, FW, DeBaerdemaeker J, Amirante P, Ruiz-Altisent M, Studman CJ. CIGR Handbook of Agricultural Engineering 1999. Volume IV, P.342.
oC
RH (%)
Ambient temperature TOP LEVEL OF COLD STORE Relative Humidity
MEDIUM LEVEL OF COLD STORE
BOTTOM LEVEL OF COLD STORE
Ev
ap
or
ato
r
1 2 3 4 5
1 2 3
0 1 2 3 4 5
1 2 3 4 5
1 2 3
80 82 84 86 88 90 92 94 96 98 100
1 2 3 4 5
1 2 3
1 2 3 4 5
1 2 3
Ev
ap
or
at
or
1 2 3 4 5
1 2 3
1 2 3 4 5
1 2 3
Ev
ap
or
ato
r
Figure 4. Spatial distribution of temperature and RH for 1oC storage temperature.
Table 3. Descriptive statistics for ambient temperature and relative humidity at 1oC storage temperature.
Level of Cold Store
Top Middle Bottom General
Number 15 15 15 45
Mean 2.53 3.33 3.04 2.71
Maximum 3.80 3.60 3.90 3.90
Minimum 1.60 1.60 1.50 1.50
Standard deviation 0.69 0.72 0.67 0.72
Ambient Temperature (oC)
Coefficient of Variation (%) 27.17 21.55 21.92 26.42
Number 15 15 15 45
Mean 91.33 87.10 91.98 91.74
Maximum 95.00 95.00 95.00 95.00
Minimum 81.50 83.20 81.10 81.10
Standard deviation 4.69 3.12 4.08 3.93
Relative humidity (%)
Figure 5. Spatial distribution of temperature and RH for 2oC storage temperature.
oC
RH (%)
Ambient temperature Relative Humidity
TOP LEVEL OF COLD STORE
MEDIUM LEVEL OF COLD STORE
BOTTOM LEVEL OF COLD STORE
Eva
po
ra
to
r
Ev
ap
ora
to
r
Ev
ap
or
at
or
1 2 3 4 5
1 2 3
1.00 2.00 3.00 4.00 5.00
1 2 3 4 5
1 2 3
80 82 84 86 88 90 92 94 96 98 100
1 2 3 4 5
1 2 3
1 2 3 4 5
1 2 3
1 2 3 4 5
1 2 3
1 2 3 4 5
1 2 3
Table 4. Descriptive statistics for ambient temperature and relative humidity at 2oC storage temperature.
Level of Cold Store
Top Middle Bottom General
Number 15 15 15 45
Mean 3.75 4.66 4.13 3.95
Maximum 5.30 5.20 5.00 5.30
Minimum 2.70 2.80 2.90 2.70
Standard deviation 0.74 0.71 0.63 0.69
Ambient temperature (oC)
Coefficient of Variation (%) 19.76 15.19 15.17 17.59
Number 15 15 15 45
Mean 92.89 89.23 93.99 93.68
Maximum 95.00 95.00 95.00 95.00
Minimum 85.20 91.10 87.20 85.20
Standard deviation 3.27 1.20 2.18 2.39
Relative humidity (%)
Figure 6. Spatial distribution of temperature and RH for 3oC storage temperature.
oC
RH (%)
Ambient temperature Relative Humidity
TOP LEVEL OF COLD STORE
MEDIUM LEVEL OF COLD STORE
BOTTOM LEVEL OF COLD STORE
1 2 3 4 5
1 2 3
1 2 3 4 5
1 2 3 4 5
1 2 3
1 2 3 4 5
1 2 3
80 82 84 86 88 90 92 94 96 98 100
1 2 3 4 5
1 2 3
1 2 3 4 5
1 2 3
1 2 3 4 5
1 2 3
Ev
ap
or
at
or
Ev
ap
or
at
or
Ev
ap
or
at
or
Table 5. Descriptive statistics for ambient temperature and relative humidiy at 3oC storage temperature.
Level of Cold Store
Top Middle Bottom General
Number 15 15 15 45
Mean 4.51 5.41 4.83 4.70
Maximum 5.30 5.50 5.70 5.70
Minimum 3.60 3.70 3.50 3.50
Standard deviation 0.48 0.51 0.59 0.54
Temperature
(oC)
Coefficient of Variation (%) 10.66 9.45 12.26 11.42
Number 15 15 15 45
Mean 94.18 15 94.75 94.51
Maximum 95.00 89.63 95.00 95.00
Minimum 90.30 95.00 93.70 90.30
Standard deviation 1.70 92.50 0.47 1.13
Relative humidity
(%)
1082.
[4] Cemeroğlu, B., A. Yemenicioğlu, M. Özkan, 2001. Contents of the fruits and vegetables- Cold Storage, 256. Food Technology Society of Turkey, Publicaiton No:24, Ankara, Turkey.
[5] Chunli, L, Zhang M, Huan YJ, Tao Q, Wang H. Studies on the ice temperature-high humidity (ITHH) preservation of grapes, Agricultural Engineering Into Third Millennium (AgEng 2000-Warwick-on CD),
Warwick, England, 2000, pp:131-139.
[6] Hoang, ML, Verboven P, De Baerdemaeker J, Nicolai BM. Analysis of the air fl ow in a cold store by means of computational Fluid dynamics,. International Journal of Refrigeration 2000;2;127-140