23
Pakistan Veterinary Journal
ISSN: 0253-8318 (PRINT), 2074-7764 (ONLINE)
Accessible at: www.pvj.com.pk
Effect of Milk Yield on Economic Profitability of Holstein Friesian Cows under Intensive
Production System in Egypt
H. G. El-Awady
Animal Production Department, Faculty of Agriculture, Kafrelsheikh University, PC: 33516, Kafrelsheikh, Egypt Corresponding author: hassanelawady63@yahoo.com
A R T I C L E H I S T O R Y A B S T R A C T
Received: Revised: Accepted:
December 31, 2011 May 12, 2012 May 27, 2012
Key words: Benefit/cost ratio Deterministic Gross margin Intensive Profitable
Data of productive and reproductive traits of 1961 of lactation records were obtained from 763 Dutch Friesian cows grew up at Wadi El-Sharkiafarm, El-Salheia, Egypt. These data were analyzed to empirical comparison between the profitability of three herds under intensive production system in Egypt. The second herd (H2) produced average milk yield of 8619 kg/lactation, followed by first herd (H1) (5138 kg/lactation) which was lower than the H2 by at least one standard deviation (SD = 2935 kg). The third herd (H3) produced high milk yield equal to the average of H2 plus at least one standard deviation. Traits studied were milk yield per day (M/D, kg), total milk yield (TMY, kg), lactation period (LP, day), dry period (DP, day), annual milk yield (AMY, kg), days open (DO, day), number of services per conception (NSPC), calving interval (CI, day), number of lactation completed (NLC) and age at first calving (AFC). Least squares analysis of variance showed highly significant (P<0.01) effects of all factors on all traits studied except the effect of month and year of calving on NSPC that was non-significant. For comparing between the three herds, the deterministic model was used to estimate the annual gross margin and benefit/cost ratio as economic parameters. Prices of inputs and outputs were based on market and farm gate prices during the period from 1998 to 2007. DO, CI and NSPC were increased in H3 vs. H2 and H1, indicating poorer reproductive efficiency of high yielding herd. Moreover, H3 gave 1.03 and 1.5 parity less for each cow than that of H2 and H1, respectively. Economic evaluations indicated that the annual variable cost were (LE) (Egyptian pound = 0.17 USD and = 0.13 EUR) 5136, 6910 and 7845 of H1, H2 and H3, respectively. However, the annual gross margin of H3 was higher than that of H1 and H2 by 79 and 24%, respectively, and the benefit/cost ratio of H3 was 1.90 relative to 1.63 and 1.68 for H1 and H2, respectively. The profit per cow during the lifetime production of H3 was 72 and 19.04% more than of H1 and H2, respectively. It is concluded that under intensive production system, extension of calving interval for high yielding herds seem more profitable than the herds that have shorter calving interval and lactation period.
©2012 PVJ. All rights reserved To Cite This Article: El-Awady HG, 2013. Effect of milk yield on economic profitability of Holstein Friesian cows under intensive production system in Egypt. Pak Vet J, 33(1): 23-26.
INTRODUCTION
Profitability of dairy cows is influenced by the herd's level of production and reproduction (Baharizadeh, 2012). Milk yield is considered the major source of farm revenues (Rehman and Khan, 2012). Annual milk yield is an index, which reflects the intensity of lactation and combines milk yield and reproductive efficiency of a dairy cow (Gorgulu, 2011; Katok and Yanar, 2012). Producing more milk annually is a primary measure of efficiency because maximum production of dairy cows has typically occurred
with optimal management conditions (Kellogg et al., 2001; Khan et al., 2012). Milk production in Egypt is less than the threshold of self-sufficiency representing 72% of the domestic demand (MALR, 2000). Because the low milk production of local breeds, exotic breeds are adopted to increase milk production in commercial herds where intensive systems are followed.
Pak Vet J, 2013, 33(1): 23-26. 24
associated with the reproductive efficiency and fertility in dairy cattle. They are important in determining calving interval and influencing milk production (Ali et al., 2003; Riecka and Candrak, 2011). Regular calving (every 12-13 months) is one of the main targets of dairy farmers. Thus, we can reach the available maximum number of lactations per lifetime production of cows and provide the farmer with more progenies for replacement or sale.
Long calving interval may be the main reproductive disorder of high yielding dairy cattle. Mainly, that is due to either low conception rate (40-50%) and/or high early embryonic mortality (Rossi et al., 2008). The poor reproductive performance of high yielding cows may affect the overall economic performance of the herd especially under high ambient temperature (Jainudeen and Hafez, 2000).
We can judge the profitability of farm by the gross margins of the enterprise. A major reason for difference of gross margin is the level of yield obtained and price of the products. High yielding cows need additional costs. When this incurred, we must take the decision based on whether the extra returns would be greater than the additional costs involved or not. Therefore, the aim of the present study was to evaluate the economic performance of three Holstein Friesian herds having different levels of milk production and calving intervals under intensive farming system.
MATERIALS AND METHODS
Data and management: Productive and reproductive data of 1961 lactation records, starting from 1961 to 2007, obtained from 763 Dutch Holstein Friesian cows mating by 171 sires, belonging to Wadi El-Sharkiafarm, El-Salheia, Egypt, were analyzed for empirical comparison between the profitability of three herds under intensive production system. According to the level of milk yield, the records were divided into three herds. The first herd (less than 20 kg/day) having average milk production decreased at least by one standard deviation (x- – 1 SD, SD = 2935 kg), the second herd (between 20-25 kg/day) had milk production equal to the average of Holstein Friesian under the intensive dairy farms in Egypt (8719 kg). The third herd contained the high yielding cows (more than 25 kg/day) which produced more than the average milk production at least by one standard deviation.
Animals of the three herds were kept under the same system of feeding and management in the original farm. Cows were fed according to their live body weight, milk production level, and pregnancy status (National Research Council, 2001). Cows were fed on corn silage along with Egyptian clover (Trifolium alexandrinum) for about six months during the year from December to May with concentrate ration. During summer and autumn cows were fed by corn silage along with Barseem hay and concentrate ration (total mixed ration). Percentage of protein in the concentrate mixture ranged from 17 to 19% for high milk yield herd, from 16 to 17% for medium milk yield herd and from 14 to 16% for low milk yield herd. Clean water and mineral mixture were available all time. Cows were artificially inseminated within 12 hours after the detection of heat using frozen semen (Friesian Bulls) imported from Germany, Netherlands and USA. Pregnancy test was made after 42 days of insemination by rectal palpation. Cows in estrus before pregnancy test were artificially inseminated
immediately. Cows were initially served 60–70 days after parturition. Cows with less than 3 or more than 5 lactations were excluded.
Cows were milked 2-4 times daily according to their milk production level. Milk yield was recorded to the nearest 0.1 kg daily at each milking. Costs and revenues were estimated according to technical coefficients and management practices in the farm.
Traits, technical coefficients and assumptions: Data were statistically analyzed to estimate the productive technical coefficients of the three herds. The terms of productive traits study were, milk production per day (M/D, kg), total milk yield (TMY, kg), lactation period (LP, day), dry period (DP, day), and annual milk yield (AMY, kg equals TMY, kg divided by CI in days multiplied by 365), while reproductive traits terms were, days open (DO, day), number of services per conception (NSPC), calving interval (CI, days), number of lactations completed [parities of the cow (NLC)] and age at first calving (AFC). Table 1 shows assumptions that were adopted in calculating the farm budget.
* Number of lactations completed (NLC) by herd 1 (H1) assumed to be 4 according to (El-Gharabawy, 2008) as a control.
* Culling age = [AFC of H1 + (4 NLC x CI of H1)] = (24 month x 30.5 day) + (4 x 442) = 732 + 1768 = 2500 days (6.85 years). * The prices of inputs were estimated based on the market price during the period from 1998 to 2007.
* The prices of outputs were estimated based on the Wadi El-Sharkiafarm gate price during the period from 1998 to 2007. * Gross margin is one of the more realistic measures to evaluate farm profitability (Barnard and Mix, 1993). To compare among three herds, the annual gross margins as well as, discounted measure, benefit/cost ratio (present worth of benefits divided by present worth of costs) were used as economic tools for comparing three herds.
Statistical analysis: Data were analyzed using General Linear Model (GLM) procedure of SAS (2006) to determine the fixed effects and to develop technical coefficients of the three herds. The statistically model included months (1 to 12) and years (1998 to 2007) of calving, parity of cow (1 to ≥5), herds (1, 2 and 3). The following statistically model was used:
Yijklm = µ + Mi + Rj + Tk + Hl + β (AFC) + eijklm Where:
Yijklm = observation of productive and reproductive traits, µ = the overall mean,
Mi = fixed effect of month of calving k (i=1, 2,…,12), Rj = fixed effect of year of calving l (j =1, 2, …….,10), Tk = fixed effect of parity m of the cow (k=1, 2,…….,≥5), Hl = fixed effect of herd level production (l =1, 2 and 3), β = the linear regression coefficient of the studied trait on
AFC and eijklm = random error.
RESULTS AND DISCUSSION
Pak Vet J, 2013, 33(1): 23-26. 25
2.71 times more than H2 and H1, respectively, while H2 increased as 1.70 times more than H1 for the same trait. The results showed that H3 had poorer reproductive performance than H2 and H1. Table 2 indicated that high milk producer cows had longer interval from calving to the conception. This consequently prolonged the calving interval due to the increase in number of services per conception by about 1.44 times (H3 vs. H2), 2.25 times (H3 vs. H1) and 1.56 times (H2 vs. H1).
This result may be attributed mainly to the negative energy balance of the high yielding cows particularly during the peak of lactation (Rossi et al., 2008). High milk production mainly at high ambient temperature can cause physiological stress that may lead to a depression of the interior pituitary secretion. Such depression causes delay in resumption of ovarian activity post-partum which explains the increase of post-partum service interval. Moreover, the early embryo mortality (Dunne et al., 2000) is a major cause of reproductive failure in cattle and of serious financial loss to dairy and beef farmers, therefore, leading to increased number of services per conception and prolonged calving interval. The low reproductive efficiency for high milk producing cows observed in the present study was similar to those reported by Muller et al. (2000) and Rossi et al. (2008).
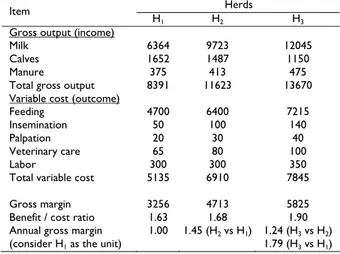
Economic evaluation: Income (gross output) of H3 was more than that H2 and H1 as about 17.61 and 62.91%, respectively, while H2 increase than H1. This may be attributed to the higher milk revenues. The current study showed 75.84, 83.65 and 88.11% of the total gross output for H1, H2 and H3, respectively (Table 3).
Annual variable cost per cow of H3 was higher (P<0.01) than those of H2 and H1 by about 13.53 and 52.78%, respectively, while H2 was higher than H1 by about 34.57%. This difference among three herds can attributed mainly to the extra feeds to cover extra milk production, labor and semen cost for breeding, while cows in H3 needed more semen doses to get pregnant. Feeding represented the major element of the variable cost. It represented 91.53, 92.62 and 93.97% for H1, H2 and H3, respectively (Table 3).
In Morocco, Taher (2011) revealed that a balanced development of the dairy chain urgently requires a fairer distribution of the revenue it generates. And this will require negotiation among all operators on such issues as milk prices and quality assessment, so that they are all remunerated according to the value of their efforts. This will create business climate conducive to further investment in the dairy chain.
The current results revealed that, although the H3 needs a cost of 13.53 and 52.78% more than the H2 and H1, respectively, due to the high needs of the production milk and even though the revenues that come from the calves of the H3 are less than of H1 and H2 by 30.39 and 22.66%, respectively, because of low reproductive efficiency, the annual gross margin of H3 increased by 79 and 24.00% than H1 and H2, respectively. Also benefit/cost ratio increased in H3 by 27 and 22% than H1 and H2, respectively (Table 3). Ahmed et al. (2002) worked on two herds, the first (H1) was supposed to produce milk equal to the average lactation milk yield and the second (H2) to produce high milk yield equal to the
average plus at least one standard deviation. They found that the annual gross margin of H2 increased by 18.5 and 3.9%, respectively as compared with H1.
Table 1: Assumptions adopted in calculating the farm budget
Items Herds
H1 H2 H3
* Number of cows (763)
* Mature body weight (kg)
* Average of age at first calving(months) * Conception rate per herd (%) * Calf sale price at birth (L.E)** * Semen dose (LE.)
* Annual veterinary care cost (L.E)
* Annual manure production per head (m3)
* Price of m3 manure (L.E)
* Rectal palpation/time (L.E) * Sale price of 1 kg milk in farm (L.E)
168 (22%) 550 24.00 90 2000 50 65 15.0 25 20 1.5 435 (57%) 600 25.82 82 2000 50 80 16.5 25 20 1.5 160 (21%) 600 27.66 78 2000 50 100 19.0 25 20 1.5 ** The Egyptian pound is the current legal currency of Egypt. The pound is divided into 100 piaster (qirsh) or 1000 milliemes (malleem). The ISO 4217 code for the Egyptian pound is EGP. Locally, the abbreviation LE or L.E., which stands for livre égyptienne (French for Egyptian pound), is frequently used. E£ and £E are also much less-frequently used. The Egyptian Arabic name, ginaih, may be related to the English name guinea and L.E = 0.17 USD and = 0.13 EUR).
Table 2: Means and standard deviations for productive, reproductive
and lifetime production traits for the three herds investigated. Herds Trait
H1 H2 H3
Productive traits Daily milk yield (M/D, kg) Total milk yield (TMY, kg) Lactation period (LP, day) Dry period (DP, day) Annual milk yield (AMY, kg) Reproductive traits Days open (DO, day) No. of services per conception (NSPC) Calving interval (CI, day) No. of lactations complete (NLC)
Age at first calving (AFC)
5.06±0.27c 5138±742c 58±13.06c 83.70±3.77c 4243±669c 158±4.21c 1.53±0.04b 442.0±11.8c 4.51±0.36c 24.01±1.03c 22.41±0.78b 8719±839b 396±11.52b 96.53±5.91b 6482±870b 211.80±7.66b 2.39±0.09 491.50±5.3b 4.04±0.17b 25.82±1.99b 26.32±0.64a 13935±808a 528±9.80a 108.41±4.88a 8030±913a 359±10.57a 3.44±0.09a 635.0±8.6a 3.01±0.29a 27.66±2.21a
a,b,cMeans with different superscripts are significantly different at
P<0.01.
Table 3: Analysis of the annual gross output (income) and variable
costs per cow of the three herds
Herds Item
H1 H2 H3
Gross output (income) Milk
Calves Manure
Total gross output Variable cost (outcome) Feeding
Insemination Palpation Veterinary care Labor
Total variable cost
Gross margin Benefit / cost ratio Annual gross margin
(consider H1 as the unit)
6364 1652 375 8391 4700 50 20 65 300 5135 3256 1.63 1.00 9723 1487 413 11623 6400 100 30 80 300 6910 4713 1.68
1.45 (H2 vs H1)
12045 1150 475 13670 7215 140 40 100 350 7845 5825 1.90
1.24 (H3 vs H2)
1.79 (H3 vs H1)
Pak Vet J, 2013, 33(1): 23-26. 26
intensive production system. Due to longer calving interval of H3, each cow gave 1.03 and 1.5 parity less than that of H2 and H1, respectively (Table 2). In this respect, Ahmed et al. (2002) reported that the high yielding cows gave 0.9 parity less than that of the H1 which produced the average lactation yield of Holstein. Results of Table 4 showed that the average variable cost for the whole lifetime production of H3 exceeded that of H1 and H2 by 46.62 and 9.36%, respectively. On the other hand, the total gross output of H3 exceeded those of H1 and H2 by 56.00 and 13.28%, respectively. Moreover, the profit per cow during the lifetime production of H3 was 72 and 19.04% more than of H1 and H2, respectively.
Table 4: Financial analysis (LE) for lifetime production per cow of the
three herds and percentages of difference among herds investigations
Herd % difference between the herds
Item
H1 H2 H3 H2 vs H1 H3 vs H1 H3 vs H2
Cross output 45815 63231 71630 +38.00 +56.00 +13.28
Variable cost 28037 37590 41108 +34.01 +47.00 +9.36
Gross margin 17778 25641 30522 +44.04 +72.00 +19.04
Khan et al. (2010) calculated the economic profitability for Red Chittagong cows (RCC) under the rural area in the Chittagong district of Bangladesh by using a deterministic linear model. The income was derived from the sale of milk, beef and manure and costs included only for feed and fixed costs. The milk payment for the farmers was based on milk volume only and was used to calculate the profit. They found lower profitability than the present finding. Also they added that differences of profitability were attributed due to the differences of the prices of feed, milk, meat and the differences of breeds.
Uddin et al. (2010) concluded that the degree of intensification and potential availability of input and support services play a great role in reducing the costs by increasing the return and improving productivity. The institutional arrangements and natural resource endowments in each system also influence the costs of inputs and support services. They added that the intensive dairy farming system produces higher milk with lower cost, hence it is more competitive. Moreover, the intensive farmers are at better position in terms of costs and profits than extensive and traditional systems and are more competitive, due to lower per unit costs, higher milk prices, higher milk production, higher land and labour productivity.
Conclusion: From the results, it can conclude that under the intensive production system, high milk producer cows with longer calving interval are more profitably than those having regular calving every 12-13 months, regardless the value of genetic losses in the form of heifers for replace- ment and/or bulls for insemination. This needs more investigations to quantify the value of such losses and its impact on herd dynamic. Furthermore, from the genetic point of view, criteria of selection planning would be more efficient when information comes from high yielding cows.
Acknowledgement: My thanks to the Wadi El-Sharkia farm, El-Salheia, Egypt, for making the data available for analysis.
REFERENCES
Ahmed AM, US El-Saied, K Amal El-Asheeri, MA El-Wardani and AH Barkawi, 2000. Effect of heat detection in buffaloes on length of service period and herd profitability. Egyptian J Anim Prod, 37: 67-76.
Ahmed AM, K Amal El-Asheeri, MAM Ibrahim, and AH Barkawi, 2002. Impact of milk yield on economics of Holstein herds under Egyptian conditions. Egyptian J Anim Prod, 39: 1-7.
Ali AK, AM Al-Seaf, MA Alshaikh, MS Alkiadess and A Al-Haidary, 2003. Effect of non-genetic factors on lactation cure of Holstein Friesian cows in Saudi Arabia. J King Saud Univ, 15: 115-124.
Baharizadeh M, 2012. Estimates of genetic parameters of production traits for Khuzestan buffaloes of Iran using repeated-records animal model. Pak Vet J, 32: 618-620.
Barnard CS and JS Mix, 1993. Farm Planning and Control: Budgeting and
programming planning, 2nd Ed, Cambridge University Press,
Cambridge, UK.
Dunne LD, MG Diskin and JM Sreenan, 2000. Embryo and foetal loss in beef heifers between day 14 of gestation and full term. Anim Reprod Sci, 58: 39-44.
EL-Gharabawy MA 2008. Genetic parameters of lifetime milk yield in a commercial herd of Friesian cattle in Egypt. PhD Thesis Fac Agric Tanta Univ, Egypt, pp: 47-68.
Gorgulu O, 2011. Path analysis on effective factors affecting 305-D milk yield in Simmental cattle. Int J Agric Biol, 13: 381–385.
Jainudeen MR and ESE Hafez, 2000. Part IV: Reproductive Failure, Reproductive Failure in Females, chapter 18, Reproduction in
Farm Animals, 7th Rev Ed, Blackwell Publishers, pp: 294-322.
Katok N and M Yanar, 2012. Milk traits and estimation of genetic, phenotypic and environmental trends for milk and milk fat yields in Holstein Friesian cows. Int J Agric Biol, 14: 311–314.
Kellogg DW, JA Pennington, ZB Johnson and R Panivivat, 2001. Survey of management practices used for the highest producing DHI herds in the United States. J Dairy Sci, 84: 120-127.
Khan MKI, G Miah, MJ Khatun and A Das, 2010. Economic values for different economic traits of Red Chittagong cows. Indian J Anim Sci, 80: 1138-1140.
Khan MS, ZU Rehman, S Ahmad, FU Hassan and MSU Rehman, 2012. Prediction of standard lactation milk yield from completed lactations of longer duration in cattle and buffaloes. Pak Vet J, 32: 122-124.
MALR, 2000. Ministry of Agriculture and Land Reclamation, Economic Affairs Sector, Agricultural Statistics Data, Arab Republic of Egypt, 2: 33-58.
Muller CJC, FJ du Toit, C Singhapol and JA Botha, 2000. Effect of milk yield on some reproductive parameters of the Elsenburg Holstein and Jersey herds. South Afr J Anim Sci, 30: 34-35.
National Research Council (NRC), 2001. Nutrient Requirements of
Dairy Cattle, National Research Council. 7th Rev Ed, National
Academy Press, Washington, DC., USA, pp: 184-213.
Rehman Z and MS Khan, 2012. Environmental factors affecting performance traits of Sahiwal cattle in Pakistan. Pak Vet J, 32: 229-233.
Riecka Z and J Candrák, 2011. Analysis of relationship between production and reproduction traits of Holstein cattle population in the Slovak Republic. Anim Sci Biotechnol, 44: 332-336. Rossi F, F Righi, S Romanelli and A Quarantelli, 2008. Reproductive
efficiency of dairy cows under negative energy balance conditions. Ann Fac Medic Vet di Parma, XXVIII: 173-180.
SAS, 2006. Users guide, 10.05 Ed, Statistical Analysis System Institute Inc. Cary NC, USA.
Taher SM, 2011. Dairy Development In Morocco. Food and Agriculture Organization of the United Nations, Rome, Italy, Dairy Reports, pp: 20-21.