Greenland Ice Sheet contribution to sea-level rise from a new-generation ice-sheet model
Texto
Imagem

Documentos relacionados
Consequences of a warmer climate on the Greenland Ice Sheet (GrIS) mass balance will be a thickening inland, due to increased solid precipitation, and a thinning at the GrIS
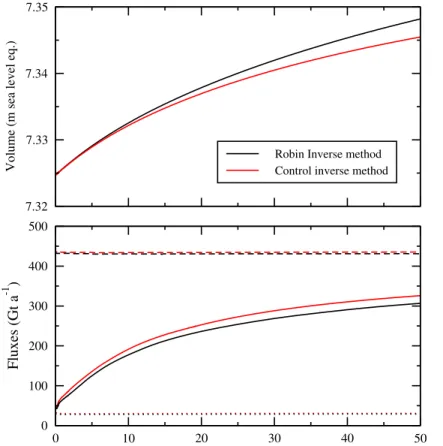
We have described and demonstrated a new procedure for generating 1850 preindus- trial ice sheet states for use in fully coupled ice-sheet/climate models which results in
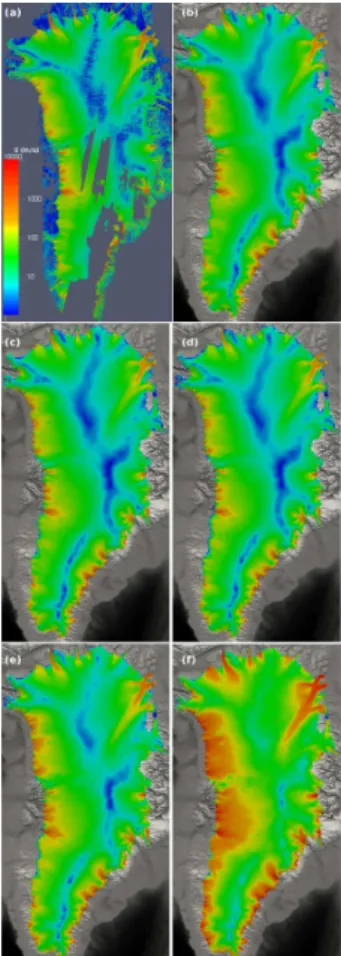
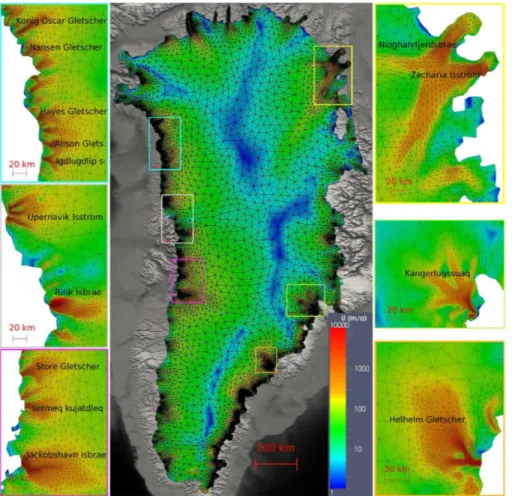
We apply the method to calculate depth-averaged ve- locities of the Greenland Ice Sheet, and find that the method produces grid-independent velocity fields for a sufficient
Dashed and dotted blue lines correspond respectively to the raw and to the downscaled CNRM-CM5.1 simulations, red and green solid lines correspond respectively to Crocus
The SMB anomaly projection for k = a/b =− 1 as well as the cumulated sea level rises equivalent are shown in Fig. This record surface mass loss rate is likely to become com- mon at
and Marsiat, I.: Simulations of the Northern Hemisphere through the last glacial- interglacial cycle with a vertically integrated and a three-dimensional thermomechanical ice-
decreases the temporal variability and increases the correspondence with RACMO2. Interesting feature in this figure is the northern marginal areas where the fraction is larger than
calculated using di ff erent values of mean annual temperature as input for the PDD model, but to facilitate comparison with the SMB gradient method, the results are plot- ted as
