Original Article
Artigo Original
Flávia Pereira da Costa1 Giovana Diaféria1,2,3 Mara Behlau1,2
Keywords
Voice Speech Dysphonia Protocols Parkinson’s Disease
Descritores
Voz Fala Disfonia Protocolos Doença de Parkinson
Correspondence address: Flávia Pereira da Costa Centro de Estudos da Voz
Rua Machado Bittencourt, 361, 10o
andar, Vila Mariana, São Paulo (SP), Brazil, CEP: 04044001.
E-mail: [email protected] Received: 03/04/2015
Accepted: 07/16/2015
Study carried out at the Universidade Federal de São Paulo – UNIFESP – São Paulo (SP), Brazil. (1) Universidade Federal de São Paulo – UNIFESP – São Paulo (SP), Brazil.
(2) Center for Voice Studies – CEV – São Paulo (SP), Brazil. (3) Associação Brasil Parkinson – ABP – São Paulo (SP), Brazil.
Financial support: Coordenação de Aperfeiçoamento de Pessoal de Nível Superior – CAPES. Conlict of interests: nothing to declare.
Communicative aspects and coping strategies in
patients with Parkinson’s disease
Aspectos comunicativos e enfrentamento da disfonia em
pacientes com doença de Parkinson
ABSTRACT
Purpose: To investigate, in patients with Parkinson’s disease (PD), the coping strategies; the most reported vocal symptoms; and the relation between coping, voice symptoms, and communicative aspects. Methods: Seventy-three subjects were included in the sample, 33 of which were participants in the experimental group (EG) with diagnosis of PD and 40 were control subjects, that is, healthy and without vocal complaints. They underwent the following procedures: application of Voice Symptoms Scale (VoiSS), Brazilian Version; Voice Disability Coping Questionnaire (VDCQ), Brazilian Version; and the questionnaire Living with Dysarthria (LwD). Results: The EG presented deviations in all protocols: VDCQ, with the most frequently coping strategy being “selfcontrol,” VoiSS, with “Impairment” as the most prevalent domain, and LwD, presenting changes in all sections. Vocal signs and symptoms and communicative aspects were shown to have a regular correlation with coping. The correlation between vocal symptoms and communicative aspects was as follows: the greater the impairment in communication, the greater the VoiSS emotional scores and the more they complaint of voice-related signs and symptoms. Conclusion: Patients with PD use all kinds of coping strategies, but prefer using self-control. They present several vocal signs and symptoms, and “Impairment” was the most prevalent domain. There are dificulties in all aspects of communication. The higher the occurrence of vocal signs and symptoms, the more the patient reports the dificulties of living with dysarthria, particularly when deviations affect the emotional domain.
RESUMO
INTRODUCTION
Parkinson’s disease (PD) is a disorder that causes problems widely described in bodily engines such as bradykinesia, ri-gidity and resting tremor, and also affects various subsystems involved in the speech process, by hypokinetic dysarthria(1,2).
Almost 90% of patients have problems related to oral com-munication(3), but the voice is affected more quickly and more
often than other subsystems(4) and can be the initial symptom.
One-third of patients suffers from dysphonia and presents hoarseness and breathy voice as the most impacting deicit(5).
Usually, communication problems are not caused only by vocal problems, but also by losses relected in language due to dementia, whose prevalence is estimated in 20–40% of cases(6), as well as changes in language without association
with dementia, which demands special attention from the speech therapist(7).
Treatment of speech and voice disorders in people with PD has been a challenge for professionals, both doctors and speech therapists, and current treatments consist of neuropharmacologi-cal therapies, neurosurgineuropharmacologi-cal procedures, speech therapy through the approach Lee Silverman Voice Treatment (LSVT® LOUD),
which generated data of eficacy and success in the treatment of voice and speech disorders in this population(8), or a combination
of methods(9,10). Although there are scientiically proven methods
for voice therapy for these individuals, more data on their own perception of voice and communication problem are needed to direct the focus and enhance the therapeutic success.
In recent years, focus have been given to the development and validation of vocal self-assessment questionnaires with different conceptual approaches and evaluative criteria such as quality of life, voice handicap, limitation and restriction on activities, vocal performance, or vocal symptoms(11). They were
spread in speech therapy practice as good tools to bring about data on vocal assessment from the patient’s point of view, making it important for the therapeutic process to know how these individuals cope with such changes.
Thus, we selected three protocols for this population: the
Protocolo de Estratégias de Enfrentamento das Disfonias (PEED-BR)(12), a version translated and adapted from Voice
Disability Coping Questionnaire (VDCQ)(13); the Escala de
Sintomas Vocais (ESV)(11), validated for Brazilian Portuguese
(BP) from Voice Symptom Scale (VoiSS)(14); and the
Questionário Vivendo com Disartria (VcD)(15), translated and
adapted from the original Living with dysarthria (LwD)(16).
The use of these three instruments allow us to check how individuals face a vocal problem, what the main vocal symp-toms are, and how they live with the problems affecting their com-munication skills, giving them more information on their quality of life and helping in their vocal treatment by implementing strategies focused on limitations and coping.
The aim of this study was, therefore, to investigate the coping strategies used by individuals with PD, the most com-monly reported vocal symptoms, the most common problems of communication, and the relationship between coping strategy, vocal symptoms and communicative aspects.
METHODS
The study was approved by an institutional Research Ethics Committee (CEP UNIFESP 86962/12) and all participants signed the informed consent.
Study participants were 73 individuals, 33 allocated in the experimental group (EG) — aging between 45 and 93 years, mean age of 73.96 years (SD = 10.0), 18 men and 15 women — and 40 subjects in the control group (CG), aging from 53 to 99 years, mean age 72.4 years (SD = 10.9), 20 men and 20 women.
Inclusion criteria for EG were diagnosis of PD performed by a neurologist in stages II and III, according to Hoehn & Yahr scale(17); being stable with their speciic medications and
presenting hypokinetic dysarthria with focus on dysphonia; conirmation by the perceptual analysis of the general degree of vocal deviation; and also the self-assessment of voice quality through a ive-point scale with the following items: excellent, very good, good, fair, and poor. The hearing perceptual analy-sis was performed by an audiologist specialized in voice, which showed mean degree of deviation as “moderate” (average 65.5 on a 100-point scale)(18), and “reasonable”
was the most common response upon vocal self-assessment (75.8%), both demonstrating the presence of vocal devia-tion in individuals with PD.
In CG, inclusion criteria were being a healthy individual, absence of any type of neurological diagnosis, having the same demographic characteristics of EG, and absence of vo-cal complaints.
Exclusion criteria were the same for both groups: hav-ing other laryngeal lesions, no interest or availability to participate in the research, having cognitive disorders and/ or psychiatric disorders that could hinder the protocol ap-plication, and/or not understanding instructions. We checked the risk for dementia using the Informant Questionnaire on Cognitive Decline in the Elderly (IQCODE)(19,20), which is
an instrument suggested by the Diagnostic and Statistical Manual of Mental Disorders (DSM-IV) for screening demen-tia, comprising 16 items in which the informer (caregiver or family) evaluates the patient’s current performance in different situations of daily life compared to that observed 10 years earlier. Because of this criterion, there was a loss of 14% of individuals with PD, so the inal sample comprised 33 individuals, as mentioned above.
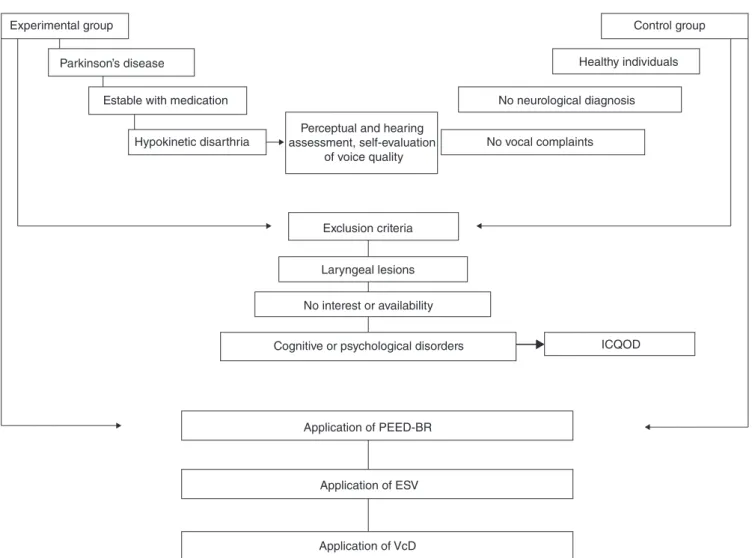
All participants went through the following: application of PEED-BR(12), ESV(11), and VcD(15). The term “communicative
aspects” comprises ESV(11) and VcD(15). The exempliication
of sampling and procedures applied in both groups are shown in Figure 1.
PEED-BR(12) was applied to check the coping strategies
used by each group, which is a version translated and adapted from the VDCQ protocol(13). The protocol consists of 10
ESV(11) was used to collect voice signs and symptoms
(vali-dated Brazilian–Portuguese version of VoiSS(14), which is an
instrument composed of 30 questions comprising three areas: limitation, emotional features, and physical features. Currently, we know that it has a cut-off point on the ROC curve of 16 points, which differentiates dysphonic from healthy people(11).
The higher the scores, the greater is the perception of the overall level of voice change with regard to the limitation in their use, emotional reactions, and physical symptoms.
The impact of dysarthria in different situations of commu-nication was veriied by the VcD Questionnaire(15), which has
been translated and adapted from the original LwD(16), which
comprises 50 questions divided into 10 sections.
Statistical analysis was performed by comparison between groups and correlations between the protocols used. ANOVA, Pearson correlation, and correlation were applied. The signii-cance level for this study was set at 5% (0.05).
RESULTS
There were signiicant differences between groups as to all protocols used in this research.
In PEED-BR(12), all kinds of coping strategies and the total
score had higher scores in the EG (p<0.001), average of 17.45 (Table 1), and the most used coping strategy was “self-control.”.
In ESV(11), the EG showed signiicant differences compared
to CG (p<0.001), with higher scores in total score (average 45.48) and in all areas of the scale (Table 2). In the EG, the most affected area was the “Limitations” (average 27.88).
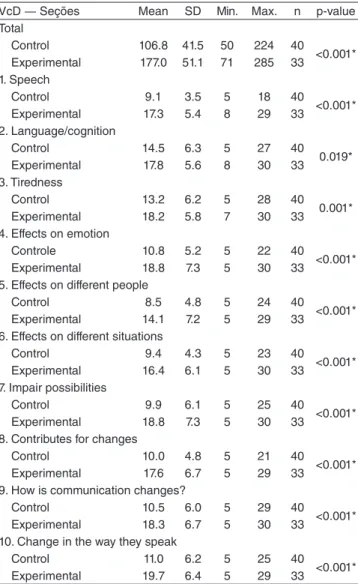
The VcD Questionnaire(15) could distinguish groups in all
sections, with the highest scores in EG, average of 177.0 (Table 3). When comparing sections, the average differences between the 10 sections were not considered signiicant in EG, with emphasis on communication dificulties in different aspects in PD patients.
Experimental group
Parkinson’s disease
Estable with medication
Hypokinetic disarthria
Perceptual and hearing assessment, self-evaluation
of voice quality
Control group
Healthy individuals
No neurological diagnosis
No vocal complaints
Exclusion criteria
Laryngeal lesions
No interest or availability
Cognitive or psychological disorders ICQOD
Application of PEED-BR
Application of ESV
Application of VcD
Figure 1. Casuistry and procedures applied in control and experimental groups
Correlations were regular between the results obtained in PEED-BR(12) and scores of ESV(11) and VcD(15) (Table 4).
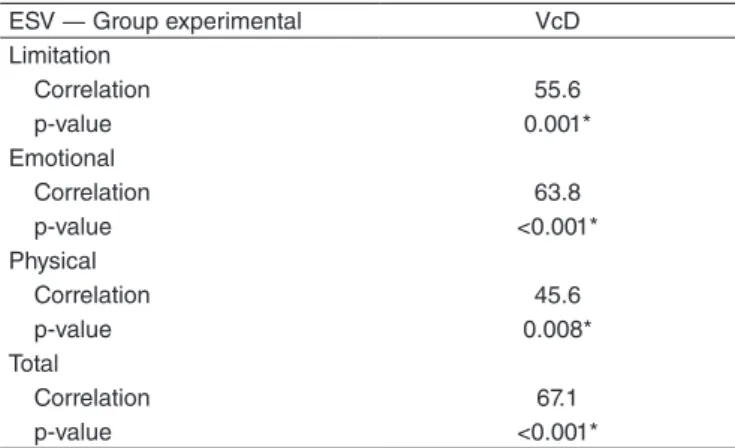
Between VcD(15) and ESV(11), there is a good correlation
between the total score of VcD(15) and the total score and the
emotional domain of ESV(11) (Table 5).
DISCUSSION
Oral communication is key in education, at work, in social life, and self-expression of an individual. The prevalence of communication disorders in about 7 million people with PD is particularly high (89%)(10).
The voice is among the irst disorders shown in such cases, and can lead individuals to experience social isolation, depres-sion, loss of overall quality of life, and work absenteeism.(21)
General quality of life protocols have shown greater impair-ment in individuals with vocal disorders compared to normal controls, with a worsening of physical, social, and emotional functions, and also mental health(21,22).
However, not only the voice or other subsystems described in hypokinetic dysarthria(1,2) such as breathing, resonance,
ar-ticulation, and prosody cause a loss in communication. Other factors may also have a negative effect, such as deicits in language and cognition. It is thus necessary to apply protocols of different approaches in order to better describe the damage caused in patients’ lives.
PEED-BR(12) shows how an individual copes with a
vocal disorder. Coping is the cognitive and behavioral strategy the individual uses to deal with the stress caused by a situation, which can be accomplished through thoughts or actions and can change according to different times of the same stressful situation(12,13,23).
Coping strategies can be divided into emotional and cogni-tive strategies(12,23). Individuals who use emotional strategies
tend to use tools that help them control the emotion or to relieve
PEEDBR scores Mean SD Min. Max. n p-value Seeking information
<0.001* Control 0.90 2.09 0 8 40
Experimental 4.03 2.87 0 10 33 Resignification
<0.001* Control 0.83 1.71 0 6 40
Experimental 3.06 2.69 0 10 33 Self-control
<0.001* Control 2.60 4.14 0 15 40
Experimental 6.48 3.89 0 14 33 Avoidance/passivity
0.026* Control 1.98 3.42 0 10 40
Experimental 3.88 3.72 0 12 33 Total
<0.001* Control 6.30 9.82 0 31 40
Experimental 17.45 9.77 0 37 33
Table 1. Scores of protocols of coping strategies for disphonia in experimental and control group
*Significant value (p<0.05) ― ANOVA.
Caption: PEEDBR = Protocolo de Estratégias de Enfrentamento nas Disfonias; SD = standard deviation
Scores ESV Mean SD Min. Max. n p-value
Limitation
<0.001* Control 10.85 8.73 0 35 40
Experimental 27.88 9.89 13 49 33
Emotional
<0.001* Control 0.88 1.71 0 8 40
Experimental 9.33 7.3 0 23 33 Physical
0.036* Control 6.33 3.92 0 15 40
Experimental 8.27 3.81 2 21 33
Total
<0.001* Control 18.05 11.83 0 49 40
Experimental 45.48 17.74 18 91 33
Table 2. Total scores and scores according to domains of Escala de sintomas vocais for experimental and control groups
*Significant value (p<0.05) ― ANOVA.
Caption: SD = standard deviation; ESV = Escala de Sintomas Vocais
VcD ― Seções Mean SD Min. Max. n p-value Total
Control 106.8 41.5 50 224 40
<0.001* Experimental 177.0 51.1 71 285 33
1. Speech
Control 9.1 3.5 5 18 40
<0.001* Experimental 17.3 5.4 8 29 33
2. Language/cognition
Control 14.5 6.3 5 27 40 0.019* Experimental 17.8 5.6 8 30 33 3. Tiredness
Control 13.2 6.2 5 28 40 0.001* Experimental 18.2 5.8 7 30 33 4. Effects on emotion
Controle 10.8 5.2 5 22 40
<0.001* Experimental 18.8 7.3 5 30 33
5. Effects on different people
Control 8.5 4.8 5 24 40
<0.001* Experimental 14.1 7.2 5 29 33
6. Effects on different situations
Control 9.4 4.3 5 23 40
<0.001* Experimental 16.4 6.1 5 30 33
7. Impair possibilities
Control 9.9 6.1 5 25 40
<0.001* Experimental 18.8 7.3 5 30 33
8. Contributes for changes
Control 10.0 4.8 5 21 40
<0.001* Experimental 17.6 6.7 5 29 33
9. How is communication changes?
Control 10.5 6.0 5 29 40
<0.001* Experimental 18.3 6.7 5 30 33
10. Change in the way they speak
Control 11.0 6.2 5 25 40
<0.001* Experimental 19.7 6.4 5 29 33
Table 3. Scores of the questionnaire Vivendo com disartria for experimental and control groups
*Significant value (p<0.05) ― ANOVA.
it, that is, they use affective strategies to deal with stress. Those who use cognitive coping strategies deal with the problem seeking solutions that change the cause of stress, for example, seeking medical advice(12,13,24).
There were signiicant differences in scores between groups regarding PEED-BR(12). All kinds of coping strategies such as
search for information, self-control, reframing, and avoidance/ passivity had higher scores in the EG. In total score (Table 1), the EG also had higher scores compared to the CG.
When comparing strategies in EG only, the most used coping method was “self-control” (Table 1), which means that individuals need to make an effort to regulate their feelings and actions(12). This strategy is part of the emotional approaches,
in which tools are used to control the emotion or alleviate it; in other words, patients use an effective resource to handle stress(12,13,24).
Although the unfavorable impact of voice disorders on quality of life has received much attention recently, little is known about the vocal symptoms that occur and what are the main factors responsible for the drop in overall quality of life(25).
This aspect is little investigated in voice clinics, but can be a useful tool in the therapeutic process.
Using ESV(11), EG has signiicant differences compared to
CG, with higher scores in total score and in all areas of the scale (Table 2). Analysis of EG only shows that the most affected area is “limitation,” which features vocal dificulties present in this group due to hypokinetic dysarthria, such as talking down/ weak and hoarse voice(1,2), with emphasis on other important
symptoms such as dificulty in calling people’s attention, talk-ing in noisy places, vocal fatigue, among others.
The average vocal signs and symptoms in EG was 45.48 points (Table 2), in a total of 120, and the cut-off note that dif-ferentiates patients with vocal problems from those without it, was 16 points(11); thus, the average in EG was nearly three times
higher than the cut-off value. In CG (mean age 72.4 years), mean value was 18.05 points; however, this protocol does not have cut-off values for a speciic population of seniors, only for the general population. Although vocal complaints or neu-rological problems were not reported, one should not dismiss vocal disorders related to age, since these are common among older people (prevalence of 29%), even without a laryngeal diagnosis(26). Therefore, more speciic self-assessment
ques-tionnaires and cut-off points for this age group should also be used because it can provide more accurate data on a possible vocal problem.
Gathering these data, namely, the limiting factors of vocal signs and symptoms with the fact that patients predominantly use a coping strategy with more focus on emotion, the probable cause of dificulties and challenges encountered during their rehabilitation process is therefore understood.
As the voice is not the only parameter that impairs oral communication in patients with PD, the VcD Questionnaire(15)
was applied to check, beyond the communicative self-reported deicits, its correlation with the other protocols in our study. The VcD(15) distinguished the groups in all sections with the
highest scores in the EG (Table 3). Although this protocol has not been validated, the original one or in Portuguese, the ver-sion used in this study was translated and culturally adapted for Brazilian Portuguese. An important aspect that allows to consider the results as at least suitable is that obtained an av-erage 177 points, from a total of 300, which is similar to that found in the application of this questionnaire in one speciic population(15,27).
In EG, comparing sections, average differences between the 10 sections are not signiicant, although the numerical values are very different (as seen in questions 1, 7, and 10, where
PEED-BR
VcD ― Total Score
ESV
Limitation Emotional Physical Total
Seeking information
Correlation 20.5 57.1 35.8 16.5 50.1 p-value 0.252 0.001* 0.041* 0.358 0.003* Resignification
Correlation 27.7 18.8 26.4 41.0 30.2 p-value 0.119 0.294 0.137 0.018* 0.088 Self-control
Correlation 33.4 36.6 41.2 18.5 41.3 p-value 0.058 0.036* 0.017* 0.303 0.017* Avoidance/passivity
Correlation 41.4 36.8 27.0 19.4 35.8 p-value 0.017* 0.035* 0.128 0.279 0.041* Total
Correlation 42.7 50.6 44.5 30.9 53.1 p-value 0.013* 0.003* 0.009* 0.080 0.001* Table 4. Correlation of the Protocolo de Estratégias de Enfrentamento das Disfonias with Vivendo com Disartria and Escala de Sintomas Vocais for the experimental group
*Significant value (p<0.05) ― Pearson’s correlation and correlation test. Caption: PEED-BR = Protocolo de Estratégias de Enfrentamento das Disfonias; VcD = Questionário Vivendo com Disartria; ESV = Escala de Sintomas Vocais
ESV ― Group experimental VcD Limitation
Correlation 55.6
p-value 0.001*
Emotional
Correlation 63.8
p-value <0.001*
Physical
Correlation 45.6
p-value 0.008*
Total
Correlation 67.1
p-value <0.001*
Table 5. Correlation of Vivendo com Disartria questionnaire and Escala de Sintomas Vocais for the experimental group
*Significant value (p<0.05) ― Pearson’s correlation and correlation test
Caption: VcD = Vivendo com Disartria questionnaire; ESV = Escala de
values are almost doubled), highlighting the communication dificulties in different aspects in PD patients.
Based on these results, one should not give attention only to vocal issues but also to covering the language and impairment in general communication, so we used this self-assessment questionnaire to help in the treatment.
Studies that have implemented self-assessment protocols for PD patients showed a decline in quality of life caused by vocal and communication disorders(15,27-29), showing that the greater
the intensity of the disease, the greater the dissatisfaction with one’s own voice(28). However, this correlation does not occur
with general communication(15), which is changed regardless
of disease progression.
Results obtained in PEED-BR(12) have regular correlation
with the scores of ESV(11) and VcD(15) (Table 4), indicating
that having voice-related signs and symptoms and problems in communication does not take the patient to use more cop-ing strategies. This can be explained by the fact that copcop-ing is a single factor that has more to do with the life story of the individual than with the signs and symptoms and aspects of communication for this population. The correlation between coping and vocal symptoms, but with the use of other speciic protocol, did not show results either even among patients with behavioral dysphonia(30).
This inding reinforces the need to educate the patient as to how voice signs and symptoms can be an important sign of voice overuse and how much it can increase the risk of a worsening in communications(30). It also shows that one
can-not ignore the approach of indirect therapy such as orientation and vocal hygiene, even in individuals with neurological and degenerative disease.
The correlation of VcD(15) with ESV(11) (Table 5) was
considered good between the total score of VcD and the total score and emotional ield of ESV, indicating that the greater the loss in communication, the more symptoms and signs are self-reported, and the greater emotional deicit is produced. Added to these results, sensory and perceptual dificulties found in PD patients may postpone the search for rehabilita-tion, stressing the importance of applying ESV and VcD, in order to actively pursue the perception of signs, symptoms, and their impact on quality of life.
PD has its symptoms extensively described and studied. Within the speech perspective, the main features and aspects of the disease are known to affect the voice and communication, but the assess-ment and, therefore, treatassess-ment should not be based only on general knowledge of what has already been pointed out in the literature. It is very important to know how patients cope with their voice and communication problems, how they deal with their voice symp-toms, which often fall short of those seen and characterized by the disease only, as well as how their communication is impacted, so that we can help them build a better quality of life.
CONCLUSION
PD patients use several coping strategies, with emphasis to “self-control.” They present many vocal signs and symptoms, with “limitation” being the most prevalent domain. They ind
dificulties in all aspects of communication. We also noted that when the occurrence of vocal signs and symptoms is higher, particularly in the emotional domain, more patients report the dificulties of living with dysarthria.
ACKNOWLEDGMENT
To the Coordination for the Improvement of Higher Education Personnel (CAPES), for inancing this research.
*FPC participated in study design, data collection and analysis, and writing; GD participated in study design, data collection, and proofreading of the paper; MB participated in study design, data analysis, writing, and proofreading of the article.
REFERENCES
1. Darley FL, Aronson AR, Brown JR. Clusters of deviant speech dimensions in the dysarthrias. J Speech Hear Res. 1969a;12(3):462-96. 2. Darley FL, Aronson AR, Brown JR. Differential diagnostic patterns of
dysarthria. J Speech Hear Res. 1969b;12(2):246-69.
3. Zarzur AP, Duarte IS, Goncalves Gdo N, Martins MA. Laryngeal electromyography and acoustic voice analysis in Parkinson’s disease: a comparative study. Braz J Otorhinolaryngol. 2010;76(1):40-3.
4. Ho AK, Iansek R, Marigliani C, Bradshaw JL, Gates S. Speech impairment in a large sample of patients with Parkinson’s disease. Behav Neurol. 1998;11(3):131-7.
5. Sewall GK, Jiang J, Ford CN. Clinical evaluation of Parkinson’s related dysphonia. Laryngoscope. 2006;116(10):1740-4.
6. Cummings JL. Intellectual impairment in Parkinson’s disease: clinical, pathologic, and biochemical correlates. J Geriatr Psychiatry Neurol. 1988:1(1):24-36.
7. Prieto F, Radanovic M, Schmitt C, Barbosa ER, Mansur LL. Compreensão de sentenças na doença de Parkinson. Dement Neuropsychol. 2007;1(4):386-91.
8. Ramig LO, Pawlas A, Countryman S. The Lee Silverman Voice Treatment (LSVT): A Practical Guide to Treating the Voice and Speech Disorders in Parkinson Disease. Yowa: National Center for Voice and Speech; 1995. 9. Schultz GM, Grant MK. Effects of speech therapy and pharmacologic
and surgical treatments on voice and speech in Parkinson’s disease: a review of the literature. J Commun Disord. 2000;33(1):59-88.
10. Ramig LO, Fox C, Sapir S. Speech treatment for Parkinson’s disease. Expert Review of Neurotherapeutics. 2008;8(2):297-309.
11. Moreti F, Zambon F, Oliveira G, Behlau M. Crosscultural adaptation, validation, and cutoff values of the Brazilian Version of Voice Symptoms Scale VoiSS. J Voice. 2014;28(4):458-68.
12. Oliveira G, Hirani SP, Epstein R, Behlau M. Coping strategies in voice disorders of a Brazilian Population. J Voice. 2012;26(2):205-13. 13. Epstein R, Hirani SP, Stygall J, Newman SP. How Do Individuals
Cope With Voice Disorders? Introducing the Voice Disability Coping Questionnaire. J Voice. 2009;23(2):209-17.
14. Deary IJ, Wilson JA, Carding PN, MacKenzie K. VoiSS: a patientderived Voice Symptom Scale. J Psychosom Res. 2003;54(5):483-9.
15. Puhl A, Diaferia G, Padovani M, Behlau M. Autoavaliação das disartrias em pacientes com doença de Parkinson. Apresentado no 17º Congresso Brasileiro de Fonoaudiologia e 1º Congresso IberoAmericano de Fonoaudiologia; 2009 Out 21-24; Salvador, BA.
16. Hartelius L, Elmberg M, Holm SR, Lovberg AS, Nikolaidis S. Living with dysarthria: evaluation of a selfreport questionnaire. Folia Phoniatr Logop. 2008;60(1):11-9.
18. Yamasaki R, Leão S, Madazio G, Padovani M, Azevedo M, Behlau M. Correspondência entre escala analógicovisual e escala numérica na avaliação perceptivoauditiva de vozes. Apresentado no 16º Congresso Brasileiro de Fonoaudiologia; 2008 Set 24-27; Campos do Jordão, SP. Rev Soc Bras Fonoaudiol. 2008;13(supl.):1080.
19. Jorm AF. A short form of the Informant Questionnaire on Cognitive Decline in the Elderly (IQCODE): development and crossvalidation. Psychol Med. 1994;24:145-53.
20. Sanchez MAS, Lourenço RA. Informant Questionnaire on Cognitive Decline in the Elderly (IQCODE): adaptação transcultural para uso no Brasil. Cad Saúde Pública. 2009;25(7):1455-65.
21. Cohen SM, Dupont WD, Courey MS. Qualityoflife impact of nonneoplastic voice disorders: a metaanalysis. Ann Otol Rhinol Laryngol. 2006;115(2):128-34.
22. Benninger MS, Ahuja AS, Gardner G, Grywalski C. Assessing outcomes for dysphonic patients. J Voice. 1998;12(4):540-50.
23. Lazarus RS, Folkman S. Stress, appraisal and coping. New York: Springer Publishing Company; 1984.
24. Folkman S, Lazarus RS. Manual for the ways of coping questionnaire. Palo Alto, CA: Consulting Psychologist Press; 1980.
25. Merrill RM, Roy N, Lowe J. Voicerelated symptoms and their effects on quality of life. Ann Otol Rhinol Laryngol. 2013;122(6):404-11. 26. Roy N, Stemple J, Merrill RM, Thomas L. Epidemiology of voice
disorders in the elderly: preliminary findings. Laryngoscope. 2007;117(4):628-33.
27. Padovani M, Behlau M. Medidas perceptivoauditivas e acústicas de voz e fala e autoavaliação da comunicação nas disartrias [tese]. São Paulo: Universidade Federal de São Paulo; 2011.
28. Silva LF, Gama AC, Cardoso FE, Reis CA, Bassi IB. Idiopathic Parkinson’s disease: vocal and quality of life analysis. Arq Neuropsiquiatr. 2012;70(9):674-9.
29. Louis ED, Gerbin M. Voice handicap in essential tremor: a comparison with normal controls and Parkinson’s disease. Tremor Other Hyperkinet Mov (N Y). 2013; 3. pii: tre03-114-970-1.