0103 - 5053 $6.00+0.00
Article
* e-mail: [email protected]
Selection of a Commercial Anode Oxide Coating for Electro-oxidation of Cyanide
Marcos Roberto V. Lanza and Rodnei Bertazzoli*
Depto. de Engenharia de Materiais, FEM, Universidade Estadual de Campinas, CP 6122, 13083-970, Campinas - SP, Brazil
Este trabalho apresenta um estudo do desempenho de dois anodos comerciais de óxidos de metais nobres (DSA®) no processo eletroquímico para a oxidação de cianetos. Os revestimentos
estudados foram 70TiO2/30RuO2 e 55Ta2O5/45IrO2, em um substrato de Ti. A eficiência dos dois
materiais no processo de eletrooxidação de cianeto livre foi comparada usando a voltametria linear e a eletrólise a potencial constante. O eletrodo 70TiO2/30RuO2 apresentou a melhor eficiência na eletrooxidação de cianetos livres.
This paper presents a study of the performance of two commercial dimensionally stable anode (DSA®) oxide coatings in the electrochemical process for cyanide oxidation. The coatings studied
were 70TiO2/30RuO2 and 55Ta2O5/45IrO2, on Ti substrate. The efficiency of both materials in the electro-oxidation of free cyanide was compared using linear voltammetry and electrolysis at constant potential. The 70TiO2/30RuO2 electrode shows a better performance in the electro-oxidation of free
cyanide.
Keywords: electrolytic treatment of effluents, cyanide, cyanide electro-oxidation, dimensionally
stable anodes
Introduction
Inorganic cyanide has been used in the electroplating industry since the 19th century. The first proprietary
formulations for gold electrodeposition from cyanidric bath are from the 1830’s.1 Cyanide radical is one of the few
radicals capable of keeping gold in aqueous solution and coatings, obtained from plating baths containing cyanide, are homogeneous and bright. Considering these features, cyanidric electroplating processes were soon extended to silver and copper deposition. From 1850, zinc and cadmium coatings also started to be produced from cyanidric electrolyte.
In the last two decades, zinc has been successfully deposited in acidic baths2 and cadmium coatings are being
replaced by Zn-Ni alloys in the aircraft industry.3,4 Although
cyanide based electrolytes are being banned from the metal finishing industry, it is still possible to find cyano-complex baths and stripping solutions in use. 5 Precious metals
mining is also a hydrometallurgical process that greatly benefits from the complexing power of cyanide. Gold and silver are extracted from its ores as cyanidric complexes.5
Direct alkaline chlorinating or addition of hypo-chloride, conventionally treat aqueous streams containing free cyanide and its complexes. Detoxification occurs by oxidation of CN- to CNO-, CO
2, N2 and NH4. This treatment
is efficient in complying with the legislation for final discharge. However, the reactants are hazardous and unsafe to handle and to transport.
In this field, electrochemistry may offer an attractive alternative for treating cyanide by oxidation, via simulta-neous oxygen evolution, at an anode surface. Electrolytic process is probably the most adequate tool in the aqueous effluent treatment, ideally suited to the present age where environmental considerations are always to the fore.6
The key for an efficient electrolytic treatment is strongly based on the anode material choice. Dimensionally stable anodes, discovered by Beer in the seventies, 7,8 were widely
tested for bench scale experiments of oxidation of organic pollutants.9-11
The electrochemical oxidation processes onto DSA®
type oxide electrodes occur via oxygen atom transfer from water in the solvent phase to the oxidation product. The overall processes of anodic oxygen transfer may be represented by the generic reaction:10
where R is the reactant and the ROx is the oxidation product. In this mechanism the oxygen transfer occurs via the hydroxyl radical (OH*) formed on the electrode surface as a consequence of the intermediate step of the discharge of the water.19
Studies for cyanide electro-oxidation, using graphite, copper oxide, tin oxide, lead oxide, nickel, platinum, stainless steel and cobalt oxide anodes have been reported, with some of them presenting physical stability problems at high positive potentials.12-20 Even considering the knowledge gained with
these studies, we became interested in to investigate the performance of two commercial types of DSA® for cyanide
oxidation, considering that they are stable in high positive potentials. Furthermore, they are marketed in sizes and shapes especially suitable for scale up of the oxidation process.
In this paper, a study for the selection of a commercial anode oxide coating for cyanide electro-oxidation is presented. The first part, in which TiO2-RuO2 and Ta2O5 -IrO2 coatings are used as substrate for the oxygen evolution reaction, is followed by constant potential experiments of electro-oxidation of free cyanide in aqueous solution. Efficiency and catalytic activity of both materials are compared.
Experimental
Anode materials consisted of Ti machined blocks embedded in PTFE with 5 µm of oxide coating on a disc shaped exposed area of 0.12 cm2.These electrodes were
supplied by DeNora S.P.A. in Brazil to be used as rotating disc electrodes in the 616 EG&G rotating electrode module. The coatings used in this study are marketed as DSA-Cl2 and DSA-O2. Morphology of the oxide coatings, as well as the compositions were observed in a Jeol scanning electronic microscopy equipment, JXA840A model, equipped with an electron probe microanalyzer. Electrodes composition is a average value of five determinations.
Voltammetric and constant potential experiments were controlled by an EG&G PARC 273Apotentiostat and 270 Electrochemical Software. A three electrode, three compartment cells with hemispherical bottom was used. A large-surface platinum counter-electrode, and a saturated calomel reference electrode (SCE), within a Luggin capillary, were also used. Working electrode surfaces were degreased in acetone under sonication and then rinsed. Current-potential curves were taken from 0.0 V to 1.5 V at a scan rate of 10 mV s-1, and the working electrode was rotated at rates
of 400, 900, 1600, 2500 and 3600 rpm. Constant potential electrolysis was conducted at potentials ranging from 1.0 V to 1.5 V within time intervals of up to 12 h, at a rotation of 1600 rpm, at room temperature (25 °C).
Values of CN- concentrations were monitored by an
Orion ion selective electrode, model 9606BN. During electrolysis, at predetermined intervals, the solution was sampled and the remaining CN- concentration was
quantified in order to monitor the effectiveness of electrolysis.21
All chemicals were analytical grade without further purification. Supporting electrolyte consisted of H3BO3 0.05 mol L-1, NaOH 0.05 mol L-1 and Na
2SO4 0.05 mol L -1.
Cyanide was added in the concentration of 130 mg L-1
as NaCN. Solution pH was always 10 and conductivity, ≅ 10 mS cm-1. All solutions were prepared with distillated
and deionized water.
Results and Discussion
Oxide coating analysis
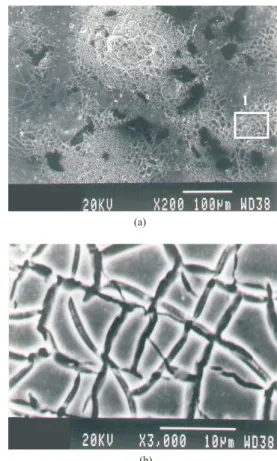
SEM analysis using EDX microprobe revealed a surface mass percentage composition of 70TiO2-30RuO2 (DSA-Cl2) and 55Ta2O5-45IrO2 (DSA-O2) which, from now on, will be referred to as Ti-Ru electrode and Ta-Ir electrode, respectively. Figures 1 and 2 show images of both coatings
magnified 200X and 3,000X. Characteristic cracked-mud appearance can be observed for both, titanium/ruthenium oxide layer (Figures 1a and 1b) and for tantalum/iridium oxide (Figures 2a, 2b and 2c). The first morphology is more homogeneous in which cracked regions prevail. For the tantalum/iridium system, two distinct regions appear in Figure 2a. The cracked-mud like oxide surface (Figure 2b) alternates with iridium oxide crystallites (Figure 2c), as previously reported in literature.22
Hydrodynamic cyclic voltammetry
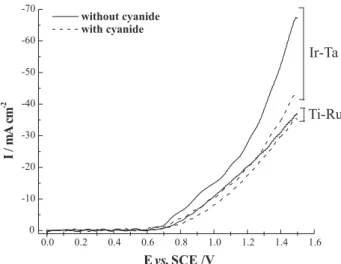
Figure 3 shows a series of voltammograms obtained in the hydrodynamic mode for the solution without cyanide. The potential was cycled between 0.0 and 1.5 V on the dimensionally stable rotating disc electrodes (DSRDE) using different rotation rates. As a common feature both voltammograms show waves for the oxygen evolution in the absence of cyanide. The values of current density were dependent on the DSRDE rotation rate. This behavior is characteristic of a gas bubbles removal controlled process. Oxygen removal from the electrode surface becomes more effective as rotation rate increases, avoiding electrode area insulation. Figure 3 also show greater current densities for the Ta-Ir electrode and, at the potential of 1.5 V, current
densities are twice greater than those obtained on the Ti-Ru electrode. Overpotential for oxygen evolution is lower on Ta-Ir electrode and at the potential of 0.65 V hydroxyl oxidation has already commenced, while no currents are observed at this potential, for the Ti-Ru electrode. Current values for oxygen evolution, in the voltammograms of Figure 3, were taken using a solution without cyanide. In the presence of the specie to be indirectly oxidized, current values tend to be a bit lower than those obtained in the supporting electrolyte. This effect can be observed in Figure 4, which is in good agreement with the mechanism found in the literature (see Equations 5-8).11
Voltammograms from Figure 3 are still useful for the comparison between electrode activities for the oxygen evolution reaction. The more catalytic electrode for the oxygen evolution reaction should show poor performance Figure 2. Morphology of the 55Ta2O5-45IrO2 coating. (a) general
view- 200X, (b) cracked-mud like structure- 3,000 X (zoom view of region 1) and (c) crystals of IrO2- 3,000 X (zoom view of region 2)
Figure 3. I-E curves for oxygen evolution on 70TiO2-30RuO2 and 55Ta2O5-45IrO2 surface. Scan rate of 10 mV s-1. Rotation rates are (a) 400, (b) 900, (c) 1,600, (d) 2,500 and (e) 3,600 rpm
during electrolization of an aqueous solution for the abatement of cyanide (see Equations 5-8).11 I-E values from
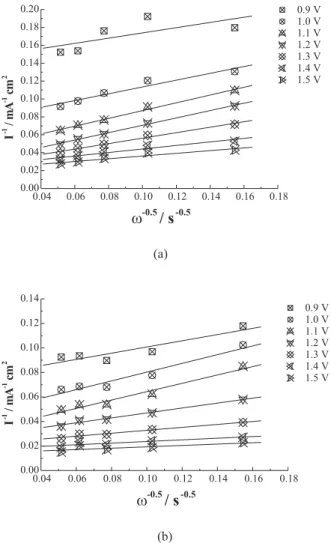
those voltammograms of Figure 3 were organized into pseudo Koutechy-Levich plots, as shown in Figure 5 (a and b). In this figure, 1/I values, taken at a fixed potential, were plotted as a function of the inverse of the rotation rate square root (1/ω0.5). This plot usually is an efficient means
of separating the mass transfer effects from the charge transfer effects, since the slope is related to the limiting currents and the intercept is the inverse of the kinetic current,23 as shown by Equation 2:
5 . 0 17 . 0 67 . 0 1 . 62 . 0 1 1 1 ω γ C nFD C nFAk
I = app + (2)
where C is the electroactive specie concentration, D and γ are diffusion coefficient and solution kinematic viscosity, respectively. kapp is the apparent rate constant for oxygen evolution on the anode surface. In these considerations,
this equation is not being applied as was rigorously deduced, since, in the discharge of water there is no mass transfer limitations at all. However, kinetic currents for oxygen evolution are limited for the removal rate of gas bubbles from the anode surface. In this analysis, C, in the second term on the right side of Equation 2, should be proportional to the anode surface coverage or equal to θΓ, where θ is the fraction of the anode surface covered by oxygen and Γ is the O2 saturation concentration on the surface. Γ has unity of concentration while θ is dimensionless. The diffusion coefficient in Equation 2 is related to the specie already oxidized (O2) on the anode surface. Summarizing, we are using Equation 2 with the first term on the right side relating to the specie to be oxidized (OH-) and the second, to the specie already
oxidized (O2). Extrapolation of ω values to infinite in Equation 2 leads to pure kinetic current values for oxygen evolution in an O2 bubbles free surface. After having eliminated the effect of the blocking of the anode surface area by oxygen, this procedure can be a good tool to decide whether or not an anode material is a promising material for electrolytic treatment of aqueous effluents, with feasible performance and efficiency. Lower overpotential material for oxygen evolution, which should present better performance for cyanide oxidation, may be identified by comparing the intercept values in Figure 5 and rearranging them as follows:
Ru Ti app Ir Ta app Ir Ta Ru Ti k k b b − − − − = (3)
where b is the intercept value taken at a fixed potential. Extrapolation of the electrode rotation rates to infinite shows that the Ta-Ir electrode appears to be more catalytic for the oxygen evolution reaction than the Ti-Ru electrode. Table 1 shows kinetic current densities for oxygen evolution reaction obtained from the intercepts in Figure 5, in which the ITa-Ir/ITi-Ru ratio is equal to the term at right
in Equation 3. Data from Table 1 shows that the iridium electrode presents higher current values for the oxygen
Figure 5. Pseudo Koutechy-Levich plots for the potential values shown, using data from Figure 3 for (a) 70TiO2-30RuO2 and (b) 55Ta2O5-45IrO2 anodes
Table 1. Kinetic current densities for the oxygen evolution reaction at the potentials shown, for both oxide electrodes
E vs SCE /V ITi-Ru /mA cm-2 ITa-Ir /mA cm-2 ITa-Ir /ITi-Ru
0.9 5.3 8.3 1.6
1.0 9.5 13.5 1.4
1.1 15.5 19.6 1.3
1.2 24.6 30.7 1.3
1.3 36.7 42.8 1.2
1.4 50.9 59.6 1.2
evolution reaction within the range of potentials considered in this study. For the higher values of potential, apparent rate constant ratio reaches a constant value such that kappTa-Ir = 1.2 k
app Ti-Ru.
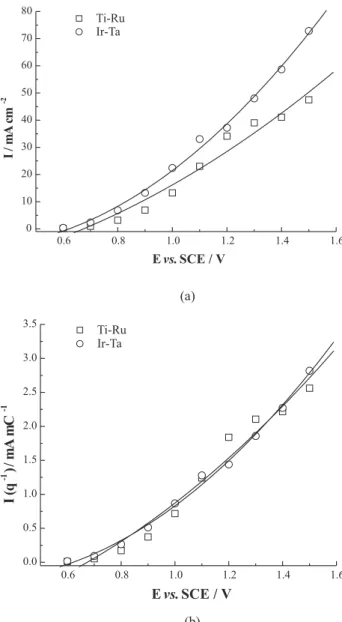
Figure 6a shows a reconstruction of the voltammograms for both electrodes using the kinetic currents presented in Table 1. In this figure, Ta-Ir electrode present higher current density values than Ti-Ru electrode. However, by eliminating the area effect, dividing current values by voltammetric charge,24-27 the response of current curves
for both electrodes overlap and points out to a similar catalytic activity for oxygen evolution. The normalized voltammograms, in Figure 6b, shows the same catalytic activity for both electrodes. Results obtained so far do not
allow a decision on which oxide coating should present better performance for cyanide oxidation.
In order to differentiate the catalytic activity for cyanide oxidation of both electrodes a new series of experiments has been carried out in which solutions containing the pollutant were electrolyzed at constant potential.
Constant potential electrolysis
Both electrodes were then used for electrolysis of 130 mg L-1 of CN- solutions, at constant potential. Figures 7
and 8 show cyanide normalized concentration decay as a function of electrolysis time and applied potential, for the electrodes of Ti-Ru and Ta-Ir, respectively. As stated earlier, decaying of cyanide concentration is due to oxygen atom transfer from water, in the solvent phase, to the oxidation product (cyanate). The overall processes of anodic oxygen transfer to cyanide ions may be represented, according to the follow equation:
Figure 6. (a) Reconstructed I-E curves using the intercept values for Figure 5. (b) Reconstructed I-E curves for oxygen evolution nor-malized by the anodic charge the 70TiO2-30RuO2 and 55Ta2O5 -45IrO2 surface
Figure 8. Normalized cyanide concentration decay during constant potential electrolysis at potential shown for the 55Ta2O5-45IrO2 anode
CN- + H
2O → CNO
- + 2 H+ + 2 e- (4)
and on DSA type oxide electrode the oxygen transfer follows the equations as below: 11
MOx + H2O → MOx(OH*) + H+ + e- (5)
MOx(OH*) → MO x+1 + H
+ + e- (6)
MOx+1 + CN-→ CNO- + MO
x (7)
The competitive process O2 evolution also takes place as
MOx+1→ ½ O2 + MOx (8)
A comparative observation of Figures 7 and 8 shows that, for the Ti-Ru electrode, the electrolytic process presents an increasing cyanide removal rate from 1.1 V to 1.2 V. Similar behaviour is observed on the Ta-Ir electrode surface for the range of 0.9 V to 1.1V. However, from those potential values, removal rate starts to decrease propor-tionally as electrolysis potentials are made higher. This fact can be better understood following the evolution of the rate constant for cyanide decay.
Assuming a cyanide first order decay, removal rate can be written as
) ( ) (
t KC dt
t dC =−
(9)
and the simple batch solution results in
C(t) = C(0) exp – Kt (10)
where K = kA V-1 and, k is the apparent rate constant for
cyanide removal (m s-1), A is the geometric electrode area
(m2) and V, is the volume of electrolyte (m3).
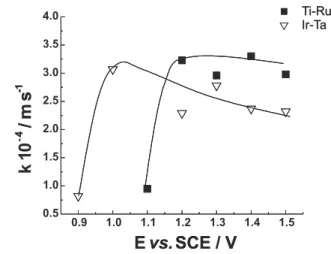
Values of kCN were calculated from the slope in the linear plot of ln(C(t)/C(0)) versus t, using data taken from Figures 7 and 8. Figure 9 shows these values plotted against electrolysis potentials. Comparison between curves from Figure 9 shows that apparent rate constants for cyanide oxidation are greater for the Ti-Ru electrode, as was expected. Both curves present increasing values of the rate constant for low potential values. At a certain potential value, k stopped increasing, reaching a constant value or even showing a slight decrease. This can be due to a unilateral improvement in the rate of oxygen evolution without any benefit to the cyanide oxidation rate. In the
potential range of 1.2 V to 1.5 V, Ti-Ru electrode is more catalytic for cyanide oxidation and rate constant ratio for cyanide oxidation is:
kTi–Ru = 1.3kTa–Ir (11)
As a final consideration, the amount of time demanded for cyanide concentration decay depicted in Figures 7 and 8, may be the object of questioning with regards the feasibility of such electro-oxidation process for practical applications. The reason for this is the unfavorable ratio electrode area/volume of the solution, or A/V (see Equation 9) used in this work, that was 0.24 while greater values of 9and 20can be found in literature. 12,13
Conclusions
Electrochemical processing may be an efficient means of controlling free cyanide concentration in aqueous streams while avoiding transport, storing and handling of highly oxidant hazardous reactants. Results obtained in this work have shown that TiO2/RuO2 anodes present better performance in the electro-oxidation of cyanide solutions when compared to Ta2O5/IrO2 anodes.
References
1. Brenner, A.; Electrodeposition of alloys – Principles and Prac-tice, Academic Press: New York, 1963.
2. Dangelo, M. P.; Plat. Surf. Finish. 1986, 73, 20. 3. De, H.; Plat. Surf. Finish.1983, 70, 59.
4. Danks, L.; Aircraft Engineering and Aerospace Technology
1995, 67, 10.
5. Gabe, D. R.; Trans IMF1997, 70, 59.
6. Rajeshwar, K.; Ibanez, J. G.; Environmental Electrochemistry: Fundamentals and Applications in Pollution Sensors and Pol-lutant Treatment, Academic Press: USA, 1997.
7. Beer, H. B.; US pat. 3,632,498 1972.
8. De Nora, O.; Nidola, A.; Trisoglio, G.; Bianchi, G.; British pat 1,399,576 1973.
9. Correa-Lozano, B.; Comninellis, Ch.; De Battisti, A.; J. Appl. Electrochem. 1997, 27, 970.
10. Savall, A.; Chimia1995, 49, 23.
11. Comninellis, C. In Environmental Oriented Electrochemistry; Sequeira, C.A.C. ed.; Elsevier: Amsterdam, 1994, p.77-101. 12. Fugivara, C. S.; Sumodjo, P. T. A.; Cardoso, A. A.; Benedetti,
A. V.; The Analyst1996, 121, 541.
13. Hine, F.; Yasuda, M.; Iida, T.; Ogata, Y.; Electrochim. Acta
1986, 31, 1389.
14. Arikado, T.; Iwakura, C.; Yoneyama, H.; Tamura, H.; Electrochim. Acta1976, 21, 1021.
15. Tamura, H.; Arikado, T.; Yoneyama, H.; Matsuda, Y.; Electrochim. Acta1974, 19, 273.
16. Ho, S. P.; Wang, Y. Y.; Wan, C. C.; Wat. Res.1990, 24 , 1317.
17. Kelsal, G. H.; Savage, S.; Brandt, D.; J. Electrochem. Soc.
1986, 138 , 117.
18. Wels, B.; Johnson, D. C.; J. Electrochem. Soc.1990, 137, 2785.
19. Lin, M. L.; Wang, Y. Y.; Wan, C. C.; J. Appl. Electrochem.
1992, 22, 1197.
20. Stavart, A.; Van Lierde, A.; J. Appl. Electrochem.2001, 31, 469.
21. EPA/USA, Method 4.500 – CN- In Standard Methods for the Examination of Water and Wastewater; Franson, M. A. H. ed.; 19th ed., 1995, p. 4-26.
22. Rolewicz, J.; Comninellis, C.; Plattner, E.; Hinden, J.; Chimia
1988, 42, 75.
23. Bard, A. J.; Faulkner, L. R.; Electrochemical Methods: Fun-damentals and Applications, Wiley: USA, 1980.
24. Galizzioli, D.; Tantadini, F.; Trasatti, S.; J. Appl. Electrochem.
1974, 4, 57.
25. Burke, L. D.; Murphy, O. J.; J. Electroanal. Chem.1979, 96, 19.
26. Boggio, R.; Carugati, A.; Trasatti, S.; J. Appl. Electrochem.
1987, 17, 828.
27. Burke, L. D.; Healy, J. F.; J. Electroanal. Chem. 1981, 124, 327.
Received: July 5, 2001 Published on the web: April 18, 2002