Revista Brasileira de Meteorologia, v.28, n.2, 125 - 128, 2013
ANALYSIS OF THERMAL CONDUCTIVITY IN A SEASONAL FLOODED FOREST IN THE
NORTHERN PANTANAL
LEONE FRANCISCO AMORIM CURADO, THIAGO RANGEL RODRIGUES, ALLAN GONÇALVES
DE OLIVEIRA, JONATHAN WILLIAN ZANGESKI NOVAIS, IRAMAIA JORGE CABRAL DE PAULO,
MARCELO SACARDI BIUDES E JOSÉ DE SOUZA NOGUEIRA
Universidade Federal de Mato Grosso, Instituto de Física (UFMT/IF), Cuiabá, MT, Brasil
[email protected], [email protected], [email protected], [email protected], [email protected],
[email protected], [email protected]
Received August 2010 - Accepted October 2012
ABSTRACT
Research involving the lux of energy in the soil has been intensiied in order to increase the understanding of the geophysical behavior of the Pantanal-Brazil. In present study was examined the seasonal variation of the thermal soil conductivity in the Pantanal for the study of energy low in
the soil to Pantanal region. The average values obtained by the Fourier equation showed that the soil thermal conductivity in the wet and dry seasons was 8.69 W.m-1.ºC-1 and 6.65 W.m-1.ºC-1 respectively. The seasonal variation of the thermal conductivity of the soil was 30.68% higher in the wet season than in the dry season due to soil moisture in the wet season. It was also noted that the seasonal variation of temperature in the soil layer was higher in the wet season than in the dry season due to a lower incidence of solar radiation in this season.
Keywords: Energy lux, geophysical behavior, Fourier Equation
RESUMO: ANÁLISE DA CONDUTIVIDADE TÉRMICA EM FLORESTA ALAGADA SAZONALMENTE NO NORTE DO PANTANAL
Pesquisas envolvendo o luxo de energia no solo têm-se intensiicado, a im de que se conheça o comportamento geofísico do Pantanal. No presente trabalho buscou-se veriicar a variação sazonal da condutividade térmica do solo no Pantanal Mato-Grossense, com a inalidade de contribuir para as pesquisas destinadas ao estudo do luxo de energia no solo na região pantaneira. Os valores médios obtidos através da equação de Fourier mostraram que a condutividade térmica do solo no
período chuvoso e seco foi, respectivamente, 8,69W.m-1.ºC-1 e 6,65W.m-1.ºC-1. A variação sazonal da
condutividade térmica do solo foi 30,68% maior no período chuvoso do que no seco, em decorrência da maior quantidade de água no solo na estação chuvosa. Observou-se também, que houve variação sazonal da temperatura do solo nas camadas estudadas, sendo maior no período chuvoso do que no
seco, devido à menor incidência de radiação solar nesse período.
Palavras Chaves: Fluxo de Energia. Comportamento Geofísico. Equação de Fourier
1. INTRODUCTION
The Brazilian Pantanal is the largest lood plain of the
planet. In Brazilian territory, it has almost 140.000 Km, which corresponds to 1.6% of Brazilian territory (Curado et al., 2011). The geophysical structure of the Pantanal is composed by large alluvial plains and deltas in the basin of Paraguay as a link between the biomes of the Amazon, Brazilian Savanna, Chaco and Atlantic Forest (Amador, 2006).
Its rich biodiversity is sustained by a high variability
of hydrologic and edaphic habitat conditions. Extensive cattle farming, adapted to the looding cycles, is the predominant
land use inside the Pantanal. Human activity in its contributing
watersheds, however, endangers the loodplain environmental integrity, increasing, for example, the sediment (Wantzen, 2006),
nutrient (Zeilhofer et al., 2006).
126 Curado et al. Volume 28(2)
of loods and dry that alternate throughout the year allowing the
formation of a monodominant prolonged period due to frequent
looding and poor soil drainage site. At the other extreme, dry
periodically causes water stress on local vegetation, regulating the phenology and mass production. The high growth of vegetation, coupled with temporal variation of meteorological
elements, contributes to variation in energy exchange between
the surface and atmosphere (Bellaver, 2010).
Knowledge of geothermal variation flow, induced by solar radiation in the upper layers, is very important for Geosciences, because these depths constitute the main stage of many geochemical processes, especially weathering and laterization, and geophysical processes, such as changes in values of thermal conductivity and diffusivity in the zone of aeration (Araújo et al., 2004).
Process regulate soil behavior, knowledge of heat lux
is necessary to understand its components, like a diffusion of solutes and gases, the development of plants such as seed germination Zucareli et al. (2010), water assimilation and nutrients by roots, and the microorganism activity in the soil, which depend directly on the propagation of heat, and the study
of seasonality, for the analysis of the inluence of water in this
heat propagation.
Thus, the aimed of the study was estimate the thermal soil conductivity in the northern region of the Pantanal in two seasons.
2. MATERIALS AND METHODS
The study was conducted in an area located in a Private Natural Heritage Reserve - PNHR SESC - PANTANAL, at
Barão de Melgaço MT-Brazil, 160 km far from Cuiabá – MT,
where it was installed a micrometeorological tower 32 m high (16 ° 39’50 ‘’S, 56º 47’50’’W) and at an altitude of 120 m. The vegetation in this area is monodominant of Cambará (Vochysia divergens, Phol), known locally as cambarazal with canopy height varying between 28-30 m.
The soil was classiied as Haplic Gleysoil (EMBRAPA,
1997). The weather is type Aw, with corresponding dry winters and rainy summers. Its annual temperature oscillates between 22ºC to 32 ºC, and the annual mean precipitation is 1150 mm.
The micrometeorological tower had termistors installed
at 0.03 m and 0.07 m depth, , a luximeter (Campbell HFT3 Soil Heat Flux Plate) at 0.05 m depth, a piranometer model Li 200X
(Li-cor Bioscience, Inc., Lincoln, NE, USA) and a datalogger
model CR 10X (Campbell Scientiic, Inc., Logan, Utah,USA).
For this study, it was used data collected between the months January to September 2008. The months between January to April corresponds to the wet season and between June to September, dry season. The month of May was not considered to
be a transition period between the two seasons. The instruments used for data collection were programmed to make measurements every 15 minutes, and were daily averages of these values.
According to Reichardt and Timm (2004), the thermal
conductivity, K, can be deined by equation of Fourier, where the density of soil heat lux, q (W.m-2.), is proportional to the
temperature gradient at depth z, dT/dz (°C.m-1), this equation can be written:
where, q is density of soil heat lux (W.m-2), dT/dz is the gradient of temperature in soil (ºC.m-1) and K is the thermal soil conductivity (W.m-1.ºC)
3. RESULTS AND DISCUSSIONS
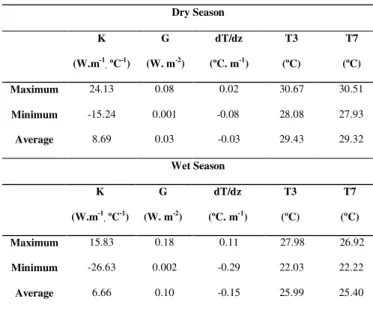
Daily values averages of soil thermal conductivity (K),
soil heat lux (G), gradient of temperature between depths of
0.03 m and 0.07 m (dT/dz) and temperatures at 0.03 m and 0.07 m, in the wet and dry seasons it was showed in Table 1.
In the covered ground it is assumed that there is greater moisture content changing the specific heat and thermal
conductivity of the soil. Thus, as the speciic heat of water is
high (4,18 MJ.m-3.K-1) the thermal capacity of the soil increases
with increasing moisture content (Shoffel and Mendes, 2005). Higher values of soil temperature increase the kinetic energy of water molecules and cause dispersion. If there is
= − = − (1) (2) Dry Season K (W.m-1 . ºC-1)
G
(W. m-2
)
dT/dz
(ºC. m-1
)
T3
(ºC)
T7
(ºC)
Maximum 24.13 0.08 0.02 30.67 30.51
Minimum -15.24 0.001 -0.08 28.08 27.93
Average 8.69 0.03 -0.03 29.43 29.32
Wet Season
K
(W.m-1 . ºC-1)
G
(W. m-2
)
dT/dz
(ºC. m-1
)
T3
(ºC)
T7
(ºC)
Maximum 15.83 0.18 0.11 27.98 26.92
Minimum -26.63 0.002 -0.29 22.03 22.22
Average 6.66 0.10 -0.15 25.99 25.40
Table 1 - Values of thermal conductivity (K), soil heat lux (G),
Junho 2013 Revista Brasileira de Meteorologia 127
variation in soil moisture, there will be variation in thermal conductivity and consequently affects the temperature distribution in the soil. There is an increase of thermal conductivity with high soil moisture, because the voids present
in the soil structure are illed with water that has higher thermal
conductivity than air present in the soil.
According to Figure 1 and Table 1, the average thermal conductivity was higher in the wet season. Due to higher soil moisture in this season, which increases heat transport, however, if the porous parts of the soil in the dry season, which
are practically illed with air, becomes illed with water in wet
season, which allows for greater heat transport by conduction is the primary means of heat transport in soil. This result is in agreement with the thermal conductivity of the soil.
The higher thermal conductivity the lower the variation of surface temperature and the greater the heat storage. The
thermal conductivity depends on soil texture, porosity and
moisture. Then it varies from soil to soil and for the same soil,
according to its soil moisture, is a factor that signiicantly affects
the its thermal conductivity.
Hydromorphic soils have a lower thermal conductivity
than sandy soils, showing that the density also inluences the
values of thermal conductivity. Similarly, for the same land with the same density, when the water content increases, the thermal conductivity increases as well (Abu-Hamdeh et. al., 2001).
Based on Table 1 and Figures 2 and 3, it can be observed
that the soil heat lux and temperature gradient had higher mean
absolute values in the dry season which caused a reduction in the average value of thermal conductivity, Equation 2, in the same season.
It can be also seen that the soil thermal conductivity in
the dry period was approximately 30.68% lower than in the
wet season. This reduction was due to a further increase of
temperature gradient, approximately 400% higher in the dry season, in relation to the increasing the soil heat lux in the
same season, that was about 233.33% higher. As in (1) the temperature gradient (dT / dz) appears in the denominator, its
largest increase over the soil heat lux (G) caused a decrease in
thermal conductivity of soil in the dry season.
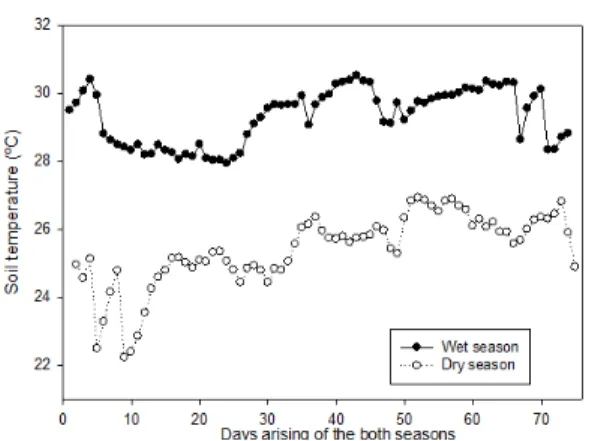
In Figures 4 and 5, the variation of the temperature at depths of 0,03m and 0,07m in the wet and dry seasons is showed. It was observed that in the layer closest to the ground there was a reduction in the average values of about 3.44 º C in the dry season, which represented 13.24% of the temperature of that season and the layer of 0.07 m there was a reduction of 3.92 °C, which represented 15.43% of the temperature of the dry season, that is, an increase of 0.48 °C between layers of 0.03 m and 0.07 m, hence the increase in the temperature gradient between the layers studied.
4. CONCLUSION
There was seasonal variation of thermal conductivity in the studied area. The thermal conductivity in the wet season was
approximately 30.68% higher than in the dry season.
Figure 2 - Heat lux in the soil in the wet and dry seasons.
Figure 3 - Temperature gradient between 0,03m and 0,07m of depth
in the wet and dry seasons.
128 Curado et al. Volume 28(2)
Figure 4 - Variation of the soil temperature in 0,03m depth in the wet
and dry seasons.
Figure 5 - Variation of the temperature in the 0,07m depth in the wet
and dry seasons.
The temperature gradient had a high increase in the
dry season compared to the increase of heat low in soil. The
temperature between the two layers analyzed showed an increase
of 0.48 ºC in the dry season which may explain the increase in
the temperature gradient at the station.
It is considered important that research in this area should be encouraged so that they may reveal new knowledge on the studied topic.
5. REFERENCES
ABU-HAMDEH, N. H., KHDAIR, A. I., REEDER, R. C. A comparison of two methods used to evaluate thermal conductivity for some soils. International Journal of Heat and Mass Transfer, v. 55, n. 5, p. 1073-1076, 2001. AMADOR, G. A. Composicion floristic and structural
characterization of two areas of carandazais in the subregions of Nabileque and Miranda, south Pantanal of Mato Grosso, Brazil. 2006. Dissertação (Mestrado em
Ecologia e Conservação), Universidade Federal de Mato
Grosso do Sul. 55p (in Portuguese)
ARAUJO, R. L. C.; SILVA, R. M.; CARVALHO, J. S.;
MONTEIRO, I. B. Environmental inluence on the structure
of shallow geothermal. Brazilian Journal of Geophysics. v. 22, n.1, p. 33-44. 2004 (in Portuguese),
BELLAVER, V. Thermal diffusivity of soil in Area monodominant Cambará In northern Pantanal. 2010.
Dissertação (Mestrado em Física Ambiental), Universidade
Federal de Mato Grosso. 70p (in Portuguese)
CURADO, L. F. A.; RODRIGUES, T. R.; NOVAIS, J. W. Z.; de OLIVEIRA, A. G.; VENTURA, T. M.; DE MUSIS, C. R.; NOGUEIRA, J. S. Adjustment of Brunt’s Equation Parameters for the Northern Brazilian Pantanal. Journal of ecology and the Natural Environment. v. 3, n.4, p. 157-162, 2011.
EMBRAPA. National Center for Research in soils. Manual of Methods of Soil Analysis. 2ªed. Rio de Janeiro, 212p, 1997. (in Portuguese)
REICHARDT, K.; TIMM, L.C. Plant, Soil and Atmosphere: Concepts, Processes and Applications, Barueri, SP: Manole. p.50. 2004. (in Portuguese)
SCHÖFFEL, E. R.; MENDES, M. E. G. Inluence ofcoverage
on theverical proile ofsoil temperature. In XIV Brazilian
Congress of Agrometeorology. In XIV Congresso
Brasileiro de Agrometeorologia, Piracicaba. São Paulo
Anais, 2005.
WANTZEN, K.M. Physical pollution: effects of gully erosion on benthic invertebrates in a tropical clear-water stream. Aquatic Conservation, v. 16, p. 733–749, 2006.
ZEILHOFER, P., LIMA, E.B.N.R., LIMA, G.A.R. Spatial patterns of water quality in the Cuiabá River Basin, Central Brazil. Environment Monitoring and Assessment, v. 123,
p. 41–62, 2006.
ZUCARELI, V., AMARO, A. C. E., SILVÉRIO, E. V.,
FERREIRA G. Métodos de superação da dormência e temperatura na germinação de sementes de Dioclea violácea.