ISSN online: 1807-1775
DOI: 10.4301/S1807-17752014000200005
_____________________________________________________________________________________________ Manuscript first received/Recebido em: 13/04/2013 Manuscript accepted/Aprovado em: 26/06/2014
Address for correspondence / Endereço para correspondência
GelsonHeindrickson, Tribunal de Contas da União, Assessoria de Segurança da Informação e Governança de TI E-mail: [email protected]
Carlos D Santos Jr., PhD, Laboratório de Estudos Avançados sobre Dados Abertos e Software Livre,Programa de Pós-graduação em Administração (PPGA) Dep. de Administração (ADM)
Universidade de Brasilia (UnB) E-mail: [email protected]
INFORMATION TECHNOLOGY GOVERNANCE IN PUBLIC
ORGANIZATIONS: HOW PERCEIVED EFFECTIVENESS
RELATES TO THREE CLASSICAL MECHANISMS
GOVERNANÇA DE TI EM ORGANIZAÇÕES PÚBLICAS: COMO A
EFETIVIDADE PERCEBIDA SE RELACIONA COM TRÊS
MECANISMOS CLÁSSICOS
Gelson Heindrickson
Tribunal de Contas da União, Brasilia, DF, Brazil Carlos D. Santos Jr.
University of Brasilia, Brasilia, DF, Brazil
_____________________________________________________________________
ABSTRACT
contributions of the other two mechanisms to IT governance. By informing decision makers and public managers at some of the main federal public organizations in the country on how to plan and deploy IT to promote a more effective governance, the conclusions presented herein fill a previous knowledge gap in the complementarity and the joint effectiveness of three IT governance mechanisms on the IT dynamics of key public organizations.
Keywords: IT governance; Public organizations; Public administration; Effectiveness; Governance mechanisms; Information Technology; Mediation analysis; Governance.
RESUMO
A Governança de TI é uma área de estudos recente que tem despertado muito interesse devido à importância cada vez maior da Tecnologia da Informação (TI) para as organizações, sejam elas públicas ou privadas. Isso justifica a existência de uma literatura científica sobre o tema governança de TI na qual este estudo se enquadra e para cujo desenvolvimento busca contribuir. Para tanto, realizou-se pesquisa empírica envolvendo 57 organizações públicas integrantes do governo federal brasileiro na qual foram examinadas as relações entre três mecanismos de governança – Comitê de TI, Gestores da Solução de TI e Processo de Portfólio de Investimento em TI – e a Efetividade da Governança de TI. Com base na literatura revisada, um modelo conceitual foi proposto para expressar as relações que esses construtos deveriam ter uns com os outros. Um questionário foi desenvolvido com base nesse modelo e aplicado a mais de 180 servidores públicos federais. As relações Causais foram testadas com análise de mediação e detectadas, em sua maioria, de acordo com o modelo. Os resultados indicam que o desempenho do Processo de Portfólio deveria sempre ser considerado em análises que tenham por objetivo avaliar os efeitos de Comitê de TI e de Gestores da Solução na efetividade da governança de TI. Isso significa que a não existência ou o baixo desempenho do Processo de Portfólio pode reduzir ou anular a contribuição positiva dos outros dois mecanismos para a efetividade da governança de TI. Por informar tomadores de decisão e gestores dos resultados em algumas das principais organizações da administração federal brasileira no planejamento e utilização TI em busca de efetividade da governança, as conclusões apresentadas neste artigo preenchem um vazio de conhecimento sobre as complementaridades e os efeitos de três mecanismos de governança na dinâmica dessas organizações.
1. INTRODUCTION
Information Technology (IT) is currently considered a critical and strategic asset for organizations, both public and private (Affeldt & Vanti, 2009; Albertin & Albertin, 2008a; Albertin & Albertin, 2008b; Assis, 2011; ISACA, 2012).
In order for an institution to obtain the benefits expected from IT use, at acceptable levels of risk and cost, IT governance must be established and maintained (ABNT, 2009; Assis, 2011; Machado, 2007; Ramos, 2009). IT governance can be understood as a set of policies, organizational structures, work processes, roles and responsibilities that are established by the top management in order to steer IT actions and exert control over the use and management of IT throughout the institution (Mello, 2006; Mendonça, 2013; ISACA, 2012).
Studies carried out at the international level by Weill & Ross (2006) and at the national level by Lunardi, Becker & Maçada (2012) reveal that companies that had implemented IT governance performed better in comparison to those that did not or those with a deficient implementation.
An IT governance mechanism that is often mentioned in literature and recommended by audit entities such as TCU – the Brazilian SAI (Supreme Audit Institution) – is the IT Steering Committee or IT Executive Committee (BRASIL, 2008). Surprisingly, a study carried out by Ali & Green (2012) has not identified statistically significant relationships between the action of the IT steering committee and the effectiveness of IT governance, reaching a paradoxical conclusion. That study, though gave priority to private companies and the sample was intentionally filtered in order to include only institutions with a certain level of indirect execution (outsourcing) of IT activities. Therefore, it would not be appropriate to generalize the conclusions of that study to all situations. Further investigations are required. Additionally, it must be taken into account that the respondents to the Ali & Green (2012) survey were representatives of only one group of stakeholders of enterprise IT: IT auditors.
This apparent contradiction provided the initial motivation for the present study as it pointed out the need for investigation that would take into account the specificities of public institutions and engage other stakeholders. Another motivation was the opportunity to include the observation of two IT governance mechanisms in the analysis, which, according to the theoretical framework surveyed, would be closely related to the actions of the IT Executive Committee, namely: the IT Investment Portfolio Management Process and the IT Solution Manager.
Another aspect that has raised our interest in carrying out the present research was the lack of materials available in terms of best practice models, scientific papers and publications in general specifically addressing IT governance in public institutions.
public institutions: IT Investment Portfolio Management Process, IT Steering Committee and IT Solution Manager.
Accordingly, our research question is: “How does the action of the IT
Committee and of IT Solution Managers relate to the performance of the IT Investment Portfolio Management Process and how do these three mechanisms interact with the effectiveness of IT Governance?”. It should be highlighted that only federal public institutions have been included in this research and that we did not aim for an institutional perspective, but for the personal perception of public employees representing the multiple stakeholders of the IT organization.
This paper provides empirical evidence that sheds new light on the relationships that exist between the IT governance mechanisms investigated. It can support public institutions in their implementation of IT governance, as well as provide input for recommendations issued by auditing authorities to the entities under their jurisdiction.
Below, is a brief theoretical framework on the effectiveness of IT governance and the governance mechanisms that have been evaluated and presented, followed by a description of the methods used in the research. Later, we present the results obtained and discuss our conclusions and final remarks.
2. THEORETICAL FRAMEWORK
2.1 IT governance effectiveness
Effective IT governance contributes to improved IT performance, which, on its turn, contributes to improved organizational performance (Assis, 2011; Machado, 2007; Mendonca et al., 2013; Weill & Ross, 2006). But, one might ask, what is an improved organizational performance? A quite objective answer is provided in Cobit 5, an important IT governance framework, that associates IT performance and organizational
performance via the creation of value for the business and clarifies that “creating value
is to realize benefits at optimal resource cost whilst optimizing risk” (ISACA, 2012, p. 17).
Value creation can also be described as the achievement of certain IT objectives related to certain generic corporate goals, applicable to all organizations (ISACA, 2012, p. 18, Figure 4). These objectives aim to ensure the following aspects, among others: that planned actions and those under way in the IT departments be aligned with the
organization’s business strategy, so as to give priority to the most important requests of
the business to the IT department; that meeting these requests should be in compliance with the requirements, deadlines, quality and the costs agreed; that costs and risks of IT initiatives should be managed and that the expected benefits of the IT actions carried out should be achieved (ISACA, 2012b).
Along the same lines, Dolci & Maçada (2011) have identified a comprehensive set of benefits targeted by organizations regarding different dimensions of IT investments.
questions of the survey form that evaluated the effectiveness of IT governance (Appendix A, item 4).
2.2 IT investment portfolio management
Portfolio management has become a popular topic following the publication of Markowitz (1952), aimed at financial markets. McFarlan (1981) and Ward (1990) have pioneered the use of the portfolio approach in selecting IT investments.
Studies carried out by Weill, Woerner & Rubin (2008) have followed up on the evolution of the use of the IT governance concepts and practices by large private international corporations. In the national scenario, Moraes & Laurindo (2003) have shown positive results obtained from the implementation of the IT project portfolio management process. Dolci & Maçada (2011), was based on case studies carried out with national companies with high investments in information technology, have identified the most important aspects to be considered by the four dimensions usually taken into account regarding IT investment portfolios.
Cobit 5 (ISACA, 2012b) includes IT investment portfolio management among decision-making tools and for supporting the monitoring of actions associated to IT management and use. In this model, the topic is addressed by the following processes and practices:
a) In the domain of IT governance: EDM02.01 Evaluate value
optimisation, EDM02.02 Direct value optimization and EDM02.03 Monitor
value optimisation;
b) In the domain of IT management: APO05.01 Establish the target
investment mix, APO05.02 Determine the availability and sources of funds, APO05.03 Evaluate and select programmes to fund, APO05.04 Monitor,
optimise and report on investment portfolio performance, APO05.05 Maintain
portfolios and APO05.06 Manage benefits achievement.
In the ValIT framework (ITGI, 2008), IT investment portfolio management is addressed under the Portfolio Management (PM) domain. Its objective is to guarantee that organizations may obtain optimal value for its IT investments. Practices associated with portfolio evaluation and balancing fall within this domain, as well as the definition of criteria for these activities. ValIT also addresses the follow up of the portfolios overall performance.
Valuable information sources on how to establish or improve the IT investment portfolio process are: the ITIM framework, designed and published by the United States General Accounting Office (GAO, 2004) and the study carried out by Weill, Woerner & Mcdonald (2009). The standard defined under The Standard for Portfolio Management (PMI, 2008) and the model proposed by Archer & Ghasemzadeh (1999) differentiate themselves in one aspect: they are not limited to the management of IT portfolios, but are also applicable to the management of institutional program and project portfolios in general.
greatest possible returns to the organization. Selected projects and programs must be aligned with corporate strategies and, according to the methodology, their risks, costs, quality, deadlines and levels of service must be properly managed. It has been said that, in order to meet its objectives, a portfolio management process requires the definition of decision-making structures and the fulfillment of some common stages or phases. Despite the fact that each model uses slightly different names, the main ones are: identification and analysis of components/projects, selection and prioritization of components, authorization, monitoring, reviews and risk management. Requirements for portfolio management are project management and program management, but are not limited to them.
This set of characteristics described in literature has provided input for the phrasing of the survey questions that evaluated the performance of the governance mechanism of the IT Investment Portfolio Process (Appendix A, item 1).
The objective and the characteristics of the portfolio management process are clearly congruent with the objectives of the so-called focus areas of IT Governance: strategic alignment, value delivery, resource management, risk management and performance measurement (ITGI, 2007). Hence, it is reasonable to consider the following hypothesis: improvements in the performance of the IT investment portfolio process have a positive influence on the effectiveness of IT governance (hypotheses H3 in Figure 1).
2.3 IT solution manager
There are several different names for the “IT Solution Manager” governance
mechanism: business executive, business area, project or investment sponsor or
business process owner. In the present article we have chosen to use “IT Solution Manager”, as it can be applied to the whole life cycle of an IT solution; it also is less
restrictive, as IT may support not only business processes in the strict sense of the word, but also administrative processes, support processes and even processes of the IT department itself.
The role of the TCU IT Solution Manager is internally regulated by TCU Administrative Order no. 156 of 2012 (BRASIL, 2012), whereas other public entities have their own norms on that issue.
It should be noticed that, even though restricted to situations involving the provision of contract-based IT solutions, Normative Instruction no. 4/2010 of the Secretariat for Logistics and Information Technology of the Ministry of Planning, Budgeting and Management (SLTI), the central authority of the System for the Administration of Information Resources and Information Technology of the Federal Executive Power (SISP), defines some attributions of the IT Solution Manager role in the items that address the responsibilities of the contracting planning team (BRASIL, 2010).
identification of business requirements, expected benefits, as well as the preparation of the Business Case, a document that issues a formal request and registers essential information about the initiative. It also addresses the follow up of individual performance, i.e., monitors the fulfillment of the benefits of the program or project throughout their life cycle.
In Cobit 5 (ISACA, 2012b), the responsibilities of the IT Solution Manager are
presented under different items of the framework. The “RACI” tables show the
responsibilities attributed to the Business Executive or the Business Process Owner, i.e., to the unit or sector benefitting from the investments in the IT solution. That can be noticed, especially, in the description of the following processes, key practices and activities of Cobit 5: BAI01 Manage Programmes and Projects (several key practices), BAI02 Manage Requirements Definition (several key practices), APO12 Manage Risk, APO05.06 Manage benefits achievement, APO09.03 Define and prepare service
agreements andPO09.04 Monitor and report service levels.
According to the IT Governance Institute, an IT Solution Manager is responsible for: acting as the sponsor of the IT solution, defining business requirements for the IT solution; defining and controlling levels of service for the IT solution; continuously evaluating the benefits of the IT solution; evaluating the risks to the business that are associated with the IT solution; providing resources and establishing priorities for the IT solution, among other responsibilities (ITGI, 2003, p. 51).
Peppard, Ward & Daniel (2007) have revealed that the value of IT investments can only be obtained by means of an ongoing identification and management of the benefits achieved throughout the whole life cycle of the IT solution. And this is the responsibility of business managers, i.e., this responsibility lies with those who we have
called “IT Solution Manager”.
For the purposes of this study we have considered that the IT Solution Manager is the organizational unit with the greatest interest in the investment, development or hiring of an IT solution (be it a system, software, app or service provided by the IT department). It should be noted that, even though the operational activities of the IT Solution Manager can be delegated to sub-units, departments or specialists, this is not relevant to the analysis proposed in this study.
The questions of the survey that evaluated the performance of the IT Solution Manager governance mechanism were based on the set of characteristics described in literature (see Appendix A, item 3).
The responsibilities of the IT Solution Manager described herein can be easily related to the common roles found in portfolio process models, such as the sponsor and program manager roles (PMI, 2008), including activities that are considered necessary at certain stages or phases of a portfolio management process, especially during the
identification, authorization, review and report, and risk management stages (PMI, 2008), as well as during the individual project analysis, project development and
relationship seems to indicate that several attributions of the IT Solution Manager can contribute to the fulfillment of the following objectives of IT Governance focus areas: value delivery, resource management, risk management and performance measurement (ITGI, 2007). Therefore, it is reasonable to consider the following hypothesis as well: improvements in the performance of IT solution managers have a direct and positive influence on the effectiveness of IT governance (hypothesis H5 in Figure 1).
2.4 IT Steering Committee
Weill & Ross (2006) have evaluated large numbers of large international corporations over several years and report that IT Steering Committees are important governance mechanisms used by top performing companies. Castro & Carvalho (2010) also have identified the need for a committee composed by representatives of several different areas of the organization to take decisions regarding the selection and prioritization of projects. Likewise, a case study that has been evaluated by Moraes & Laurindo (2003) shows positive results deriving from the joint participation of managers from IT and business areas in the decision-making associated to the selection and prioritization of projects.
The organization is responsible for establishing an IT Steering Committee, composed of directors and managers from the IT and business areas. Among other responsibilities, as established in Cobit 5 under APO01.01 Define the organizational
structure key practice, that the committee should: “determine prioritisation of IT -enabled investment programmes in line with the enterprises business strategy and priorities; track status of projects and resolve resource conflicts; and monitor service
levels and service improvements” (ISACA, 2012b).
Cobit 5 (ISACA, 2012b) also presents other attributions of the IT Steering
Committee in its “RACI” tables. That can be especially noticed in the descriptions of
the following processes, key practices and activities: BAI01 Manage Programmes and
Projects (several key practices), APO12 Manage Risk, andAPO05.06 Manage benefits
achievement.
According to the IT Governance Institute, it is the responsibility of the IT Steering Committee to: participate in the approval of new IT solutions; evaluate the alignment of proposals for new IT solutions with the organizational strategies; define priorities for projects; ensure that all costs and benefits of the proposals for new IT solutions have been identified; guarantee that projects are being risk-managed; follow up the progress of relevant IT projects, among other responsibilities (ITGI, 2003, p. 52).
According to TCU, all public organizations, in addition to other actions, must
establish an IT steering committee, “in order to provide for the allocation of public
resources in accordance with the organization’s needs and priorities” (BRASIL, 2008).
In compliance with its own recommendations, the TCU has implemented a governance
In line with the best IT governance practices and the recommendations of the audit entities, the SISP Information Technology General Strategy (Estratégia Geral de
Tecnologia da Informação – EGTI) for the 2011-2012 period also foresees the establishment of IT Committees by the organizations that are part of the system (BRASIL, 2011b).
The IT Committee that was evaluated by this study holds the characteristics and attributions of the IT steering committee described in the sources mentioned above, having thus set the basis for the drafting of questions for the survey questionnaire which have evaluated the governance mechanism (Appendix A, item 2).
It can be easily noticed that the attributions of the IT steering committee described herein are related to the usual roles found in portfolio process models, such as the Portfolio Review Board and the Portfolio Manager roles (PMI, 2008). Their activities are considered necessary during the stages or phases of a portfolio management process, especially during the prioritize, balance, authorize, review and report and risk management stages (PMI, 2008), or during the optimal portfolio
selection and phase-gate evaluation (Archer and Ghasemzadeh, 1999) phases. Hence, the evaluation of the following hypothesis is applicable: improvements in the action of the IT committee have a direct and positive influence on the performance of the IT investment portfolio (hypothesis H1 in Figure 1).
Additionally, it can be noticed that there are intersections between the attributions of the IT Steering Committee and the following objectives of the IT Governance focus areas: strategic alignment, value delivery and risk management (ITGI, 2007). Therefore, it is reasonable to consider the following hypothesis as well: improvements in the performance of the IT Steering Committee have a direct and positive influence on the effectiveness of IT governance (hypothesis H4 in Figure 1).
2.5 Conceptual model
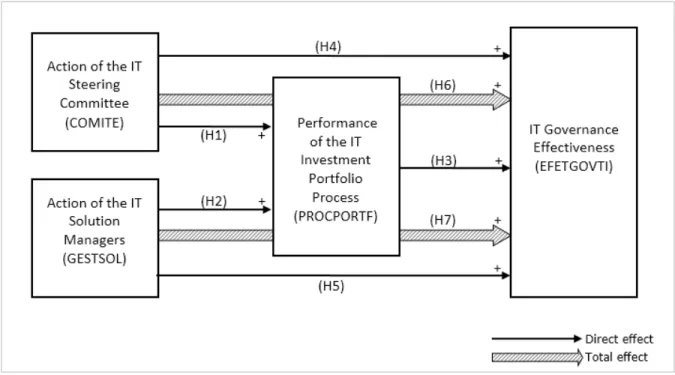
Figure 1 – Conceptual model and hypotheses
The hypotheses that will be evaluated in this study, concerning the relationships between governance mechanisms and between these and IT governance effectiveness, are represented by arrows and identifiers in Figure 1, namely:
a) H1: Improved action by the IT steering committee has a direct and positive influence on the performance of the IT investment portfolio process.
b) H2: Improved action by IT solution managers has a direct and positive influence on the performance of the IT investment portfolio process. c) H3: Improved performance of the IT investment portfolio process has a direct and positive influence on IT governance effectiveness.
d) H4: Improved action by the IT steering committee has a direct and positive influence on IT governance effectiveness.
e) H5: Improved action by the IT solution managers has a direct and positive influence on IT governance effectiveness.
f) H6: The overall effect of improvements in IT steering committee action is positive on IT governance effectiveness, i.e., the balance between the direct and indirect effects, via portfolio process, of IT committee action on IT governance effectiveness is a positive one.
3. METHODS
The survey was done through a questionnaire made available over the Internet between October 10th, 2012 and October 15th , 2012. Federal public servants made up the target audience, encompassing the following IT stakeholders in the participating organizations: internal IT clients, IT servants, internal auditors and IT consultants, encompassing managers and non-managers.
The survey was distributed via email to the representatives of the TI Controle community, which gathers several IT managers from federal public institutions. SLTI sent the same survey to public servants that had subscribed to the entity’s portal as well. Additionally, the survey organizer spread it to its contacts and provided a website to facilitate the collection of information and access to the form by interested respondents.
The four questions of the questionnaire that evaluated IT Steering Committee action (COMITE), the five questions that evaluated the IT Solution Manager action (GESTSOL) and the five questions that evaluated the IT investment portfolio process (PROCPORTF) had been drafted based on the main characteristics of these governance mechanisms, as described in academic studies, best practice models and other literature sources reviewed. All questions related to independent variables and mediator (COMITE, GESTSOL and PROCPORTF) had been measured according a 5-point Likert scale, which evaluated two dimensions for each question: i) the relevance of the question for IT governance effectiveness, as perceived by the respondent; ii) the degree to which the action or activity proposed by the question had been fulfilled by the
institution, according to the respondent’s perception. Figure 2 is an example of how these two dimensions evaluated for one of the questions addressing the COMITE variable.
Figure 2 – Sample question for the evaluation of the “relevance” and
“fulfillment” dimensions
The dependent variable – IT governance effectiveness (EFETGOVTI) – was
evaluated through a proxy: the respondents’ satisfaction regarding the achievement of
literature review section. The six questions regarding this variable were also evaluated based on a 5-point Likert scale.
For each variable analyzed in the survey, Chart 1 summarizes the main reference sources on the topic and the questionnaire items (Appendix A) that represent the questions used for measuring these variables.
Variable Main Bibliographic References
Questionnaire Questions
(Appendix A)
Cronbach’s Alpha Coefficient
PROCPORTF
MCFARLAN, 1981; WARD, 1990; ARCHER & GHASEMZADEH, 1999; GAO, 2004; ITGI, 2008; PMI, 2008; WEILL, WOERNER & MCDONALD, 2009; ISACA, 2012b.
Items 1.1 to 1.5 0.7938
COMITE
ITGI, 2003, p. 52; MORAES & LAURINDO, 2003; WEILL & ROSS, 2006; BRASIL, 2008; CASTRO & CARVALHO, 2010; BRASIL, 2011; BRASIL, 2011b; BRASIL, 2012; ISACA, 2012b; ALI & GREEN, 2012.
Items 2.1 to 2.4 0.8523
GESTSOL
ITGI, 2003, p. 51; ITGI, 2007; ITGI, 2008; PEPPARD, WARD & DANIEL, 2007; BRASIL,
2010; ISACA, 2012b; BRASIL, 2012. Items 3.1 to 3.5 0.7841
EFETGOVTI
WEILL & ROSS, 2006; DOLCI & MAÇADA, 2011, Figure 2, p. 363; ISACA, 2012, p. 18, Figure 4; ISACA, 2012b, p. 226, Figure 17.
Items 4.1 to 4.6 0.8273
Chart 1 – Variables, bibliographic references and questionnaire questions
For the independent variables and the mediator variable (COMITE, GESTSOL and PROCPORTF), their measurement in each answer was calculated as follows: for each question that is part of the variable, the average value obtained from the answers
of all respondents to the “question relevance” dimension was used as a weight that was
applied to each answer to the “degree of fulfillment” of the question. The weighted
average of the set of questions of a variable times its weights, converted into a 10-point scale, generated a final average of this variable in each answer. The strategy for calculating the measure of a variable based on its components is based on the stated preference weights approach (Decancq & Lugo, 2010, p. 17), according to which the relevance/weight is defined by the respondents themselves.
(Decancq & Lugo, 2010, P. 16); all sources mentioned in the theoretical framework were considered experts – with an equivalent relevance – which provided the basis for the selection of questions.
The selection of items used for measuring the variables is fully justified as it is based on the opinions of respondents and of experts on the topic, according to the previously mentioned approaches. Nevertheless, we also carried out a statistical analysis of the internal consistence or reliability of the questionnaire items that make up
each variable of the study. Chart 1 shows that the values of Cronbach’s Alpha
coefficient obtained for each variable fall within the acceptable range, that is, between 0.70 and 0.95 (Tavakol & Dennick, 2011). It also has been found that the eventual exclusion of items would not improve the Alpha coefficient value in none of the variables, which reinforces the relevance that is given to the items by literature.
The model presented in Figure 1 shows that the IT Steering Committee and the IT Solution Manager can have a direct effect on IT governance effectiveness, as well as indirect and total effects through the Portfolio Process. To evaluate the direct effects shown in this figure, we used the multiple regression analysis technique. In order to take into account the indirect and total effects, the mediation analysis statistics method was used in the study. Its aim is to test the relationships observed between a set of independent variables and a dependent variable upon the inclusion of an additional variable, known as mediator. In the mediated model, the hypothesis is that the independent variable influences the mediator variable, which, on its turn, influences the dependent variable. To be highlighted is that the models that can be analyzed with the method are not limited to three variables and can be applied to several models, with any number of dependent variables and mediator variables. The importance of this type of analysis has achieved notoriety following the studies by Baron and Kenny (1986), and very effective modern techniques are currently available, such as those mentioned by MacKinnon (2008) and Hayes (2009).
We used the “R” statistical software to calculate Cronbach’s Alpha coefficient and carry out the multiple regression analysis, as well as the auxiliary correlation tests used in this study. For the mediation analysis we have used the SPSS® Statistics
software and the “MEDIATE” (Hayes, 2012a) and “PROCESS” (Hayes, 2012b) macros, which are support tools available on the internet that can be accessed and used by the general public.
4. RESULTS
4.1 Sample characteristics
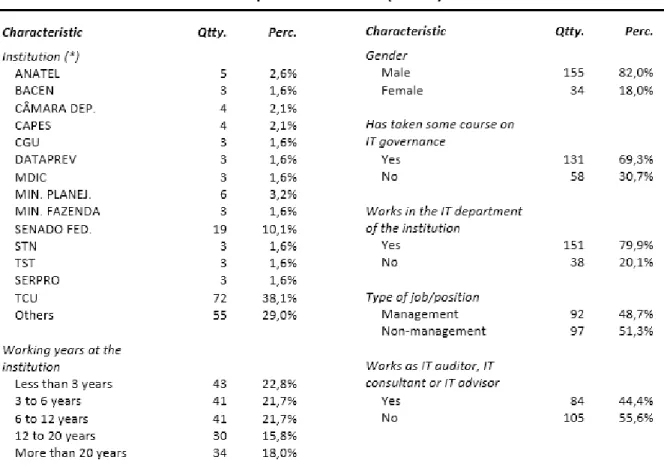
Table 1 – Sample characteristics
Table 1 presents the distribution of respondents with regards to important grouping characteristics. Other peculiarities of the sample can be found in Appendix B. We had a total of 189 respondents, associated to 57 different institutions, and about one third of all respondents were TCU employees. The large number of TCU respondents can be explained by the fact that the research organizer works at TCU, which has facilitated communication and access to people. An analysis of the rate of respondents in relation to the requests made is not applicable as the main means of divulgation outside TCU were not under the control of the research organizer (indirect means: divulgation made by the IT Control Community and by SISP to its members).
4.2 Preliminary Analysis
of EFETGOVTI based on these three variables. The results are summarized in Table 2 and Table 3, respectively.
Variable Average Standard Deviation
Correlations
COMITE GESTSOL PROCPORTF EFETGOVTI
COMITE 6.33 2.08 1 - - -
GESTSOL 6.11 1.58 0.38*** 1 - -
PROCPORTF 6.03 1.59 0.41*** 0.48*** 1 -
EFETGOVTI 5.64 1.35 0.35*** 0.40*** 0.58*** 1 Obs.: N=189; ***p< 0.001; ** p<0.010; * p<0.050; ^p<0.100
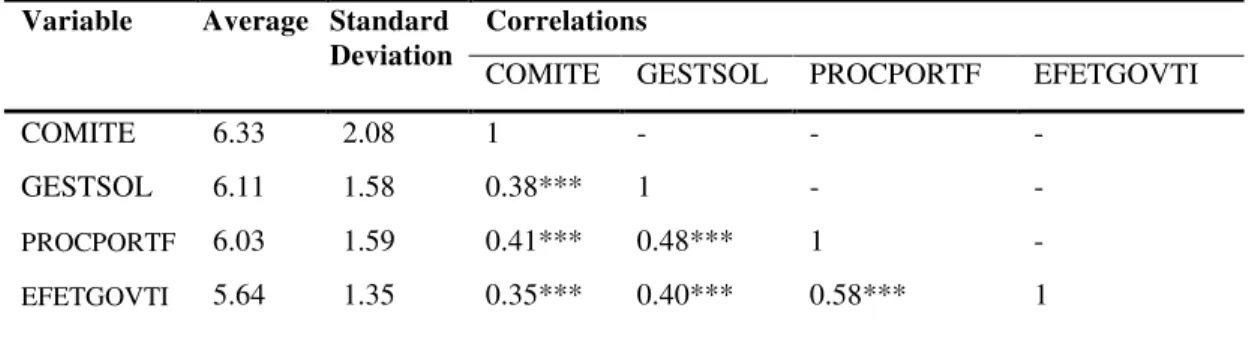
Table 2 – Averages, standard deviations and correlations between variables
As shown in Table 2, initial results indicate there is a statistically significant correlation between all variables of the model, which could support the validity of some of the hypotheses presented in Figure 1.
Variable
D i r e c t e f f e c t s
Coefficients to
calculate PROCPORTF
Coefficients to
calculate EFETGOVTI
COMITE 0.21*** (H1) 0.07 (H4) GESTSOL 0.37*** (H2) 0.11^ (H5)
PROCPORTF - 0.41*** (H3)
s. Obs.: N=189; ***p< 0.001; ** p<0.010; * p<0.050; ^p<0.100
Table 3 – Results of the regression tests, with estimates for the direct effects of COMITE and GESTSOL over PROCPORTF and of these three variables over EFETGOVTI
Additionally, the results of the regression test, shown in Table 3, indicate that the direct effects of GESTSOL and COMITE over PROCPORTF are substantial and statistically significant, which allows us to accept hypothesis H1 and H2 of Figure 1. The direct effects of PROCPORTF over EFETGOVTI also have a high value and are statistically significant, which confirms hypothesis H3 of Figure 1.
significant, with confidence levels lower than 95% and 90%, respectively, which leads us to reject hypotheses H4 and H5 of Figure 1.
4.3 Mediation analysis
According to the mediation analysis theoretical framework, the direct effect is calculated the same way as in the regression analysis, whereas the coefficient that measures the value of an indirect effect is given by the product of the coefficients of the mediated direct effects. The total effect, though, is calculated as the sum of the direct and indirect effects that have been measured between the same variables. Additionally, data must be submitted to hypothesis tests that allow the validation of the estimated values for such effects, that is, if they can be considered statistically significant (Baron & Kenny, 1986; Mackinnon, 2008; Hayes, 2009).
As seen, the preliminary regression analysis has rejected the direct effects of COMITE (H4) and GESTSOL (H5) on EFETGOVTI, which could discourage the performance of tests regarding the proof of total effects (H6 and H7). Nevertheless, it is known that a variable can have a positive total effect on another variable even though a direct effect is not identified (HAYES, 2012b). This is because its effect may occur through a third variable, a mediator.
In fact, the mediation analysis performed afterwards with the support of the
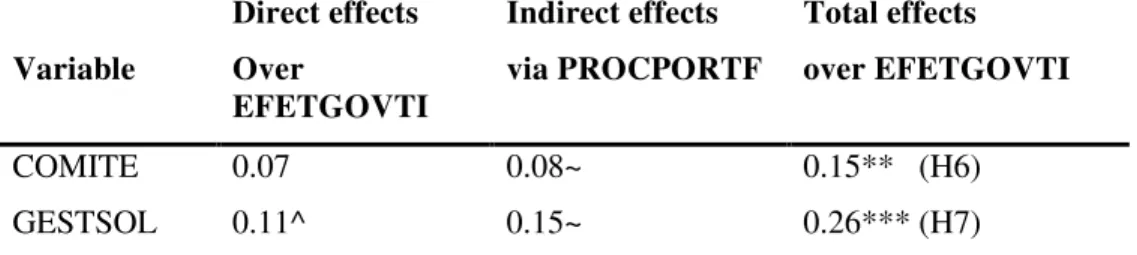
“MEDIATE” macro (Hayes, 2012a) revealed statistically significant indirect effects and total effects, at a confidence level higher than 95% of the GESTSOL and COMITE variables on EFETGOVTI variables when considering the PROCPORTF variable as a mediator. In view of the results of the mediation analysis shown in Table 4, hypothesis H6 and H7 of Figure 1 can be accepted regarding the total effects of COMITE and GESTSOL over EFETGOVTI, respectively.
Variable
Direct effects
Over
EFETGOVTI
Indirect effects
via PROCPORTF
Total effects
over EFETGOVTI
COMITE 0.07 0.08~ 0.15** (H6)
GESTSOL 0.11^ 0.15~ 0.26*** (H7)
Obs.: N=189; ***p< 0.001; ** p<0.010; * p<0.050; ^p<0.100; ~ i interval LLCI-ULCI does not contain 0
Table 4 – Mediation test results, with estimates of the direct, indirect and total effects of COMITE and GESTSOL over EFETGOVTI
The mediation test was configured to simulate 10,000 samples or bootstrap samples, while the recommendation by Hayes (2009) is to use at least 5,000. It should be underscored that, in mediation tests using the bootstrap technique, the interpretation
of the probability or confidence level of the indirect effect is not based on a “p” value,
contain a zero value, the mediation hypothesis is accepted (Hayes, 2009; Hayes 2012a; Mackinnon, 2008).
In view of the high number of TCU respondents in the sample, the mediation test was repeated by excluding the answers of these participants, for comparison with the results obtained from the full sample. Despite the variations in the values of estimated coefficients for the reduced sample, it was found that the calculated direct, indirect and total effects presented similar results and led to statistically significant levels of confidence, such as those obtained from using the full sample.
4.4 Consolidated results
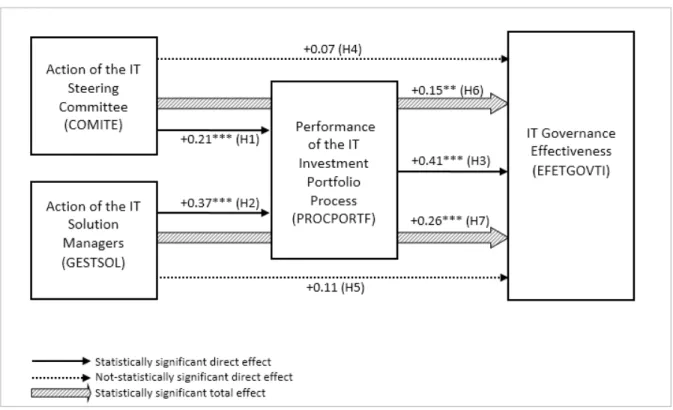
Figure 3 summarizes the results obtained from the mediation test: each path or hypothesis presents the estimated regression coefficient, rounded to two decimal places, as well as their statistical significance.
Figure 3 – Effects calculated through mediation analysis
The result of the mediation analysis allows us to discuss how the evaluated IT governance mechanisms relate to each other and with IT governance effectiveness. These relationships and effect sizes, on average, are summarized below on a scale from 0 to 1, which is typical of statistical regression and mediation tests:
b) Each point of improved IT Steering Committee action is equivalent to 0.15 improvement on IT governance effectiveness (as per H6 in Figure 3);
c) Each point of improved IT Solution Manager action is equivalent to 0.26 point improvement on IT governance effectiveness (as per H7 in Figure 3);
d) Each point of improved IT Steering Committee action is equivalent to 0.21 point improvement on the performance of the IT investment portfolio process (as per H1 in Figure 3);
e) Each point of improved IT Solution Manager action results on a 0.37 point improvement on the performance of the IT investment portfolio process (as per H2 in Figure 3).
It should be noted that in the case of COMITE and GESTSOL, this summary has considered the total effects on EFETGOVTI, as the result of the mediation analysis certifies that the effects these mechanisms indirectly exert on IT governance effectiveness, through its influence on the IT investment portfolio, are significant.
These results allow us to reach some important conclusions that can contribute to a better understanding of the specific topic being analyzed herein for the evolution of IT Governance as a field of study, and act as practical guidance for public organization leaders, managers and auditors regarding the implementation of the analyzed governance mechanisms, the planning of derived actions and in identifying training needs.
Because COMITE (H4) and GESTSOL (H5) have not been found to have statistically significant direct effects on EFETGOVTI, but that statistically significant total effects exist, and considering the mediation of PROCPORTF (H6 and H7), an important conclusion is: eventual efforts to improve the action of the IT Steering Committee and/or of IT Solution Managers depend on the existence of an Investment Portfolio Process in order to have relevant effects on IT governance effectiveness.
Finally, it can be concluded that the control entities and best-practice models mentioned in the conceptual sections of the paper are correct to recommend the use of the governance mechanisms analyzed herein, as the present study provides evidence of their contribution to the effectiveness of IT governance.
4.5 Other findings
In addition to the conclusions related to the research question and hypotheses presented in the conceptual model shown in Figure 1, other interesting findings, associated to the different group perceptions, are presented in Appendix B.
Even though these findings are not directly related to the research question and with the primary objective of the study, we took advantage of the opportunity offered by the collected data and carried out some additional exploratory analyses. The results of which are presented next, aiming at encouraging future complementary research on the topic.
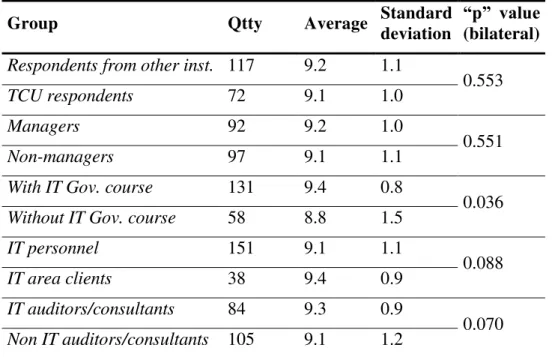
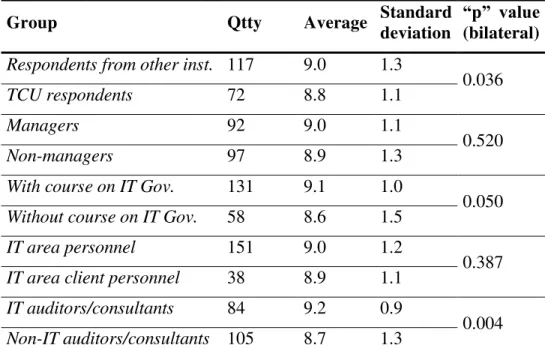
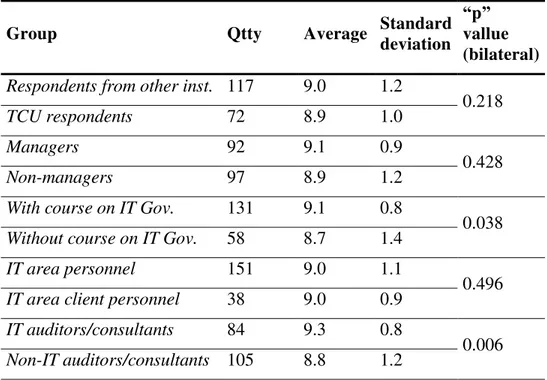
With regards to the perceived relevance of the three mechanisms for assessing IT governance effectiveness analyzed in the study (COMITE, GESTSOL, PROCPORTF), the evaluation has led to rather high averages for all groups, with a small standard deviation, as can be seen in Table B1, B2 and B3 of Appendix B. Despite unanimous agreement on the relevance of the mechanisms, there is statistically significant evidence of differences in the perception of the groups, namely:
a) Regarding the relevance of the IT Portfolio Process, there is evidence that groups that have taken a course on IT governance and those that have not do have different perceptions. The same difference exists between IT personnel and IT client personnel, as well as between IT auditors/consultants and non-IT auditors/consultants (Table B1);
b) Regarding the relevance of the IT Steering Committee, there is evidence of different perceptions between the respondents of other institutions and TCU respondents, as well as between the group that took the IT governance course and the group that did not take the course, as well as between IT auditors/consultants and non-IT auditors/consultants (Table B2);
c) With regards to the importance of the IT Solution Manager, there is evidence of different perceptions by the group that took the course on IT governance and the group that did not, and also between IT auditors/consultants and non-IT auditors/consultants (Table B3).
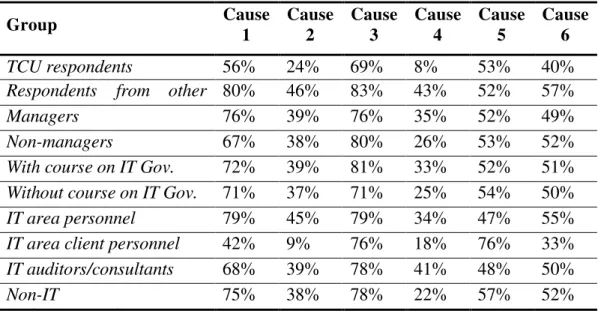
There also is evidence of differences in perception between groups regarding the relevance of the eventual causes of non-effectiveness of IT governance that have been evaluated, as shown in Table B4:
a) Reasonable difference in perception between TCU respondents and the respondents from other institutions regarding the relevance of Cause 1 – insufficient IT personnel, and also regarding Cause 4 – insufficient financial resources;
b) Reasonable difference in perception between IT personnel and IT client personnel regarding the relevance of Cause 1 – insufficient IT personnel, Cause 2 – lack of technical training by IT personnel, Cause 5 – lack of exploitation of alternatives for the provision of IT solutions, and Cause 6 – lack of management training by IT personnel;
c) Reasonable difference in perception between IT auditors/consultants and non-IT auditors/consultants regarding the relevance of Cause 4 – lack of financial resources.
5. CONCLUSIONS
The present study analyzed the relationships between three well-known governance mechanisms and the effectiveness of IT governance in Brazilian federal public institutions. Empirical evidence shows that the performance of the IT Steering Committee and of the IT Solution Manager has a positive influence and considerably affects the performance of the IT Investment Portfolio Process. It also shows that these three mechanisms have a positive influence on the effectiveness of IT governance. The influence of the IT Investment Portfolio Process is direct, quite high, statistically significant and easily detected by means of a simple regression analysis. The direct influences of the IT Steering Committee and of the IT Solution Managers on IT governance effectiveness were not proven at statistically significant levels. Nevertheless, the use of a more robust statistical analysis allowed us to detect statistically significant total effects of these two mechanisms on the effectiveness of IT governance, when the IT Investment Portfolio was considered as a mediator. This suggests that, in order to be effective, efforts to improve the performance of the IT Steering Committee or of IT Solution Managers depend on the existence of the IT Investment Portfolio Process. It should be highlighted that the need to use the mediation analysis technique must not be interpreted as some type of weakness in the effects observed: it only indicates that the mechanisms analyzed interact in a more complex way, thus also requiring more sophisticated techniques for the appropriate analysis of their effects.
It also should be noted that the results of this study should not necessarily be interpreted as a causal relationship between variables, considering that the specific investigation techniques and statistical methods required for providing such evidence
were not used (ideally, controlled experiments). Therefore, the terms “influence” and “effect” used in the study in order to facilitate describing the relationships between the governance mechanisms that were evaluated are better interpreted as a factual reflection of the value variations of a variable in relation to the values presented by another variable, irrespective of the identification of the primary cause of this phenomenon.
The performing of this study faced funding and time restrictions that resulted in certain limitations that must be considered when interpreting the results. First, the sample size may be considered limited, given the number of federal public organizations that exist in the country. Second, the disproportional number of respondents per institution may be considered small in some cases and quite large in others, as in the case of TCU, with possible effects on the values estimated by the statistical calculations, a consequence of the different levels of IT governance maturity encountered in the organizations. Third, the fact that the analyzed model did not take into account other IT governance mechanisms, which were intentional, in order to simplify the survey questionnaire and not to discourage respondent participation. However, the absence of other mechanisms implies that other relationships were not evaluated. We suggest that researchers with interest in further deepening the work done in this study may find ways of reducing the aforementioned limitations.
questionnaire to a broad target audience. This audience represented several key IT stakeholders in public organizations, including directors, managers, internal clients and IT technical staff.
Remembering that IT governance is the responsibility of higher-level management, normally the board of directors (Weill & Ross, 2006; ABNT, 2009; BRASIL, 2010b; ISACA, 2012), the results of this study can be used as input for decision-making by public organization leaders regarding the implementation of the
governance mechanisms analyzed. They may also support the organization’s IT
managers and IT governance staff in the identification of training needs and in the planning of communication and educational actions, based on the conclusions presented in Figure 3 – regarding the hypotheses tested based on the conceptual model of Figure 1
– as well as based on the other findings related to the differences in perceptions between groups, as detailed in Appendix B.
REFERENCES
ABNT. ABNT NBR ISO/IEC 38500/2009 - Governança corporativa de tecnologia da informação, 2009. Available at: <http://www.abntcatalogo.com.br/norma.aspx?ID=40015>. Accessed on May, 2012.
Affeldt, Fabrício S.; Vanti, Adolfo A. Alinhamento estratégico de tecnologia da informação: análise de modelos e propostas para pesquisas futuras. Journal of Information Systems and Technology Management, v. 6, n. 2, p. 203-226, 2009.
Albertin, A. L.; Albertin, R. M. M. Tecnologia de Informação e Desempenho Empresarial no gerenciamento de seus projetos: um estudo de caso de uma indústria. Revista de Administração Contemporânea (Printed), v. 12, p. 599-629, 2008a.
Albertin, A. L.; Albertin, R. M. M. Benefícios do uso de Tecnologia de Informação para o desempenho empresarial. Revista de Administração Pública (Printed), v. 42, p. 275-302, 2008b.
Ali, S.; Green, P. Effective information technology (IT) governance mechanisms: An IT outsourcing perspective. Information Systems Frontiers, v. 14, n. 2, p. 179-193, 2012. Available at: <http://www.springerlink.com/content/b7624v2u577214u1>. Acessed on: July 25, 2012.
Archer, N. P.; Ghasemzadeh, F. An integrated framework for project portfolio selection. International Journal of Project Management, v. 17, n. 4, p. 207–216,
1999. Available at:
<http://www.mmt3000.dk/Upload/N1%20An_integrated_framework_for_project_portf
olio_selection.pdf>. Accessed on: March 11, 2012.
Baron, R. M.; & Kenny, D. A. The moderator-mediator variable distinction in social psychological research: Conceptual, strategic, and statistical considerations. Journal of Personality and Social Psychology, v. 51, n. 6, p. 1173-1182, 1986. Available at:
http://www.public.asu.edu/~davidpm/classes/psy536/Baron.pdf>. Accessed on: Oct. 5, 2012.
BRASIL. Tribunal de Contas da União. Acórdão nº 1.603/2008, Plenário, 2008. Available at: < http://www.tcu.gov.br/Consultas/Juris/Docs/judoc/Acord/20080814/008-380-2007-1-GP.doc>. Accessed on: May 3, 2012.
BRASIL. Ministério do Planejamento, Orçamento e Gestão. Secretaria de Logística e Tecnologia da Informação. Instrução Normativa nº 04, de 2010, 2010. Available at: <http://www.governoeletronico.gov.br/sisp-conteudo/Legislacao>. Accessed on: Oct. 18, 2012.
BRASIL. Tribunal de Contas da União. Sumários Executivos - Levantamento de Governança de TI 2010, 2010b. Available at: <http://portal2.tcu.gov.br/portal/page/portal/TCU/comunidades/tecnologia_informacao/
sumarios/Levantamento%20de%20Governan%C3%A7a%20de%20TI%202010.pdf>.
Accessed on: May 20, 2012.
BRASIL. Tribunal de Contas da União. Resolução TCU nº 247/2011, 2011. Available at:
<http://www.tcu.gov.br/Consultas/Juris/Docs/judoc%5CResol%5C20120404%5CRES
2011-247.rtf>. Accessed on: Oct 12, 2012.
BRASIL. Ministério do Planejamento, Orçamento e Gestão. Secretaria de Logística e Tecnologia da Informação. Guia para Criação e Funcionamento do Comitê de TI, 2011b. Available at: < http://www.governoeletronico.gov.br/biblioteca/arquivos/guia-para-a-criacao-e-funcionamento-do-comite-de-ti>. Accessed on: Oct. 10, 2012.
BRASIL. Tribunal de Contas da União. Portaria TCU nº 156/2012, 2012. Available at: < http://www.tcu.gov.br/Consultas/Juris/Docs/judoc/PORTN/20120726/PRT2012-156.doc>. Accessed on: Oct. 18, 2012.
Castro, H. G. D.; Carvalho, M. M. D. Gerenciamento do portfolio de projetos: um estudo exploratório. Gestão & Produção, São Carlos, v. 17, n. 2, p. 283-296, 2010. Available at: <http://www.scielo.br/pdf/gp/v17n2/a06v17n2.pdf>. Accessed on: Oct. 5, 2012.
Decancq, K.; Lugo, M. A. Weights in multidimensional indices of well-being: an overview. Leuven (Be): Center for Economic Studies, 2010. Available at: <http://www.econ.kuleuven.be/eng/ew/discussionpapers/Dps10/Dps1006.pdf>.
Accessed on: Oct. 12, 2012.
Dolci, P. C.; Maçada, A. C. G. The dimensions of IT portfolio management (ITPM): an analysis involving IT managers in Brazilian companies. JISTEM Journal of Information Systems and Technology Management, São Paulo, v. 8, n. 2, 2011.
Available at:
GAO. INFORMATION TECHNOLOGY INVESTMENT MANAGEMENT - A Framework for Assessing and Improving Process Maturity. Washington, D.C. (USA): United States General Accounting Office, 2004. Available at: <www.gao.gov/cgi-bin/getrpt?GAO-04-394G>. Accessed on: Aug. 25, 2012.
Hayes, A. F. Beyond Baron and Kenny: Statistical Mediation Analysis in the New Millennium. Communication Monographs, v. 76, n. 4, p. 408‐420, 2009. Available at: <http://dionysus.psych.wisc.edu/lit/Articles/HayesA2009a.pdf>. Accessed on: Oct. 5, 2012.
Hayes, A. F. Mediate. My Macros and Code for SPSS and SAS, 2012a. Available at: <http://www.afhayes.com/public/mediate.pdf>. Accessed on: Oct 5, 2012.
Hayes, A. F. Process: A Versatile Computational Tool for Observed Variable Mediation, Moderation, and Conditional Process Modeling [White paper]. My Macros and Code for SPSS and SAS, 2012b. Available at: <http://www.afhayes.com/public/process2012.pdf>. Accessed on: Oct 5, 2012.
ISACA. Cobit 5 - A Business Framework for the Governance and Management of Enterprise IT. Rolling Meadows, IL (USA): ISACA, 2012. Available at: <http://www.isaca.org/COBIT/Pages/default.aspx>. Accessed on: Nov. 11, 2012.
ISACA. Cobit 5 - Enabling Processes. Rolling Meadows, IL (USA): ISACA, 2012b. Available at: <http://www.isaca.org/COBIT/Pages/Product-Family.aspx>. Accessed on: Nov. 5, 2012.
ITGI. Board Briefing on IT Governance, 2nd Edition. Rolling Meadows, IL (USA): IT Governance Institute, 2003. ISBN 1-893209-64-4. Available at: <
http://www.isaca.org/Knowledge- Center/Research/ResearchDeliverables/Pages/Board-Briefing-on-IT-Governance-2nd-Edition.aspx>. Accessed on: June 23, 2012.
ITGI. COBIT - Control Objectives for Information and related Technology. 4.1. ed. Rolling Meadows, IL (USA): Information Technology Governance Institute, 2007. Available at: <http://www.isaca.org/Knowledge-Center/cobit/Pages/Downloads.aspx>. Accessed on: Sept. 7, 2012.
ITGI. Enterprise Value Governance of IT Investments - The Val IT Framework 2.0 Extract. Rolling Meadows, IL (USA): IT Governance Institute, 2008. Available at: < http://www.isaca.org/Knowledge-Center/Val-IT-IT-Value-Delivery-/Documents/Val-IT-Framework-2.0-Extract-Jul-2008.pdf>. Accessed on: July 10, 2012.
Lunardi, G. L.; Becker, J. L.; Maçada, A. C. G. Um estudo empírico do impacto da governança de TI no desempenho organizacional. Produção, v. 22, n. 3, p. 612-624,
maio/ago 2012. Available at:
<http://www.scielo.br/pdf/prod/v22n3/aop_t6_0007_0374.pdf>. Accessed on: Oct. 20, 2012.
Mackinnon, D.P. Introduction to Statistical Mediation Analysis: Multivariate Applications Series. New York (USA): Lawrence Erlbaum Associates, 2008.
Markowitz, H. Portfolio Selection. Journal of Finance, v. 7, n. 1, p. 77-91, mar. 1952. Available at: <http://www.jstor.org/stable/2975974>. Accessed on: May 15, 2012.
Mcfarlan, F. W. Portfolio approach to information systems. Harvard Business Review, v. 59, n. 5, p. 142-150, set-out 1981. Available at: <http://hbr.org/1981/09/portfolio-approach-to-information-systems/ar/1>. Accessed on: Aug. 9, 2012.
Mello, Gilmar R. Governança corporativa no setor público federal brasileiro. Dissertação (mestrado em ciências contábeis) — Universidade de São Paulo, São Paulo, 2006.
Mendonca, Cláudio Márcio Campos de et al. Governança de tecnologia da informação: um estudo do processo decisório em organizações públicas e privadas. Rev. Adm. Pública, Rio de Janeiro, v. 47, n. 2, 2013.
Moraes, R. O.; Laurindo, F. J. B. Um Estudo de Caso de Gestão de Portfolio de Projetos de Tecnologia Da Informação. G&P Gestão & Produção, v. 10, n. 3, p. 311-328, dez. 2003. Available at: <http://www.scielo.br/pdf/gp/v10n3/19165.pdf>. Accessed on: April 21, 2012.
Peppard, J.; Ward, J.; Daniel, E. Managing the realization of business benefits from IT investments. MIS Quarterly Executive, v. 6, n. 1, p. 1-11, 2007. Available at: <http://misqe.org/ojs2/index.php/misqe/issue/view/21>. Accessed on: Oct 15, 2012.
PMI. The Standard for Portfolio Management. 2nd. ed. Newtown Square, Pennsylvania (USA): Project Management Institute, 2008.
Ramos, K. H. C. Governança e Gestão de Tecnologia da Informação: decompondo a organização em componentes com base em arquitetura organizacional orientada a serviços. Dissertação de Mestrado em Engenharia Elétrica, PPGENE.DM-410/09, Departamento de Engenharia Elétrica, Universidade de Brasília, Brasília, DF, xii, 203 p. 2009.
Tavakol, M.; Dennick, R. Making Sense of Cronbach’s alpha. International Journal of Medical Education, v. 2, p. 53-55, 2011. Available at: <http://www.ijme.net/archive/2/cronbachs-alpha.pdf>. Accessed on: Sept. 21, 2012.
Ward, J. M. A Portfolio Approach to Evaluating Information Systems Investments and Setting Priorities. Journal of Information Technology, v. 5, p. 222-231, 1990. Available at: <http://dx.doi.org/10.1057/jit.1990.46>. Accessed on: Jan. 18, 2012.
Weill, P.; Ross, J. W. Governança de TI: Tecnologia da Informação. Revisão Técnica: Tereza Cristina M. B. Carvalho. São Paulo: M. Books do Brasil Editora Ltda., 2006.
Weill, P.; Woerner, S. L.; Rubin, H. A. Managing the IT Portfolio (Updated Circa 2008):It's All About What's New. MIT Center for Information Systems Research - Research Briefing, Cambridge-MA (USA), v. VIII, n. 2B, July 2008.
APPENDIX A – Formulated questions and research variables
1. Questions about the IT investment portfolio management process (PROCPORTF):
1.1 The selection and prioritization of proposals for new IT solutions are based on clear and transparent criteria, previously known to all parties involved.
1.2 The selection and prioritization of proposals for new IT solutions take into account the strategic, financial, pro-improved performance and informational benefits that can be generated by each IT solution for the business.
1.3 The selection and prioritization of proposals for new IT solutions take into account the costs related to financial disbursements and the costs associated to their own personnel allocated to develop or contract, support and operate the IT solution, estimated both for the project phase, as well as for the operation phase.
1.4 The analyses associated to the benefits, costs and risks of new IT solutions are recorded/documented, in order to provide input for the monitoring of these elements
during the project phase, as well as during the solution’s operation phase.
1.5 The responsibilities of the IT area, of the demanding (interested) unit and of the IT steering committee or equivalent body regarding the selection/prioritization stage, as well as the operation and support stage of IT solutions, are well defined.
2. Questions about the IT Steering Committee or equivalent structure (COMITE):
2.1 The organization counts on one (or more) IT steering committee or equivalent
structure with representatives from business units that engage in the institution’s
governance and IT management.
2.2 The representatives of business units in the IT steering committee are heads of organizational units and not advisors or middle-management staff.
2.3 The IT steering committee decides (or is always consulted) on the selection and prioritization of IT projects/initiatives aimed at promoting new IT solutions.
2.4 The IT steering committee follows up/monitors the fulfillment of benefits, costs and risks of the most important IT solutions, during the project phase and during the operation and support phase.
3. Questions about IT solution managers or equivalent mechanism (GESTSOL):
3.2 The IT solution management unit preferably is the owner of the business process affected by the solution or is the demanding unit or is the unit most interested in the solution.
3.3 The management unit defines the functional, non-functional and security requirements of the IT area, as well as the business rules of the IT solution.
3.4 The managing unit, together with the IT area, defines the service levels for the IT solution and monitors their fulfillment for as long as the solution remains in operation.
3.5 The managing unit monitors the fulfillment of benefits, costs and risks during the operation phase of the IT solution.
4. Questions about satisfaction towards IT governance and management (EFETGOVTI):
4.1 The managers of internal units, IT area clients, and other stakeholders are satisfied with the selection and prioritization method for new IT solutions.
4.2 Internal clients and other stakeholders are satisfied with the number of demands per new IT system/solution that have still NOT been met by the IT area (pending requests or backlog).
4.3 Internal clients and other stakeholders are satisfied with the swiftness (deadlines) agreed upon and effectively fulfilled by the IT area for the delivery of new IT solutions.
4.4 Internal clients and other stakeholders are satisfied with the costs agreed upon and effectively fulfilled by the IT area for the delivery of new IT solutions.
4.5 Internal clients and other stakeholders are satisfied with the quality and the level of service presented by the IT solutions currently in operation.
APPENDIX B – Other properties of the sample
Group Qtty Average Standard deviation
“p” value
(bilateral)
Respondents from other inst. 117 9.2 1.1
0.553
TCU respondents 72 9.1 1.0
Managers 92 9.2 1.0
0.551
Non-managers 97 9.1 1.1
With IT Gov. course 131 9.4 0.8
0.036
Without IT Gov. course 58 8.8 1.5
IT personnel 151 9.1 1.1
0.088
IT area clients 38 9.4 0.9
IT auditors/consultants 84 9.3 0.9
0.070
Non IT auditors/consultants 105 9.1 1.2
Obs.: Because it refers to a non-normal, right-tailed, negative-skewed distribution, the Wilcoxon-Mann-Whitney hypothesis test was used in
substitution of Student’s t-test. The hypotheses tested are:
H0: The difference in the position between the two samples/groups is equal to 0.
H1: The difference in the position between the two samples/groups is different from 0
Group Qtty Average Standard deviation
“p” value
(bilateral)
Respondents from other inst. 117 9.0 1.3
0.036
TCU respondents 72 8.8 1.1
Managers 92 9.0 1.1
0.520
Non-managers 97 8.9 1.3
With course on IT Gov. 131 9.1 1.0
0.050
Without course on IT Gov. 58 8.6 1.5
IT area personnel 151 9.0 1.2
0.387
IT area client personnel 38 8.9 1.1
IT auditors/consultants 84 9.2 0.9
0.004
Non-IT auditors/consultants 105 8.7 1.3
Obs.: Because it refers to a non-normal, right-tailed, negative-skewed distribution, the Wilcoxon-Mann-Whitney hypothesis test was used in
substitution of Student’s t-test. The hypotheses tested are:
H0: The difference in the position between the two samples/groups is equal to 0.
H1: The difference in the position between the two samples/groups is different from 0
Group Qtty Average Standard deviation
“p”
vallue (bilateral)
Respondents from other inst. 117 9.0 1.2
0.218
TCU respondents 72 8.9 1.0
Managers 92 9.1 0.9
0.428
Non-managers 97 8.9 1.2
With course on IT Gov. 131 9.1 0.8
0.038
Without course on IT Gov. 58 8.7 1.4
IT area personnel 151 9.0 1.1
0.496
IT area client personnel 38 9.0 0.9
IT auditors/consultants 84 9.3 0.8
0.006
Non-IT auditors/consultants 105 8.8 1.2
Obs.: Because it refers to a non-normal, right-tailed, negative-skewed distribution, the Wilcoxon-Mann-Whitney hypothesis test was used in
substitution of Student’s t-test. The hypotheses tested are:
H0: The difference in the position between the two samples/groups is equal to 0.
H1: The difference in the position between the two samples/groups is different from 0
Group Cause 1
Cause 2
Cause 3
Cause 4
Cause 5
Cause 6
TCU respondents 56% 24% 69% 8% 53% 40%
Respondents from other inst.
80% 46% 83% 43% 52% 57%
Managers 76% 39% 76% 35% 52% 49%
Non-managers 67% 38% 80% 26% 53% 52%
With course on IT Gov. 72% 39% 81% 33% 52% 51%
Without course on IT Gov. 71% 37% 71% 25% 54% 50%
IT area personnel 79% 45% 79% 34% 47% 55%
IT area client personnel 42% 9% 76% 18% 76% 33%
IT auditors/consultants 68% 39% 78% 41% 48% 50%
Non-IT
auditors/consultants
75% 38% 78% 22% 57% 52%
Cause 1: Insufficient IT personnel
Cause 2: Lack of technical training by IT personnel
Cause 3: Lack of or shortcomings in IT governance and management processes Cause 4: Insufficient financial/budgetary resources
Cause 5: Alternatives regarding the provision of IT solutions are not sufficiently exploited (ex: in-house vs. outsourced development)
Cause 6: Shortcomings in management skills training for IT personnel
Obs: Respondents were allowed to select multiple causes or none of these causes; therefore, the variation possible for each of the causes is 0 to 100% for each stakeholder group.