Prevalence and Variables Associated with Physical Inactivity in
Individuals with High and Low Socioeconomic Status
Helena França Correia dos Reis, Ana Marice Teixeira Ladeia, Everton Carvalho Passos, Flávio Guilherme de Oliveira
Santos, Larissa Tapioca de Wasconcellos, Luís Cláudio Lemos Correia, Marta Silva Menezes, Renata Dáttoli Gouvêa
Santos, Victor Guerrero do Bomfim, Mário de Seixas Rocha
Escola Bahiana de Medicina e Saúde Pública, Salvador, BA - Brazil
Summary
Background: Studies that considered only the leisure physical activity found that the physical inactivity is higher among lower-income individuals. There is a possibility that this association shows modifications, when considering transportation, work and domestic activities.
Objective: To determine whether there is a difference between the prevalence of physical inactivity between individuals of high and low socioeconomic levels.
Methods: The sample consisted of individuals of both sexes, aged 18 or older, from two groups of different socioeconomic levels. The low socioeconomic level (LSEL) group consisted of the parents of students from a public school. The high socioeconomic level (HSEL) group consisted of the parents of students from a private College. The International Physical Activity Questionnaire (IPAQ) was used to determine the level of physical activity.
Results: A total of 91 individuals were evaluated in the LSEL group and 59 in the HSEL group. In the LSEL group, 42.9% (39) of the individuals were classified as insufficiently active, compared to 57.6% (34) of individuals in the HSEL group. Taking as a parameter of physical inactivity the time of weekly physical activity < 150 minutes, there was a decrease in the classification of inactivity in both groups, although with the maintenance of higher inactivity among individuals of HSEL (49.2% vs 28.6%; p= 0.01).
Conclusion: The individuals of HSEL are more sedentary than the individuals of LSEL. (Arq Bras Cardiol 2009;92(3): 193-198)
Key words: Physical activity; social class, exercise.
Mailing address: Mário de Seixas Rocha •
Rua Frei Henrique, 08, Nazaré - 40.050-420, Salvador, BA - Brazil E-mail: [email protected]
Manuscript received August 28, 2007; revised manuscript received December 24, 2007; accepted January 11, 2008.
Introduction
Although the regular practice of physical activity is considered an important resource to maintain and improve health1-4, the sedentary lifestyle is a universal problem1,5,6. The association between physical inactivity and socioeconomic level has been less studied1,3,7-12, being a controversial subject13. Studies that consider only the leisure physical activity suggest that the physical inactivity is higher among individuals with lower incomes13,14. However, when considering the transportation, work and domestic activities, an inverse correlation can occur between socioeconomic level and physical activity15. This suggests that the leisure activities alone underestimate the level of physical activity in individuals of low socioeconomic level. Therefore, using a score that considers the total of daily physical activity, this study aimed at identifying whether there is a difference in the prevalence of physical inactivity in individuals of low and high socioeconomic level
and identify the variables associated to physical inactivity. There is a possibility that the lack of information on the benefits of the regular practice of physical exercises and their role in the prevention of diseases is a determinant factor for the maintenance of a sedentary lifestyle. Thus, the study also evaluated the knowledge and perception of the individuals on exercising.
Methods
HSEL individuals consisted of the parents of EBMSP students, a private College.
The participation in the research was voluntary and the parents were asked to participate in the study by an invitation-letter. The questionnaires were filled out at the schools, through interviews.
The socioeconomic classification was carried out according to the Criterion of economic classification of Brazil – Brazilian Association of Research Enterprises (Associacao Brasileira de Empresas de Pesquisa - ABEP)16, which allows the stratification of the population in five socioeconomic classes (A to E). The short form of the International Physical Activity Questionnaire (IPAQ) in its 8th version was used to determine the level of physical activity. The validity and reproducibility of the IPAQ have been assessed in several centers17-20. To determine the level of physical activity, the prior week was considered as reference, with questions regarding the frequency and duration of the moderate or intense physical activity or walking.
The IPAQ allows categorical and continuous measurements. The continuous score allows the estimate of the energy expenditure expressed in MET.minutes/weeks. To perform this calculation, one multiplies the value of the energy expenditure in MET of the evaluated activity (walking = 3.3 MET, moderate physical activity = 4.0 MET and intense physical activity = 8.0 MET) by the frequency in days per week and the time in minutes reported for each activity.
The categorical score classifies the individuals as
Insufficiently active - Does not perform any physical activity or performs physical activity, but it is not enough to be classified as moderate or intense;
Sufficiently active - Performs intense physical activity at least three times a week, for at least 20 minutes per session, or performs moderate activity or walks at least 5 days a week for more than 30 minutes per session or performs any combined activity (walking+moderate+intense physical activity) more than 5 days a week with a score higher than 600 MET. minutes per week;
Very active - Performs more than three days a week of intense physical activity, accumulating 1,500 MET. minutes per week or combined activity more than 7 days a week, accumulating 3,000 MET. minutes per week21.
Some authors18,22 have considered physical inactivity as a time of physical activity per week < 150 minutes, which is in accordance with the recommendations for the practice of physical activity1. This parameter was considered in the present study for some analyses.
The dependent variable was the physical inactivity and the independent one was the socioeconomic level. The following variables were considered as co-variables: gender, age, ethnicity (Caucasian/Brazilian Mulatto/Black and other, in which the individuals that reported being Caucasian were grouped in the Caucasian group and the others were considered Non-Caucasian), civil status (with partner or without partner), body mass index – BMI (measured by dividing the weight in kilograms by the square of the height in meters) and classified as: Eutrophic, with BMI < 25 kg/m2; overweight, with BMI from 25 kg/m2 to 29.9 kg/m2; obese,
with BMI ≥ 30 kg/m2 as well as the knowledge and perception on physical exercises.
The knowledge and perception on physical exercises was assessed through a tool created by Domingues et al23, which consists of a questionnaire with 9 items regarding the knowledge of the benefits of physical exercises, sedentary lifestyle hazards and physical exercise indications, with scores varying from 0 to 25. The score values were categorized as 0 to 17 and from 18 to 25, where the latter indicates a higher level of knowledge on physical exercises.
The anthropometric measurements were carried out at the end of the interview. The body weight was measured using a TANITA digital scale, model 2001W-B. Height was measured using a portable Alturexata stadiometer, with a millimetric scale, placed on a smooth and flat surface, with the individuals wearing light clothes and barefoot.
The waist circumference (WC) was also assessed as an obesity measurement, considering the midpoint between the lower costal border and the iliac crest. Women with WC ≥ 80 and men with WC ≥ 94 were classified as presenting isolated nutritional risk (INR) for non-transmissible morbidities, regardless of the BMI category24.
The dependent variable was dichotomized in: active (sufficiently active and very active categories of the IPAQ) and inactive (insufficiently active category of the IPAQ). The BMI (< 25 kg/m2 and ≥ 25 kg/m2) and age (<48 years and ≥ 48 years) were recategorized for the analysis. The Chi-square test, when inadequate, Fisher’s exact test was used for the comparison of the categorical variables between inactive and active individuals, as well as between LSEL and HSEL individuals: gender, civil status, ethnicity, BMI and score of knowledge. The Student’s
t test and, when not possible, the Mann-Whitney test was used to establish the statistical significance of the difference between the continuous variables. The level of significance was set at p<0.05. The statistical analysis was carried out using the software package SPSS for Windows, version 12.0.
The research was approved by the Ethics Committee in Research of the Bahiana Foundation for Science Development and all participants signed the free and informed consent form.
Results
Characteristics of the population
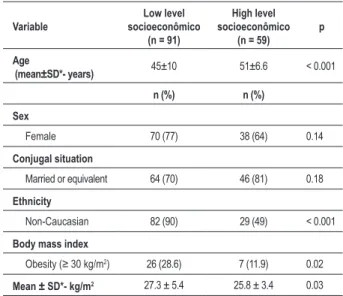
The study sample consisted of 150 individuals and 91 individuals (60.7%) were from Monte Gordo, whereas 59 (39.3%) were from Salvador. There was a predominance of the female sex in both groups: 77% (70) in Monte Gordo and 64% (38) in Salvador, with no intergroup difference (p= 0.14). In general, the individuals from Monte Gordo were younger (mean age of 45±10 years) than the individuals from Salvador (mean age of 51±6.6 years, p< 0.001) (Table 1).
Table 1 – Comparison of the samples regarding the sociodemographic characteristics and body mass index
Variable
Low level socioeconômico
(n = 91)
High level socioeconômico
(n = 59)
p
Age
(mean±SD*- years) 45±10 51±6.6 < 0.001
n (%) n (%)
Sex
Female 70 (77) 38 (64) 0.14
Conjugal situation
Married or equivalent 64 (70) 46 (81) 0.18
Ethnicity
Non-Caucasian 82 (90) 29 (49) < 0.001
Body mass index
Obesity (≥ 30 kg/m2) 26 (28.6) 7 (11.9) 0.02
Mean ± SD*- kg/m2 27.3 ± 5.4 25.8 ± 3.4 0.03
* SD - standard deviation.
Table 2 – Economic proile and degree of schooling of the samples
of high and low socioeconomic levels
Variable
Low socioeconomic
level (n = 91)
n (%)
High socioeconomic
level (n = 59)
n (%)
Socioeconomic level *
A 0 26 (44)
B 1 (1) 27 (45.8)
C 31 (34.1) 5 (8.5)
D 47 (51.6) 1 (1.7)
E 12 (13.3) 0
Degree of schooling
Illiterate 13 (14.3) 0
Incomplete Elementary school 55 (60.4) 3 (5)
Complete Elementary school 14 (15.4) 2 (3.4)
Complete High School 7 (7.7) 24 (40.6)
College or University 2 (2.2) 30 (51) *According with the Criterion of economic classiication of Brazil - Brazilian Association of Research Enterprises (Associação Brasileira de Empresas de Pesquisa - ABEP).
Considering the BMI, we did not observe differences between the low and high socioeconomic levels regarding the excess weight - BMI ≥ 25 kg/m2 (66% vs 56%, p= 0.23, for the low and high socioeconomic levels, respectively). Obesity (BMI ≥ 30 kg/m2) was predominant among LSEL individuals (28.6%
vs. 11.9%, p=0.02). However, no significant difference was observed regarding the WC means for the men (90.8±10.3
cm and 94.9±8 cm, p= 0.16) for the LSEL and HSEL groups, respectively and for women (87.9±13.2 cm and 86.2±9 cm, p= 0.45) for the LSEL and HSEL groups, respectively.
Regarding the presence of increased INR (WC ≥ 80 in women and WC ≥ 94 in men), no significant difference was observed between the groups, with 62.6% (57) in the LSEL and 71.2% (42) in the HSEL groups (p=0.28).
Prevalence of physical inactivity
According with the IPAQ classification, it was observed that 42.9% (39) of the individuals in the LSEL group were classified as insufficiently active, when compared to 57.6% (34) of the individuals in the HSEL group (p=0.006) (Table 3).
Considering as a parameter of physical inactivity a time of weekly physical activity < 150 minutes, there was a decrease in the classification of inactivity in both groups, although the HSEL individuals maintained a higher degree of inactivity (49.2% vs. 28.6%; p=0.01).
Characterization of the physical activity level
It was observed that a higher proportion (23.7%) of individuals of HSEL reported practicing no physical activity, in comparison to 11% of the LSEL group (p=0.04). Similar proportions of individuals of LSEL and HSEL did not walk for at least 10 minutes on any day of the week (27.5% vs. 30.5%, p=0.7; respectively). The proportion of individuals that reported practicing no moderate physical activity in the week before the interview was considerably higher among the HSEL individuals (61% vs. 31.9%, p=0.001). Regarding the intense physical activity, 91.5% of the HSEL individuals reported practicing no intense physical activity in the week before, in comparison to 71.4% of LSEL individuals (p=0.003). The proportion of HSEL individuals (76.3%) that practiced < 150 minutes per week of moderate physical activity was higher than the LSEL individuals (67%). It was observed that more LSEL individuals (6.6%) than HSEL (0%) were engaged in intense physical activity for 150 minutes or more per week.
The time of the physical activity among LSEL individuals was significantly higher than that among HSEL individuals (448±534 minutes vs. 197±243 minutes; p=0.001). The MET.minutes mean per week was significantly higher among LSEL individuals (1,805±2,112 vs 740±907; p<0.001).
Associated variables of physical inactivity
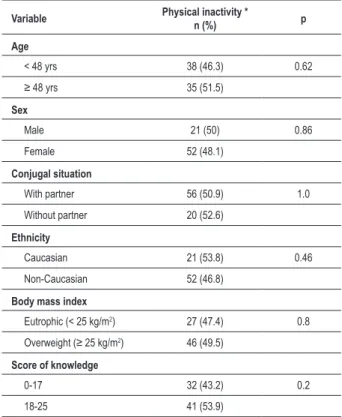
No significant association was found between the level of physical inactivity and age, gender, civil status, ethnicity,
Table 3 – Physical activity proile
Category of activity* LSEL HSEL
Insuficiently active 42.9% 57.6%
Suficiently active 38.5% 40.7%
Very active 18.7% 1.7%
Table 4 – Distribution of frequency of physical inactivity by sociodemographic characteristics, body mass index and score of
knowledge; Univariate analysis
Variable Physical inactivity *n (%) p
Age
< 48 yrs 38 (46.3) 0.62
≥ 48 yrs 35 (51.5)
Sex
Male 21 (50) 0.86
Female 52 (48.1)
Conjugal situation
With partner 56 (50.9) 1.0
Without partner 20 (52.6)
Ethnicity
Caucasian 21 (53.8) 0.46
Non-Caucasian 52 (46.8)
Body mass index
Eutrophic (< 25 kg/m2) 27 (47.4) 0.8
Overweight (≥ 25 kg/m2) 46 (49.5)
Score of knowledge
0-17 32 (43.2) 0.2
18-25 41 (53.9)
* Insuficiently active category of the IPAQ classiication.
BMI and score of knowledge about exercising (Table 4). The degree of physical inactivity was higher among the HSEL individuals (Table 3).
No differences were observed when comparing the measurement of the abdominal circumference between active and inactive individuals. Among the men, the mean for inactive individuals was 93.4±6.8 and 92.3±11.5 for the active ones (p=0.71). Among the women, the means were 87.3±10.7 and 87.3±13.1 (p=0.97), respectively, for active and inactive individuals.
The prevalence of physical inactivity did not differ between individuals with low and increased INR (49% vs. 48.5%, p=0.95, respectively); therefore, no association was found between INR and physical inactivity.
Knowledge and perception on exercising
The LSEL group presented a lower mean score of knowledge and perception on exercising, 15.8±3.7, when compared to the HSEL group, 19.4±2.8 (p<0.001). Regarding the categorical score, it was observed that 65% of the LSEL individuals are in the group with the least knowledge on exercising, compared to 25.4% in the HSEL group, p<0.001. Among the inactive individuals, the mean was 17±3.7 and among the active ones, 17±4.0 (p=0.70); therefore, there was no association between the knowledge on the importance of exercising and its practice.
Discussion
Our data demonstrate that HSEL individuals are more inactive than LSEL individual, regarding the prevalence of inactivity as well as the analysis of the physical activity time and energy expenditure. A first consideration is that LSEL individuals are more involved in work and domestic activities with higher energy expenditure, whereas the HSEL individuals are usually involved with low-intensity work activities. Another consideration is related to the more frequent use of active mobilization among the LSEL individuals. Although the short version of the IPAQ does not discriminate the type of physical activity that was performed, one can infer, considering that Monte Gordo is a low-socioeconomic level area, that the work and transportation activities represent an important part of the global physical activity.
Hallal et al22, when evaluating the prevalence of physical inactivity in southern Brazil in a sample of 3,182 individuals from the South region, found an inverse association between the level of physical inactivity and socioeconomic level, being observed approximately 47% in the upper classes and 35% in the lower classes, among men, and 46% and 39%, respectively, among women. Another Brazilian study25, carried out among the adult population of the town of Joaçaba, state of Santa Catarina, Brazil, found a prevalence of global physical inactivity of 57.4% and the highest rates of physical inactivity were also observed among the higher-income individuals. However, the upper social classes were more physically active in studies that evaluated the leisure physical activities14,26.
The prevalence of physical inactivity in the present study was high, especially among individuals of HSEL, which indicates a wide possibility of interventions. Regarding the international studies, similar levels of physical inactivity were observed in the USA (51.9%)17, and higher levels in the city of Bogota, Colombia, 63.2%27.
Both socioeconomic levels showed a decrease in the levels of physical inactivity (49.6% vs. 28.6%) when a score < 150 minutes per week of physical activity was used for its assessment, although a higher level of physical inactivity was maintained in the HSEL group. This is certainly due to the fact that our classification considers the total time of weekly physical activity, regardless of the regularity. Hallal et al22, in a population-based study carried out in the city of Pelotas, state of Rio Grande do Sul, Brazil, using the same definition, found a higher prevalence of physical inactivity (41%), whereas Ainsworth et al17 found 42.7% in the USA.
References
1. Haskell WL, Lee IM, Pate RR, Powell KE, Blair SN, Franklin BA, et al. Physical activity and public health: updated recommendation for adults from the American College of Sports Medicine and the American Heart Association. Circulation. 2007; 116 (9): 1081-93.
2. Franco OH, De Laet C, Peeters A, Jonker J, Mackenbach J, Nusselder W. Effects of physical activity on life expectancy with cardiovascular disease. Arch Intern Med. 2005; 165 (20): 2355-60.
3. Leitzmann MF, Park Y, Blair A, Ballard-Barbash R, Mouw T, Hollenbeck AR, et al. Physical activity recommendations and decreased risk of mortality. Arch Intern Med. 2007; 167 (22): 2453-60.
4. Nelson ME, Rejeski WJ, Blair SN, Duncan PW, Judge JO, King AC, et al. Physical activity and public health in older adults: recommendation from the American College of Sports Medicine and the American Heart Association. Circulation. 2007; 116 (9): 1094-105.
According to the current recommendations1, all healthy adult individuals aged 18 to 65 years need to perform moderate aerobic physical activity for at least 30 minutes, continuously or intermittently, for five days a week, or more intense aerobic physical activity, either three times a week, for 20 minutes continuously, or more, for intense physical activity.
In the studied sample, more individuals of LSEL than those of HSEL met the recommendations, regarding the moderate as well as the more intense activities. Regarding the moderate activities, 40% of the individuals of LSEL and 22% of those of HSEL met the recommendations, which are lower than the values observed among Saudi Arabian individuals (52.8%)29. Among the Americans, 48.2% meet the recommendations17. The situation is even more serious when one considers the more intense physical activity, when only 8% of individuals of HSEL and 3% of individuals of LSEL meet the recommendations; slightly higher proportions have been observed worldwide (11.3%)29.
National studies also showed low proportions of physical activity engagement according to the CDC recommendations. Hallal et al15 found 26.9% and 9.9% for moderate activities in Pelotas and São Paulo, respectively, and 18.7% and 12.1% for more intense activities in São Paulo and Pelotas, respectively.
The decline in the leisure physical activity with age has been described in the literature26,28,30. Regarding the global physical activity, studies have observed a prevalence of stable global inactivity up to 60 years, with a significant increase after that age22,29. Recent data have confirmed the decrease in the levels of physical activity among individuals aged 65 years or older1. Considering the individuals in this sample, however, age did not significantly influence the level of physical inactivity. Although the group with LSEL presented a lower mean age, both samples consisted of young individuals.
There was no association between BMI and physical inactivity in the present study. The BMI is not specific for the measurement of body fat and the physical activity can stimulate muscular growth. Other studies did not show higher levels of sedentary lifestyle among obese individuals, either22,26. When the abdominal circumference was considered, no differences were observed between the two socioeconomic levels and between active and inactive individuals, which are similar to the data from another national study24.
An association between gender and physical inactivity was
not observed in the present study, which corroborates the findings by Baretta et al25, who did not find any differences regarding the global physical activity between the genders. Still regarding the global physical activity, Al-Hazzaa29 found a significantly higher level of inactivity among men. However, lower levels of physical activity were observed among women when considering only the leisure activities26.
Our findings reinforce the idea that the socioeconomic level can influence physical activity (leisure, transportation, domestic and work activities) in different forms.
An interesting aspect is that the lower level of physical inactivity among individuals of low socioeconomic level might be due to transportation alternatives, with the use of active means of transportation such as walking and bicycling or a greater physical effort at work, even if it is not associated with the awareness of the actual benefits of a more active lifestyle for health maintenance. Therefore, it is feasible for an individual of low socioeconomic level to be active. Other studies are necessary to detect differences regarding the physical activity domains and which the barriers and facilitators are for the practice of physical activity at each socioeconomic level.
Conclusion
Based on the results obtained with the present study, it is noteworthy that individuals of high socioeconomic level are more inactive than the ones of low socioeconomic level, despite the fact that the first present a higher degree of awareness and perception about exercising.
Potential Conflict of Interest
No potential conflict of interest relevant to this article was reported.
Sources of Funding
This study was partially funded by Fundação de Amparo a Pesquisa do Estado da Bahia.
Study Association
5. Centers for Disease Control and Prevention (CDC). Prevalence of regular physical activity among adults--United States, 2001 and 2005. MMWR Morb Mortal Wkly Rep. 2007; 56 (46): 1209-12.
6. Jardim PC, Gondim MR, Monego ET, Moreira HG, Vitorino PV, Souza WK, et al. High blood pressure and some risk factors in a Brazilian capital. Arq Bras Cardiol. 2007; 88 (4): 452-7.
7 . Fagard RH, Cornelissen VA. Effect of exercise on blood pressure control in hypertensive patients. Eur J Cardiovasc Prev Rehabil. 2007; 14 (1): 12-7.
8. Hu G, Tuomilehto J, Borodulin K, Jousilahti P. The joint associations of occupational, commuting, and leisure-time physical activity, and the Framingham risk score on the 10-year risk of coronary heart disease. Eur Heart J. 2007; 28 (4): 492-8.
9. Lanas F, Avezum A, Bautista LE, Diaz R, Luna M, Islam S, et al. Risk factors for acute myocardial infarction in Latin America: the INTERHEART Latin American study. Circulation. 2007; 115 (9): 1067-74.
10. Mora S, Cook N, Buring JE, Ridker PM, Lee IM. Physical activity and reduced risk of cardiovascular events: potential mediating mechanisms. Circulation. 2007; 116 (19): 2110-8.
11. Monninkhof EM, Elias SG, Vlems FA, van der Tweel I, Schuit AJ, Voskuil DW, et al. Physical activity and breast cancer: a systematic review. Epidemiology. 2007; 18 (1): 137-57.
12. Abu-Omar K, Rutten A, Lehtinen V. Mental health and physical activity in the European Union. Soz Praventivmed. 2004; 49 (5): 301-9.
13. Gidlow C, Johnston LH, Crone D, Ellis N, James D. A systematic review of the relationship between socio-economic position and physical activity. Health Education Journal. 2006; 65 (4): 366-95.
14. Marshall SJ, Jones DA, Ainsworth BE, Reis JP, Levy SS, Macera CA. Race/ ethnicity, social class, and leisure-time physical inactivity. Med Sci Sports Exerc. 2007; 39 (1): 44-51.
15. Hallal PC, Matsudo SM, Matsudo VK, Araujo TL, Andrade DR, Bertoldi AD. Physical activity in adults from two Brazilian areas: similarities and differences. Cad Saude Publica. 2005; 21 (2): 573-80.
16. ABEP- Associação Brasileira de Empresas de Pesquisa. CCEB. Critério de Classificação Econômica Brasil. [citado 2005 jun 23]. Disponível em: http:// www.abep.org.br.
17. Ainsworth BE, Macera CA, Jones DA, Reis JP, Addy CL, Bowles HR, et al. Comparison of the 2001 BRFSS and the IPAQ Physical Activity Questionnaires. Med Sci Sports Exerc. 2006; 38 (9): 1584-92.
18. Craig CL, Marshall AL, Sjostrom M, Bauman AE, Booth ML, Ainsworth BE, et al. International physical activity questionnaire: 12-country reliability and validity. Med Sci Sports Exerc. 2003; 35 (8): 1381-95.
19. Macfarlane DJ, Lee CC, Ho EY, Chan KL, Chan DT. Reliability and validity of the Chinese version of IPAQ (short, last 7 days). J Sci Med Sport. 2007; 10 (1): 45-51.
20. Rutten A, Abu-Omar K. Prevalence of physical activity in the European Union. Soz Praventivmed. 2004; 49 (4): 281-9.
21. IPAQ - International Physical Activity Questionnaire. Guidelines for data processing and analysis of the International Physical Activity Questionnaire (IPAQ) - Short and long forms. 2005. [citado 2006 mar 5]. Disponível em: http://www. ipaq.ki.se/dloads/IPAQ%20LS%20Scoring%20Protocols_Nov05.pdf.
22. Hallal PC, Victora CG, Wells JC, Lima RC. Physical inactivity: prevalence and associated variables in Brazilian adults. Med Sci Sports Exerc. 2003; 35 (11): 1894-900.
23. Domingues MR, Araujo CL, Gigante DP. Knowledge and perceptions of physical exercise in an adult urban population in Southern Brazil. Cad Saude Publica. 2004; 20 (1): 204-15.
24. de Freitas SN, Caiaffa WT, Cesar CC, Faria VA, do Nascimento RM, Coelho GL. Nutritional risk in the urban population of Ouro Preto, southeastern region of Brazil: the Ouro Preto heart study. Arq Bras Cardiol. 2007; 88 (2):191-9.
25. Baretta E, Baretta M, Peres KG. Physical activity and associated factors among adults in Joacaba, Santa Catarina, Brazil. Cad Saude Publica. 2007; 23 (7): 1595-602.
26. Dias-da-Costa JS, Hallal PC, Wells JC, Daltoe T, Fuchs SC, Menezes AM, et al. Epidemiology of leisure-time physical activity: a population-based study in southern Brazil. Cad Saude Publica. 2005; 21 (1): 275-82.
27. Gomez LF, Duperly J, Lucumi DI, Gamez R, Venegas AS. Physical activity levels in adults living in Bogota (Colombia): prevalence and associated factors. Gac Sanit. 2005; 19 (3): 206-13.
28. Pitanga FJ, Lessa I. Prevalence and variables associated with leisure-time sedentary lifestyle in adults. Cad Saude Publica. 2005; 21 (3): 870-7.
29. Al-Hazzaa HM. Health-enhancing physical activity among Saudi adults using the International Physical Activity Questionnaire (IPAQ). Public Health Nutr.2007; 10 (1): 59-64.