*e-mail: [email protected]
A progressive vector map browser for the web
José Augusto Sapienza Ramos
1*, Claudio Esperança
2, Esteban Walter Gonzales Clua
11Computer Science Institute, Federal Fluminense University – UFF, Niterói, RJ, Brazil
2Alberto Luiz Coimbra Institute for Graduate Studies and Research in Engineering - COPPE,
Federal University of Rio de Janeiro – UFRJ, Brazil
A previous version of this paper appeared at GEOINFO 2008 (X Brazilian Symposium on Geoinformatics) Received: March 10, 2009; Accepted: June 16, 2009
Abstract: With the increasing popularity of web-based map browsers, remotely obtaining a high quality depiction of cartographic information has become commonplace. Most web mapping systems, however, rely on high-capacity servers transmitting pre-rendered tiled maps in raster format. That approach is capable of producing good quality renderings on the client side while using limited bandwidth and exploiting the browser’s image cache. These goals are harder to achieve for maps in vector format. In this work, we present an alternative client-server architecture capable of progressively transmitting vector maps in levels-of-detail (LOD) by using techniques such as polygonal line simplification, spatial data structures and, most importantly, a customized memory management algorithm. A multiplatform implementation of this system is described, where the client application is written entirely in JavaScript and processed within the web browser, avoiding the need of external applications or plug-ins. Results of experiments aimed at gauging both the performance and the display quality obtained with the system are presented and explained. Extensions to the system are also discussed, including issues such as level-of-detail versus visual importance tradeoffs and the handling of closed polygonal lines.
Keywords: vector maps, map browsers, progressively transmitting, level of detail, client-server architecture.
1. Introduction and Related Work
The increasing popularity of web-based systems and serv-ices for delivering maps can be regarded as one of the most important developments in the advancement of cartography. Several aspects of these systems have merited investigation in recent years, such as the improving reliability of the Internet and web server infrastructure, ascertaining the quality and fidelity of the served data, coping with privacy and secu-rity issues, maximizing the use of screen space, and making rational usage of the available bandwidth33.
One important design decision when building a web mapping application is the choice between raster and vector data structures. Authors such as Burrough and McDonnell16 and Casanova et al.21 compare both in the context of Geographical Information Systems. In a nutshell, raster data structures are simple to process, are supported by inexpen-sive technologies and may be stored in a wide variety of formats. On the other hand, vector data structures are more compact, support accurate representation of geometric data at all scales, and allow an explicit topology description. Thus, vector data structures offer distinct advantages for serving maps on the web, as long as it is possible to circumvent its heavier use of memory and processing resources.
Some of the most popular web mapping systems, such as Google Maps9 or Yahoo Maps36, are mostly raster-based, i.e., they serve pre-rendered digital images. Maps are first rendered in several resolutions in the server, cut into blocks (called tiles), and then sent to clients based on the desired
area and zoom level. The key reasons for using rasters are: 1) all work spent in authoring a good quality representation can be done on the server, while the client merely composes a big picture from several small image tiles; 2) the transmission of raster data of fixed size uses limited bandwidth; 3) web browsers already manage image caches and, thus, little or no memory management is needed on the client side; and 4) until recently, most popular browsers did not support vector data natively, requiring the installation of additional applications or plug-ins.
features in vector data structure to be processed across the web using platform-independent calls18, 22.
It should be mentioned that client-side web programming has been on the rise in recent years. In particular, the so-called JavaScript engines of popular browsers have become more efficient and capable. This follows the trend of web service providers striving to offer more flexibility in their client-side applications.
In summary, advances in web technology have made possible a new class of web mapping applications, where features are represented, transmitted and displayed in vector rather than raster format, without resorting to external plug-ins or applications. For instance, several of such appli-cations based on SVG can be reached through the carto:net portal5.
The technology for serving maps in vector form has been intensely researched (see Kraak and Brown4 for a survey). An adequate solution for the problem clearly depends on the usage of techniques for hierarchically organizing vector data according to its visual importance, obtaining what is usually known as level-of-detail (LOD) data structures6. The proper nesting of the detail data needs to conform to topological and geometric criteria, in order to ensure that key elements such as road crossings or riverbed centerlines do not drift between LODs3.
At the same time, some sort of spatial indexing is usually required for quickly retrieving data overlapping the region of interest10. Several authors have also investigated suitable techniques for memory caching of spatial data with and without prefetching31, 32, as well as methods appropriate for handling multi-resolution vector data25.
Whereas many authors have delved in the the geomet-rical and topological aspects of organizing vector map data in order to support its progressive transmission over the web, a less studied aspect of web cartography is the relationship between the level of detail of the data being served, the use of bandwidth and client memory management. In particular, many systems assume that all clients have the same (small) amount of memory at their disposal and, as a consequence, statically link the level-of-detail of the served map to the size of the area being viewed, or, more frequently, simply ignore the problem of the memory organization of the client3.
This paper is an extension of Ramos et al.12, 22. Below, we present data structures and algorithms which make it possible to remotely deliver and present high-quality vector maps in a progressive manner, making efficient use of the available bandwidth, and adapted to the memory profile of any given client without encumbering the communica-tion protocol with informacommunica-tion about client memory state. In particular, although the server receives from the client only information pertaining to the area being viewed, i.e., the client view window, it is able to guess and progressively transmit only needed data. With respect to earlier reports of this work, the following points deserve mentioning: 1) The client is implemented in JavaScript and is processed entirely within the web browser rather than within a separate client application; 2) the client-server architecture is described in
significantly more detail; 3) a larger set of experiments are presented and analyzed; and 4) finally, we discuss exten-sions, such as working with closed polygonal lines and working with tradeoffs between visual importance and levels of detail.
2. Overall System Architecture
According to McMaster and Shea24, around 80% of the total data in vector geographical databases are polygonal lines. This statement guides the scope of the proposed archi-tecture: 1) only vector maps with open or closed polygonal lines are considered, and 2) the use of network bandwidth is optimized by restricting the transmission of line data with just enough detail for a faithful representation.
Thus, we propose a client-server system for serving map data containing a program (the server) capable of directly accessing all polygonal lines of a given map – from a data-base, for instance – and progressively sending it to interactive visualization applications (the clients). Clients have limited memory capacity and thus store only enough line data so as to present a good depiction of the map within a visualization window. Each time a user changes this window, the contents of the client memory must be updated by requesting relevant data from the server and discarding unneeded information.
The system preprocesses all polygonal lines comprising the map into two hierarchical data structures, which can be quickly traversed in order to obtain the needed informa-tion. The two structures used are: 1) a spatial index, which is needed to prune out polygonal lines which do not contribute to the current viewing window, and 2) a structure for organ-izing the vertices of each polygonal line in order of visual importance – the so-called level-of-detail (LOD) data struc-ture. It should also be mentioned that the present architecture does not handle polygonal line importance classification, i.e., it is considered that all polygonal lines intersecting a given window need to be drawn at some level of detail. Although map visualization applications typically provide some way of establishing which lines can be left out when rendering the map at certain zoom levels, we do not concern ourselves with this feature in this paper.
3. Server-side Preprocessing
For each map being served, their polygonal lines must be submitted to a preprocessing step in order to 1) build a hier-archical level-of-detail data structure for their vertices, and 2) build a spatial index used to support window queries.
3.1. Level-of-detail data structure
As a rule, any scheme for organizing vector data in levels of detail should employ some method for the simplification of polygonal lines24. Such methods have been researched actively since the 60s (see Davis6 for a comprehensive compi-lation) with the purpose of obtaining line representations suitable for being used at varying viewing scales. Among these, we have chosen to employ the well-known Douglas-Peucker (DP) line smoothing algorithm19. Although it is not a particularly fast algorithm, running in O(nlog n) at best and O(n2) in the worst case27, it is ranked as the best when it comes to preserving the shape of the original line17. Furthermore, it produces a hierarchical representation which can be used for level-of-detail processing.
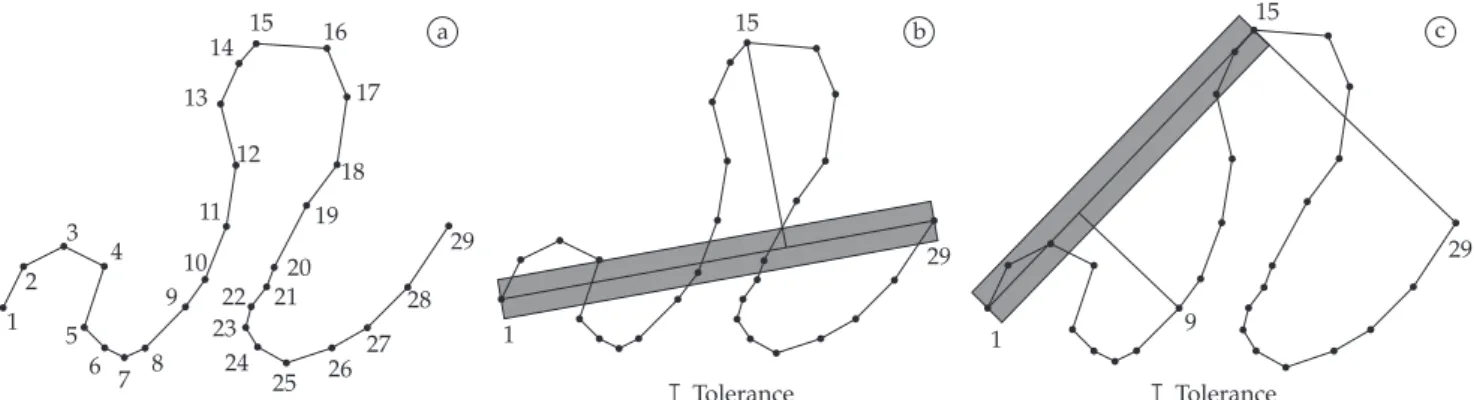
The DP algorithm recursively subdivides a polygonal line by selecting the vertex at greatest distance from the line segment defined by the first and last point. Figure 1 illustrates this process for an example line. Observe that the subdivision process can be registered in a binary tree, where each node N corresponds to a subdivision vertex and the corresponding distance dN, whereas its left and right sons correspond to sub-trees for the left and right sub-chains of the original polygonal line. Thus, an approximation within tolerance ε for the polygonal line can be extracted by visiting the tree in pre-order and pruning out branches rooted at nodes with distances dN < ε.
In this work, we are interested in obtaining increas-ingly finer representations for each polygonal line. This can easily be implemented by quantizing tolerance values into an integer range [1, MaxLOD]. A coarse representation will thus be assigned to level-of-detail (LOD) 1 by visiting the tree in pre-order for tolerance ε1. Vertices in this representation are then marked with LOD = 1. The process is repeated for
increasingly smaller tolerances εi for i = 2…MaxLOD, and in each stage i, non-marked vertices are labeled with the corre-sponding LOD = i value. An important consideration in this process is that, ideally, the number of vertices marked for each LOD value should be approximately constant, so that transmitting the next finer representation of a given line (see constant δ in Section 4) can be done in constant time. In our implementation, ε1 is chosen as the distance in world coordi-nates corresponding to the width of a pixel for a fully zoomed out projection of the map, while successively finer tolerances were estimated by setting εi+1 = 0.8εi.
3.2. Spatial indexing
In theory, the worst case scenario for vector map browsing consists of setting the viewing window so that it encloses all polygonal lines. In practice, however, users frequently are interested in investigating a small portion of the whole map. It stands to reason, therefore, to use some spatial indexing selecting polygonal lines intersecting any given query window.
Although the present work does not focus on the issue of efficient spatial indexing, we surveyed several works in the field (see Samet23 for a comprehensive compilation) and chose the relatively simple Expanded MX-CIF Quadtree26 data structure for speeding up window queries.
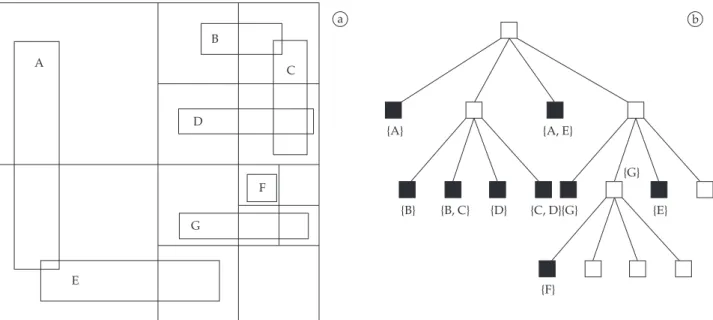
This is a data structure for rectangles which, in the context of this work, correspond to each polygonal line minimum enclosing bounding box. Each rectangle is represented in the data structure by a collection of enclosing quadtree blocks. In our implementation, this collection contains a maximum of four blocks, although other configurations might also be possible. The four blocks are obtained by determining the minimum enclosing quadtree block, say B, for each rectangle, say R, and then splitting B once to obtain quadtree blocks Bi (i ∈{NW, NE, SW, SE}) such that Ri is the portion of R, if any, that is contained in Bi. Next, for each Bi we find the minimum enclosing quadtree block, say Di, that contains Ri. Now, each rectangle is represented by the set of blocks consisting of Di (refer to Figure 2 for an example). Window queries can be easily computed by means of a recursive descent algorithm
1 1
1 2
3 4
5 6
7 8 9
9 11
12 13
14
15 16 15 15
17
18
19
10 21 22 23
24
25 26 27
28 29
29 29
20
a
Tolerance Tolerance
b c
on the tree, i.e., start with the root and recursively visit sons if their quadrants intersect the given window.
The simple example helps understanding the structure. Consider, for instance, rectangle G as shown in Figure 2a. First, the smallest quadrant R enclosing G is found – the lower right quadrant, in this case, corresponding to the right-most branch of the root node in Figure 2b. In the MX-CIF variant used in this work, one additional subdivision of R is required, where portions of G intersecting each of the four subquadrants of R are generated, namely, GNW, GNE, GSW and GSE. Since GNW and GNE are empty, references to G are stored only in RSW and RSE, as can be observed in Figure 2b.
The key advantadge of the MX-CIF structure over other similar structures for indexing rectangles is that, like the R-tree and its variants, and unlike other quadtree variants such as the PMR-quadtree, it stores references to the indexed object in a constant number of tree nodes, thus guaran-teeing that the structure has O(n) size, where n is the number of rectangles. On the other hand, unlike the R-tree, it is a genuine space partitioninig data structure, meaning that each point of the space is represented by a single leaf node23. As with other structures for indexing spatial data with extent, its asymptotic time complexity with respect to window queries is dependent on the spatial distribution of the indexed data. Clearly, no window query will run slower than O(n), since that corresponds to the size of the whole data structure. In practice, however, at least for small windows, its expected running time is O(flogn), where f is the size of the answer.
4. Memory Management
In the context of a client-server system, the issue of memory management should be governed by the following considerations:
Memory capacity: It is assumed that the client memory is bounded by some given constant. At any time, the client has its memory partially occupied with a subset of the map’s polygonal lines at some level-of-detail. When the user changes the viewing window, i.e., performs a zooming or panning operation, the memory contents should be altered if it does not contain a “good” representation of the map as revealed by the newly defined window.
Memory control protocol: When requesting new data from the server, some agreement must be reached on what data is needed. In other words, the server must either be told, or must already know what data to transmit to the client in response to a user action. Thus, there are two general approaches for the control protocol: 1) the client requests the needed data items, meaning that the server does not know the client memory’s contents, or 2) the server is aware of the memory management operations performed by the client by simulating the same operations as stipulated by a fixed algorithm. Clearly, the former approach uses more band-width than the latter. On the other hand, CPU usage could be greatly increased if the server reproduces operations of all clients. In this work, we adopt the second strategy, where the increase in time complexity is alleviated by employing a rela-tively simple memory management rationale which can be executed in tandem by both server and client.
In order to describe our approach, let us first define a few terms:
• M is the maximum client memory size;
• m is the amount of data that can be transmitted from the server to the client in one transaction, i.e., in time for the client displaying the next frame;
• W is the current viewing window; A
E
B
D
C
F
G
{A}
{B} {D} {G}
{G}
{E}
{F} {B, C} {C, D}
{A, E}
a b
• S = {Li} is the current resident set, i.e., the set of polygonal lines Li that intercept the current viewing window W;
• LOD(L) is an integer in [0,MAXLOD(L)] representing the level-of-detail of polygonal line L. It is assumed that if L ∉ S, then LOD(L) = 0;
• BestLOD(L,W) be an estimate for the “best” level-of-detail for exhibiting a polygonal line L in viewing window W. In our implementation, this function returns 0 if L is not visible within W. For instance, an estimate is computed using the length of the shortest edge of L at a given LOD as a measuring stick. In other words, suppose that the current width of a pixel has size d in world space, then the “best” LOD corresponds to the biggest (i.e., finest) LOD for which the shortest edge is still bigger than d. The rationale is that using a finer LOD would not improve the display quality by much since it would probably lead to drawing details smaller than the pixel size; and
• δ is an estimative of how much memory is associated with increasing or decreasing a level-of-detail step for any given polygonal line L. In other words, on average, a polygonal line L should occupy approxi-mately δ × LOD(L) memory.
Adjusting the items resident in memory requires two classes of operations: operations that increase and operations that decrease the use of memory. Operations in the first class makes some data to be transferred from the server to the client. We distinguish two of these:
1. IncreaseLOD(L) increases the level-of-detail for polyg-onal line L. This means that if LOD(L) = k > 0, then after its execution LOD(L) = k + 1; and
2. Load(L) brings polygonal line L from the server in its coarsest form. As a precondition, LOD(L) and after its execution, LOD(L) = 1.
The second class corresponds to operations which cause data to be thrown away from client memory. Observe that these operations do not cause any network traffic between server and client. We also define two operations of this class: 1. DecreaseLOD(L) decreases the level-of-detail for
polygonal line L; and
2. Unload(L) unloads polygonal line L from memory altogether.
Thus, any memory management algorithm will consist of sequentially performing these operations in some order in a timely manner and without infringing memory limits M and m. Our algorithm uses two heaps, defined as I and D, which hold operations of each of the two classes described above. A crucial consideration is how to define the ordering between operations in each heap. Clearly, operations of type Load should have a higher priority than all operations of type IncreaseLOD. Similarly, operations of type DecreaseLOD should have higher priority than operations of type Unload. In our implementation, the ordering between operations IncreaseLOD for two lines L1 and L2 depend on how distant the LOD’s of each line are from their estimated “best”. In other
words, we use |BestLOD(L) – LOD(L)| as a priority measure. The priority between operations DecreaseLOD is defined in a similar way. Algorithm 1, called as DefineOperations, describes how the two heaps are created.
Once the operation heaps are known, client and server process them in parallel. Operations are executed constrained to the memory and bandwidth restrictions, as discussed above. Algorithm 2, called as ExecuteOperations, summa-rizes the rationale for operation execution. It is important to realize that executing an operation has different meanings for client and server. For instance, executing an IncreaseLOD operation in the client entails receiving line detail from the server and updating the geometry for that line, while for the server it means merely sending the additional vertices.
Algorithm 1. DefineOperations.
begin
Input: Wnew: the new window set by the user
Output: Iand D: heaps containing operations wich cause memory increase/decrease
then for L∈ S' S do
for i LOD(L) + to
for i LOD(L, Wnew) + to if L∉S then
if L∉S’ then
if LOD(L) < BestLOD(L, Wnew) then
else if LOD(L) > BestLOD(L, Wnew)
BestLOD(L, Wnew) do
LOD(L) do
end
I Ø
D Ø
S’ set of lines wich intersect Wnew
Enqueue [Load, L] in I
Enqueue [IncreaseLOD, L] in I
Enqueue [DecreaseLOD, L] in D
Enqueue [Unload, L] in D
Algorithm 2. ExecuteOperations.
Input: Iand D: heaps containing operations memory management operations
while I Ø and t < m do if |S|+ δ > M then
t 0
[op, L] Dequeue from D
[op, L] Dequeue from I
begin
end
execute op(L)
execute op(L)
else
Similarly, while DecreaseLOD entails updating the polygonal line data structure for the client, the server needs only to take note that the corresponding memory was disposed in the client.
A limitation of Algorithm 2 is related to the fact that δ is merely an estimate of the amount of memory associated with decreasing or increasing the LOD of any given line. This may lead to |S|, the amount of memory used for the polygonal data, eventually exceeding M if the newly received LOD data is bigger that δ. This, in general, is not a problem since the overflow should be small on average. In any case, the restric-tion can easily be lifted by assigning to δ a sufficiently large value.
Note that the scheme described above is easily adapted to support progressive transmission. Suppose that Algorithm 2 terminates with a non-empty heap I. Then, if the viewing window for the next frame is unchanged, there is no need to run Algorithm 1 again, and the next execution of Algorithm 2 will further process heaps I and D, thus providing an increas-ingly finer rendering of the map, as illustrated in Figure 6.
4.1. A step-by-step example
These algorithms may be better understood by following example. Let
• DS = [L1, L2, L3, L4, L5] be a list containing the polygonal lines of a given map;
• S = [L1, L2, L4, L5] be the subset of lines currently resi-dent in a client’s memory;
• W0 be the current viewing window;
• A=[3,2,0,2,1] be a list with the current LODs for DS in the client, i.e., [LOD(L,W0), ∀L ∈ DS]; and
• LOD(L)≥BestLOD(L,W0), ∀L∈ S, meaning that heap I is currently empty.
At this point, assume that a navigation operation issued by the user defines a new viewing window W1, making the client inform this alteration to the server and causing both to execute Algorithm 1. Suppose further that the new situation is such that:
• S’ = [L1, L2, L3] is the set of lines which intersect W1; and
• the targetLODs for DS in the client are given by [BestLOD(L,W1); ∀L∈S] = [4,4,4,0,0].
As a result, the following heaps are built (leftmost opera-tions have higher priority):
• I = [LoadL3, IncreaseLODL3, IncreaseLODL2, IncreaseLOD L3, IncreaseLOD L1, IncreaseLOD L2, IncreaseLOD L3]; and
• D = [DecreaseLODL4, UnloadL4, UnloadL5].
The progressive transmission of the changes is then initi-ated by the server executing Algorithm 2, forming a block and sending it over to the client. The client, in turn, having also executed Algorithm 1 for the same input, will receive the block from the server, thus effecting the changes to its memory and generating a new display of the window. This
cycle is repeated until both parties have an updated list A. It should be mentioned that this repetition may be interrupted if, say, the user navigates to another viewing window W2.
5. Implementation
A prototype implementation of the framework described in this paper was built and several experiments conducted in order to validate our proposal.
The development was supported by the following tools: user interfaces were built with version 4.4.1 of the multi-plat-form Qt28 library and the Shapelib library v. 1.2 was used for reading Shapefiles15.
The preprocessor was written in C++ and compiled using version 4.1 of the gcc compiler7. The server program which implements the algorithms described above was written in Python (version 2.5.3)20. The client program is in the form of JavaScript code so that it may be run in web browsers using no additional software. The client was developed in the Processing Language1 and ported to JavaScript using the tools described in Resig13. Communication between clients and server use the XML-RPC specification, a protocol for Remote Procedural Call (RPC) coded in XML30. It is impor-tant to remark that all of these tools are Open Source and, thus, freely available.
The preprocessing described in Section 3, was carried out with a dedicated program which: 1) reads polygonal map data in Shapefile format, 2) executes the Douglas-Peucker algorithm and computes the level-of-detail hierarchy for each polygonal line, 3) creates an extended MX-CIF Quadtree for supporting window queries, and 4) saves the relevant infor-mation into a structured XML (eXtensible Markup Language) file which is used as input for the server program.
The system deployment is straightforward, requiring only that a server process is started in some computer and one or more client processes are started in some machine connected to the server by a TCP/IP network. Starting a client consists of pointing the web browser to the html page containing the client code, which can reside in any machine connected to the network. When initialized, the server will load the XML generated in the preprocessing stage. When a client connects to the server, it informs its cache memory size and transmission block size, i.e., constants M and m discussed in Section 4. The server then sends a reply message containing the coarsest possible map representa-tion and a compressed representarepresenta-tion of the MX-CIF data structure, i.e., a relatively small data structure. After this initialization stage, the communication protocol proceeds as discribed in the above sections.
200834. According to compatibility tests performed with our prototype, the client worked perfectly with Mozilla Firefox versions 2.0 and 3.0 and Google Chrome version 1.0. Unfortunately, Microsoft’s Internet Explorer versions 7.0 and 8.0 do not support the Canvas element, although the latter may be extended with this feature by means of an extension called ExplorerCanvas provided by Google8. Other popular browsers such as Opera 9.0 and Apple’s Safari 2.0 reportedly support the Canvas element, but have not been tested.
6. Results
Two sets of experiments were conducted in order to assess important aspects of the system described herein. In the first set, the system was monitored in order to obtain information about the use of bandwidth, the use of cache memory and the display quality exhibited at the client during a map browsing session consisting of several pan and zoom operations. The second set of experiments uses two versions of the same data set – one with roughly 10 times more information than the other – in order to contrast the system behavior when serving small and large data sets.
For all maps used in the experiments, polygons are described as open polygonal lines as defined by the Polygon-arc Topology21, 2. This data structure removes dupli-cate paths which separate adjoining polygons leading to a more compact representation. The topology of the polygonal subdivision must however be represented separately. It should be mentioned, however, that our prototype does not render close polygons, but only polygonal lines.
6.1. First set of experiments
The goal of the first set of experiments was to assess system performance indicators such as the use of client cache memory, the use of network bandwidth and overall display quality as perceived by the client.
Test data consists of a map of year 2005 with the state limits of Brazil in 1:1.000.000 scale produced by the Brazilian Geography and Statistics Institute (IBGE)11. This map contains 349 polygonal lines, each one with 173 vertices on average. An overview is shown in Figure 6a.
The preprocessing stage produced an Extended MX CIF Quadtree of height 6 and containing 172 leaf nodes, while polygonal lines were split into 25 LOD steps.
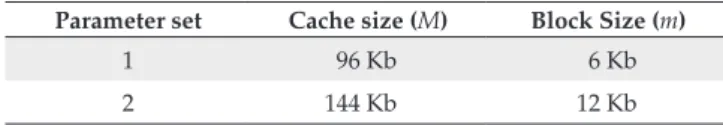
The tests used two distinct parameter sets for cache memory size (M) and block size (m), as shown in Table 2. The first parameter set uses relatively small values for both M and m in order to observe more closely the behavior of the progressive transmission for this small data set. The larger values in the second parameter set simulate an environment with more memory and network resources thus permitting the adaptability of the system to be observed.
Each test simulates a map browsing session by issuing a fixed sequence of zooming and panning operations. These are shown in Table 1, where ZF, Z+, Z- and P stand for zoom full, zoom in, zoom out and pan, respectively.
The first experiment aimed at measuring the use of client cache memory per frame during the browsing session for each parameter set. In this context, we call “frame” the trans-mission, processing and display of one data block. The chart in Figure 3 shows, as expected, that use of client memory increases steadily with a slope proportional to m and tops off at the maximum allowed value M.
The second experiment gauged bandwidth usage by measuring the sizes of transmitted blocks. These numbers are shown in the chart of Figure 4. As expected, network usage is kept under the imposed limit for both parameter sets. It is important to observe that successive frames with high band-width usage – but without intervening browsing operations – correspond to progressive transmission and rendering of map data.
Due to the bigger block size used in the second test, bandwidth usage peaks are higher, but have shorter duration than those observed for the first test. In general, we also note that zooming in and zooming to the full map generate more network traffic than panning or zooming out.
Next, it was defined some way for measuring the picture quality observed in the client as a function of time (frame). For this purpose, we considered that a given polygonal line L present in window W is rendered perfectly if it is represented in cache memory with LOD BestLOD(L,W) or greater. Thus, a percentage measure of display quality Q may be estimated by
100 ( ( ), ( , ))
=
| |×L R∑∈ ( , )
min LOD L BestLOD L W Q
R BestLOD L W (1)
where R is the set of lines intersecting W. A plot of this quality measure at the end of each frame is shown in Figure 5. It can be observed that the system achieves maximum quality after a few frames and never falls significantly below 80% when parameter set 2 was used. This threshold is clearly dependent on the relationship between the total map size and the cache memory size M. As expected, display quality drops more abruptly for parameter set 1 than for set 2 whenever browsing operations require data to be retrieved from the server. Similarly, the latency observed for reaching maximum quality is smaller for the bigger block size m of the second set.
Table 2. Client memory sizes (M) and block sizes (m) used in the first set of experiments.
Parameter set Cache size (M) Block Size (m)
1 96 Kb 6 Kb
2 144 Kb 12 Kb
Table 1. Sequence of map browsing operations used in the first set of experiments.
Frame 1 9 13 15 17 22 24 26 28 35 37 39 41 43 45
144
120
96
72
48
24
0
0 5 10 15 20 25 30 35 40 45 50
Frame
Memory usage (Kb)
P. set 02 P. set 01
Figure 3. Client cache memory usage per frame.
12
9
6
3
0
0 5 10 15 20 25 30 35 40 45 50
Frame
BKytes transmitted
P. set 02 P. set 01
ZF Z+ Z+ P Z+ Z+ P P P Z– Z– Z– Z– P ZF
Figure 4. KBytes transmitted per frame.
100
80
60
40
20
0
0 5 10 15 20 25 30 35 40 45 50
Frame
Display quality (%)
P. set 02 P. set 01
ZF Z+ Z+ P Z+ Z+ P P P Z– Z– Z– Z– P ZF
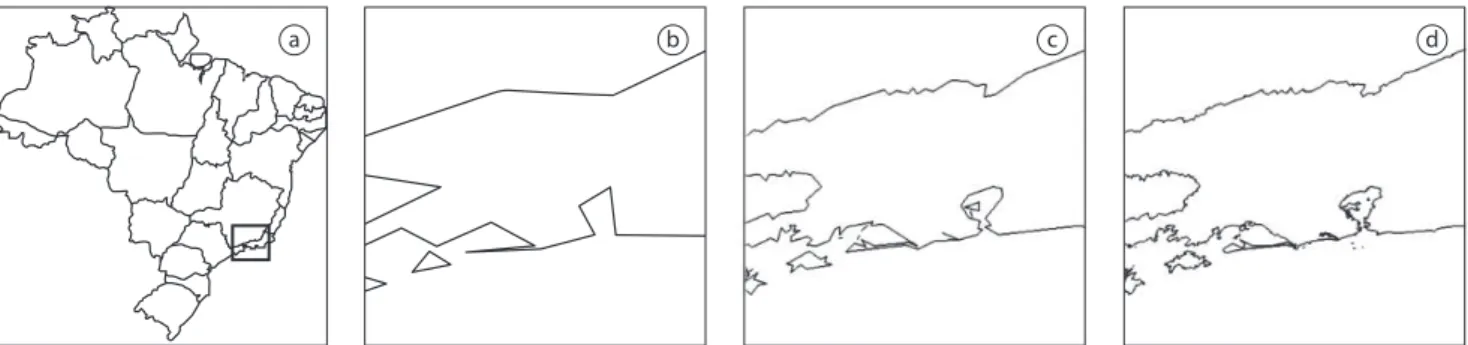
It should be remarked that the visual aspect of progres-sive transmission of vector data is in general less distracting than the behavior of raster based systems which may leave blank large portions of the screen while data is fetched from the server. An example of quality increase over time is shown in Figure 6. The user performs a zoom operation in a window displaying a map with all states of Brazil, causing the system to perform a progressive transmission and rendering until it reaches 100% of display quality.
The following experiment measured client cache hit ratios for each browsing operation. Results for both sets of parameters are shown in Figure 7. A cache hit corresponds to IncreaseLOD or LoadLOD operations which do not have to be executed due to the fact that cache memory already contains the needed data. The cache hit ratio, then, is defined as the ratio between cache hits and the sum of all increase operations that would have been needed were the cache empty. Suppose, for instance, that after a given change in the viewing window, and considering that the client memory is empty, 40 opera-tions are put in heap I, whereas with the actual contents of the cache, only 10 operations are needed. This means that the cache hit ratio is 75%. In our experiment, the cache hit ratio is computed just after heap I is built using Equation 2:
100 | | =
| | ( ( ), ( , ))
L R
I CH
I min LOD L BestLOD L W ∈
×
+ ∑ (2)
where |I| is the number of operations in heap I.
Observing Figure 7, we notice that the tests for both parameter sets behave in identical fashion up to the point when the client with smaller memory – parameter set 1 – is completely full. After this point, although the client for set 2 reaches higher cache hit ratios overall, the client for set 1 occasionally has a better resident set with respect to the new viewing window. Also notice that for last point of the chart, corresponding to a Zoom Full operation, the client with a larger memory has necessarily a better cache hit ratio than the client with smaller memory.
It is also useful to observe the frequency of cache memory management operations as a function of the frame number. The chart in Figure 8 plots two lines, one depicting the cache inclusion operations, i.e., those that generate network traffic, and another depicting the cache exclusion operations for a
client with parameter set 1. Note that no exclude operations are required before frame 19, as there is still enough room for storing polygonal data. Another important observation is that the number of operations does not necessarily follow the pattern of bandwidth usage. This can be attributed to the fact that the amount of data for each LOD step is not constant.
6.2. Second set of experiments
These were conducted using a map of year 2005 standing for the municipal limits of Brazil in 1:1.000.000 scale produced by the Brazilian Geography and Statistics Institute (IBGE)11. This map contains 16,660 polygonal lines, each with 65 vertices on average. An overview is shown in Figure 9.
In the second set of experiments, two data sets repre-senting the same collection of polygonal lines are used. The first data set, labeled original, contains the lines in full reso-lution with 25 LOD steps, whereas in the second data set, labeled simplified, these lines were coarsened to LOD 12 using the Douglas-Peucker algorithm19. The data set original has 1,076,029 vertices and simplified has 92,353.
The preprocessing stage produced an Extended MX-CIF Quadtree of height 6 and containing 536 leaf nodes, while polygonal lines were split into up to 25 LOD steps. Since this set of experiments aimed for understanding how the system scales with respect to the size of the data being served, a second data set was obtained by simplifying the original map with only up to 12 LOD steps.
The same sequence of browsing operations, shown in Table 3, was used in experiments with both data sets. The values for the client cache size and for the block size were also kept constant, namely, M = 1152 Kb and m = 48 KB.
After a first display of the whole map, i.e., just after the first Zoom Full operation, two series corresponding to 1 Zoom More and 5 Panning operations each were issued. After the first Zoom More operation, polygonal lines need 8 IncreaseLOD operations on average to reach maximum
a b c d
Figure 6. A zoom-in operation performed on the black rectangle (a) causes progressive transmission and rendering (b), (c) until the system achieves maximum display quality (d).
Table 3. Sequence of map browsing operations used in the second set of experiments.
Frame 1 25 27 29 32 34 36 38 40 42 44 46 48
100
80
60
40
20
0
Browser operation
Cache hit (% of op.)
P. set 02 P. set 01 Zoom
full
Zoom more
Zoom more
Zoom more
Zoom less
Zoom less
Zoom less
Zoom less
Zoom full Zoom
more
Panning PanningPanningPanning Panning
Figure 7. Cache hit ratios measured for each zooming and panning operation.
350
300
250
200
150
50 100
0
0 5 10 15 20 25 30 35 40 45 50
Frame
Number of operation
Include Exclude
ZF Z+ Z+ P Z+ Z+ P P P Z– Z– Z– Z– P ZF
Parameter set 01
Figure 8. Cache memory management operations per frame for a client with parameter set 1.
Figure 9. Map with the municipal limits of Brazil.
display quality. The next Zoom More requires 8 additional IncreaseLOD operations. Since the simplified data set contains only 12 LOD steps, the second series of operations leads to less data being retrieved from the server than with the original data. This can be observed in the chart shown in Figure 10, where the experiments with both data sets behave identically up to the point where the second Zoom More operation is issued at frame 38. After this, the interaction with the original data set always uses more bandwidth than with the simpli-fied data set. It should be stressed that this means only that the use of bandwidth depends on the availability of detail levels for a given view window, not on the size of the data set per se.
memory for storing the data up to LOD 16, whereas with the simplified data set the memory requirements of LODs up to 12 are more modest.
7. Extensions
The results discussed in the previous section were obtained with relatively low values for M, considering that modern desktop workstations are ordinarily equipped with memory on the order of a few gigabytes. For instance, allowing M = 4 Mb and considering that each polygon vertex occupies 16 bytes (8 bytes per coordinate), cache memory would be able to accommodate more than 250,000 vertices.
On the other hand, allowing large block sizes (m) may impose a lower update rate on the client, depending on the available bandwidth. In our implementation this effect can be amplified due to the relatively simple-minded XML-RPC coding, which requires numbers to be first converted to string
and then wrapped inside XML tags. For instance, a 5-digit integer value which is represented internally with 64 bits will require 14 bytes, or a 75% increase when coded as string and wrapped inside XML tags, e.g., <i4>12345</i4>. The repre-sentation of floats is even more wasteful.
Thus, the use of thechniques to reduce this overhead is advisable. A simple alternative would be base-64 coding – a conversion type already supported by the XML-RPC standard. Another possibility is to employ compression, if supported by both server and client. The JavaScript Object Notation – JSON14 has also been proposed to address this same problem.
Examining the results for the second set of experiments, one may notice that the initial transmission of data required for showing the complete map to the user takes 23 frames. This high volume of transmitted data is due to the large number of polygonal lines which, even when represented at the lowest possible level of detail, comprise 34,686 vertices. Observing 36
48
24
12
0
0 5 10 15 20 25 30 35 40 45 50
Frame
KBytes transmitted
Simplified Original
ZF Z+ P P P P P Z+ P P P P P
Figure 10. KBytes transmitted per frame.
100
80
60
40
20
0
Browser operation
Cache hit (% of op.)
Simplified Original Zoom
full
Zoom more
Zoom more
Panning Panning Panning Panning Panning Panning Panning Panning Panning Panning
Figure 9, however, it is clear that many of these lines are not relevant for an initial overview of the map, see Bertolotto and Egenhofer3. This suggests that visual importance classifi-cation of the polygonal lines should be incorporated into the system. This would allow, for instance, that the first overview of the map contain only polygonal lines pertaining to state limits, leaving municipal divisions to zoomed-in views.
In the context of Geographic Information Systems (GIS), the use of two or more data sets which represent the same objective reality at different scales is common. However, the second set of experiments, as reported in Section 6.2, suggests that the same functionality may be reached by mixing visual importance rules together with LOD processing. Thus, it would be possible to obtain an adequately detailed world view for any desired viewing window of the same reality.
Another important aspect of any web mapping frame-work is the support of other geometric features such as points and polygons. These are not yet handled by the architecture described here. In fact, being dimensionless, points do not lend themselves to strict level-of-detail processing, although they could be easily submitted to visual importance
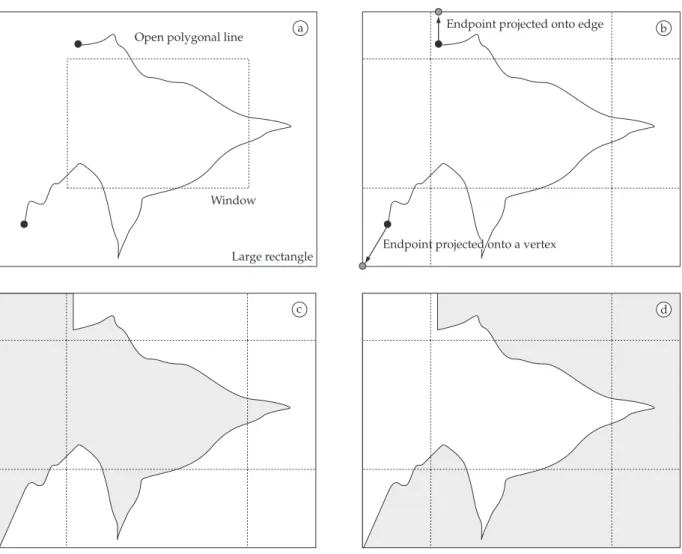
classifi-cation. Closed polygonal lines representing area features can be easily processed with the Douglas-Peucker algorithm, but obtaining these polygons from a set of open polygonal lines representing a space partition requires additional informa-tion as prescribed by the Polygon-arc Topology (see Section 6). Extending our framework in order to support closed polygonal line would require little effort, except for one crucial problem related to the fact that, given a visualiza-tion window W, the set of polygonal lines that cross it do not necessarily limit completely all polygons intersecting that same window. In other words, a polygon which inter-sects W may be bounded by polygonal lines which are not in the client’s cache memory. The problem can be circum-vented by projecting the endpoints of those polygonal lines that do intersect the window onto the edges and vertices of a sufficiently large rectangle enclosing the viewing window. By following the polygon circulation along this rectangle it is possible to obtain a closed polygonal lines which will later be clipped against the window. The procedure is illustrated in Figure 12.
Open polygonal line
Window
Large rectangle
Endpoint projected onto edge
Endpoint projected onto a vertex
a b
c d
8. Conclusions and Suggestions for Future
Work
The client-server framework for remotely displaying vector maps described in this work was designed to achieve several goals: be simple, scalable, make predictable use of network bandwidth and support progressive transmission and rendering. The prototype implementation and admit-tedly limited experimental evidence seem to indicate that these objectives were largely met.
An enhanced version of the prototype could adopt alter-native solutions for some of the design decisions discussed here. We are particularly dissatisfied with the way LOD steps were defined, which results in a very heterogenous partition of detail space. Also, as pointed out in Davis6 and McMaster and Shea24, the Douglas-Peucker do not provide an optimal approximation of the original line for large tolerances. The communication protocol between client and server could be overhauled by using some less wasteful coding than XML-RPC. A more finely tuned spatial index could also lead to a better overall performance.
Addressing browser compatibility is a major considera-tion when it comes to browser-embedded applicaconsidera-tions such as the one described in this paper. Unfortunately, browser specifications will continue to represent a moving target, at least as long as browser vendors choose to ignore standardi-zation efforts.
Although our prototype was not tested within a more realistic context where the server is requested by multiple client connections, it is nevertheless clear that memory usage would increase linearly with a relatively small slope since the server needs to store for connected each client a single integer for each polygonal line (see list A in the example of Section 4). Additionally, for every client actively navigating the map, the server must also compute heaps I and D, but these tend to be small for small changes of the viewing window as suggested by Figure 8. On the other hand, the processing of Algorithm 1 on both client and server, although helping to keep the band-width usage at a minimum, may impose a heavy processing load on the server.
A continuation of this work would necessarily incor-porate the extensions discussed in Section 7 as well as a more thorough testing of its various aspects. The proto-type would probably also benefit from a closer adherence to OGC standards for client-server communication18. A more general preprocessing of vector data sets is also being planned, including the treatment of topological relation-ships among geometries as discussed in Bertolotto and Egenhofer3.
Clearly, a production system would require the addition of several improvements such as visual importance classifi-cation. A complete system would probably also include the ability to serve raster data in situations where this format is more appealing.
References
1. Fry B and Reas C. Download Processing 1.0. Available from: <http://processing.org/download/index.html>. Access in: 03/2009.
2. Gordillo S and Balaguer F. Refining an object-oriented GIS design model: topologies and field data. GIS ‘98: Proceedings of the 6th ACM international symposium on Advances in geographic information systems; 1998; New York, NY, USA. p. 76-81.
3. Bertolotto M and Egenhofer MJ. Progressive Transmission of Vector Map Data over the World Wide Web. Geoinformatica
2001; 5(4):345-373.
4. Kraak M and Brown A. Web Cartography -Developments and prospects. New York: Taylor & Francis; 2001.
5. CARTO: net - cartographers on the net. SVG, scalable vector graphics: tutorials, examples, widgets and libraries. Available from: <http://www.carto.net>. Access in: 03/2009.
6. Davis C. Geometria computacional para sistemas de informação geográfica. Available from: <http://www.dpi.inpe.br/ gilberto/livro/geocomp/>. Access in: 03/2009. [In Portuguese]
7. Free Software Foundation Inc. GCC, the GNU compiler collection. Available from: <http://gcc.gnu.org/>. Access in: 03/2009.
8. Google Inc. ExplorerCanvas. Available from: <http:// excanvas.sourceforge.net>. Access in: 03/2009.
9. Google Inc. Google Maps. Available from: <http://maps. google.com>. Access in: 03/2009.
10. Gaede V and Günther O. Multidimensional access methods.
ACM Computing Surveys 1998; 30(2):170-231.
11. Instituto Brasileiro de Geografia e Estatística – IBGE. Available from: <http://www.ibge.gov.br>. Access in: 03/2009. [In Portuguese]
12. Ramos JAS, Esperança C and Clua EWG. A Progressive Vector Map Browser. Proceedings of X Brazilian Symposium of Geoinformatics; 2008. Sociedade Brasileira de Computação. p. 127-138.
13. Resig J. John Resig - Processing.js. Available from: <http:// ejohn.org/blog/processingjs/>. Access in: 03/2009.
14. JSON.org. Available from: <http://www.json.org/>. Access in: 03/2009.
15. MapTools. Shapefile C Library V1.2. Available from: <http:// shapelib.maptools.org/>. Access in: 03/2009.
16. Burrough PA and McDonnell RA. Principles of geographical information systems. New York: Oxford University Press; 1997.
17. McMaster RB. Automated Line Generalization. Cartographica
1987; 24(2):74-111.
18. Open Geospatial Consortium Inc. Welcome to the OGC Website. Available from: <http://www.opengeospatial.org/>. Access in: 03/2009.
20. Python Software Foundation. Download Python Software.
Available from: <http://www.python.org/download/>. Access in: 03/2009.
21. Casanova M, Câmara G, Davis C, Vinhas L and Queiroz G.
Bancos de dados geográficos. Curitiba: Editora MundoGEO; 2005. [In Portuguese]
22. Ramos JAS. Navegador de Mapas Vetoriais com Atualização Progressiva. Rio de Janeiro: Universidade Federal Fluminense; 2008. Technical report.
23. Samet H. Foundations of Multidimensional and Metric Data Structures. San Francisco: Morgan-Kaufman; 2006.
24. McMaster RB and Shea KS. Generalization in digital cartography. Washington, D.C.: Association of American Geographers; 1992.
25. Chim JHP, Green M, Lau RWH, Va Leong H and Si A. On caching and prefetching of virtual objects in distributed virtual environments. MULTIMEDIA ‘98: Proceedings of the sixth ACM international conference on Multimedia; 1998; New York, NY, USA, 1998. p. 171-180
26. Abel DJ and Smith JL. A data structure and query algorithm for a database of areal entities. Australian Computer Journal
1984; 16(4):147-154.
27. Hershberger J and Snoeyink J. Speeding Up the Douglas-Peucker Line-Simplification Algorithm. Proc. 5th Intl. Symp. on Spatial Data Handling; 1992. p. 134-143.
28. TrollTech. Qt Cross-Platform Application Framework. Available from: <http://trolltech.com/products/qt/>. Access in: 03/2009.
29. University of Minnesota. UMN MapServer. Available from: <http://mapserver.gis.umn.edu>. Access in: 03/2009.
30. UserLand Software Inc. XML-RPC Homepage. Available from: <http://www.xmlrpc.com>. Access in: 03/2009.
31. Stroe ID, Rundensteiner EA and Ward MO. Scalable Visual Hierarchy Exploration. DEXA ‘00: Proceedings of the 11th International Conference on Database and Expert Systems Applications; 2000. London, UK: Springer-Verlag; 2000. p. 784-793.
32. Doshi PR, Rundensteiner EA and Ward MO. Prefetching for Visual Data Exploration. DASFAA ‘03: Proceedings of the Eighth International Conference on Database Systems for Advanced Applications; 2003; Washington, DC, USA. IEEE Computer Society. p. 195
33. Burghardt D, Neun M and Weibel R. Generalization Services on the Web - A Classification and an Initial Prototype Implementation. Proceedings of the American Congress on Surveying and Mapping - Auto-Carto; 2005. p. 257-268.
34. World Wide Web Consortium. HTML 5. Available from: <http://dev.w3.org/html5/spec/Overview.html>. Access in: 03/2009.
35. World Wide Web Consortium. W3C - The World Wide Web Consortium. Available from: <http://www.w3.org/>. Access in: 03/2009.