BAR, Rio de Janeiro, v. 10, n. 1, art. 3, pp. 40-56, Jan./Mar. 2013
Brazilian Credit Union Member Groups: Borrower-dominated,
Saver-dominated or Neutral Behavior?
Valéria Gama Fully Bressan * E-mail address: [email protected] Universidade Federal de Minas Gerais – FACE/UFMG Belo Horizonte, MG, Brazil.
Marcelo José Braga E-mail address: [email protected] Universidade Federal de Viçosa - DER/UFV Viçosa, MG, Brazil.
Moisés de Andrade Resende Filho E-mail address: [email protected] Universidade de Brasília – FACE/UnB Brasília, DF, Brazil.
Aureliano Angel Bressan E-mail address: [email protected] Universidade Federal de Minas Gerais – FACE/UFMG Belo Horizonte, MG, Brazil.
* Corresponding author: Valéria Gama Fully Bressan
Universidade Federal de Minas Gerais, Faculdade de Ciências Econômicas, Departamento de Ciências Contábeis, Av. Antônio Carlos, 6627, sala 2041, Belo Horizonte, MG, 31270-901, Brazil.
Received 3 August 2011; received in revised form 21 June 2012; accepted 13 August 2012;
Abstract
Theoretical models concerning Credit Unions (CUs) suggest that the type of CU domination determines the way it allocates the monetary value it generates. A borrower- (saver-) dominated CU benefits borrower (saver) members at the expenses of saver (borrower) members, and a neutral CU equally benefits its member groups. This paper applies direct measure of monetary benefits to each member group (Patin & McNiel, 1991a) to test for the existence of dominated behavior in Brazilian CUs, and is the first to apply panel data regressions to identify the determinants of CUs behavior. We use a unique panel data with 40,664 observations taken from 533 CUs affiliated with the largest Brazilian cooperative network. Results indicate Brazilian CUs are dominated by borrowers, but behave close to neutrality. Panel regression estimates show that common or multiple bond type, size and overdue loans of a CU have no effect on its behavior, the greater the total amount of loans over social capital and adjusted equity over total assets are the more likely a CU is borrower dominated, and the greater the age and current operational expenses over total asset of a CU are the more likely a CU is saver dominated.
Introduction
The owners (members) of a financial cooperative, or simply credit union (hereafter CU), are borrowers who consume loans and savers who supply savings deposits. The gap between the dividend rate paid to savers and the interest/loan rate paid by borrowers gives the main source of income to a CU (Spencer, 1996).
A CU acts as a financial intermediary between its net saver members, who want high dividend rates on savings (i.e., shares in CUs), and its net borrower members, who prefer low interest rates on loans. These two opposite objectives of member groups create the inherent borrower-saver conflict in CUs (Smith, 1986). Thus, a borrower- (saver-) oriented/dominated CU is expected to benefit net borrower (saver) members at the expenses of net saver (borrower) members, and a neutral CU is expected to equally benefit its member groups. This paper aims to investigate and explain the member group orientation/domination of CUs in Brazil.
We have divided the literature on CUs member group orientation/domination into theoretical and empirical groups of studies. As follows, we first review the most important theoretical studies, and then the most important empirical studies on CUs member group orientation/domination.
Taylor (1971) was one of the first authors to explicitly recognize the existence of conflict among member groups within a CU. On the basis of a simple graphical analytical model of CU, he shows the conflict among member groups is not likely to restrict membership, and therefore credit availability, on purely economic grounds. The first reason for this is that members do not belong exclusively to one group (i.e., borrowers or savers) or other. The second reason is that the relationships between current savers and new borrowers, and current borrowers and new savers, are complementary.
Disagreeing with Taylor (1971), Flannery (1974) used a simple graphical analytical model to show that non price rationing (i.e., restrictions on membership) is crucial for saver and borrower dominated CUs to operate. Exactly because of this, Flannery (1974) argued that dominated CUs would produce more distortion in terms of credit availability than simple profit maximizing monopolistic competitors. A neutral credit union, which is considered by Flannery to act exactly like a simple sales maximizing firm, would supply more credit to consumers than capital markets operating under monopolistic competition.
Following this line of inquiry, Smith, Cargill and Meyer (1981) develop a theoretical model in which a CU chooses the loan rate and dividend rate so as to maximize the weighted sum of the net gains on savings and loans, with the weights labeled behavioral preference parameters. They show that the loan rate for a borrower- (saver-) oriented CU would be less (more) than for a neutral CU, and the dividend rate on savings would be less (more) than for a neutral CU; and that a borrower- (saver-) oriented CU would issue more (less) debt or invest extra funds less (more) than if equal treatment or neutral behavior was the case. Despite their results, they argue that a CU would likely seek to maximize its total net gain or, in other words, behave neutrally for three reasons. First, neutral behavior is coherent to the fairness and equity considerations that lie behind the cooperative philosophy. Second, borrowers or savers might hesitate to participate in a CU that intentionally penalizes their interests. Third, individual members might always switch in their roles as net borrowers or net savers.
dividend (loan) rate would tend to remain unchanged. Interestingly, Smith (1988) extended Smith’s (1984) stylized model of CU to incorporate uncertainty, but only considered risk neutral CUs to develop his entire model, thus ignoring the CU orientation/domination issue.
Other works such as Black and Dugger (1981) and Walker and Chandler (1977) have not developed formal analytical models of CUs, but still recognize that a CU orientation is likely to affect the manner it operates or behaves. Thus, it should be noticed that, except for Spencer (1996), all theoretical studies after Taylor (1971) have recognized the conflict among member groups translated into the CU domination/orientation is likely to affect the way CUs are operated and behave.
In terms of empirical evidences on the significance of dominated behavior among CUs, Flannery (1974) seems to have been the first study attempting to classify CUs as saver-dominated, borrower-dominated or neutral. However, it failed to distinguish between variations caused by dominated behavior and random errors so that its results should be taken with caution (Smith, 1986).
Smith (1986) tested the variant objective functions of CUs (i.e., saver- or borrower- oriented or neutral) by relying on comparative static results obtained by Smith (1984). In so doing, he employed a two-step approach where in the first step the CUs are classified into the borrower (saver) oriented group if their predicted values for loan (dividend) rates, obtained from two linear regression equations, are greater than (less than) the observed values for loan (dividend rates)(1). In the second step, Smith (1986) tested the variant objective function of CUs by carrying out regressions to test if the classified CUs would respond to changes in the explanatory variables as predicted by the comparative static results obtained by Smith (1984). Because his results did not show any evidence to support the variant objective function hypothesis, he concluded that the 951 federally insured American credit unions in his sample had behaved neutrally from 1975 to 1979.
Based on the theoretical works of Walker and Chandler (1977), Smith et al. (1981) and Smith (1984), Patin and McNiel (1991a) developed a direct measure of the net monetary benefits to saver and borrower members, and applied it to calculate the differences between the net monetary benefits allocated to savers (NMBS) and borrowers (NMBB) in the years 1984 and 1985 for each of 10,565 (10,142) federally chartered and 4,657 (4,932) state chartered/federally insured CUs in the United Sates. They tested if the CU industry in USA balanced the interest of borrowers and savers by observing if the mean of the differences between NMBS and NMBB for all CUs in their sample would differ from zero when using the t test. They found that the CU industry as a whole allocated more benefits to member-savers than to member-borrowers but argued that this result does not imply each CU in the sample exhibited this type of behavior. Thus, they proposed a way to adjust for the possibility of size bias in order to create an index of domination for each CU. Using this index distribution, they found that 80% of CUs they had previously classified showed evidence of neutral behavior. Patin and McNiel (1991b) employed this same approach to analyze CUs in USA and found, like Patin and McNiel (1991a), that most CUs exhibited neutral behavior.
The National Credit Union Administration (NCUA) of USA changed its membership policy in 1982 so that members from groups without any affinity with the core group of a CU could participate. In other words, NCUA started to allow multiple group credit unions to operate. Since the National Association of Federal Credit Unions (NAFCU) claims that non-core members are more likely to be borrowers in a CU than the core members, Leggett and Stewart (1999)used a more restrictive version of the approach proposed by Patin and McNiel (1991a) to identify the orientation of 2,025 federally chartered CUs in 1997 from the twenty-five largest Metropolitan Statistical Areas in USA. They found that on average CUs were saver-oriented regardless of the type of their membership but common bond CUs had a stronger saver orientation than multiple bond CUs.
younger CUs would set lower loan rates than the market as a means to make their assets and membership grow and, as a side effect, would attract borrowers.
Although most theoretical studies have agreed that a CU orientation is likely to affect the way it behaves, there are few recent empirical studies on this issue for CUs located in developed countries, and almost none for CUs in developing countries. In fact, except for the work by Desrocher and Fischer (1999 as cited in Fischer, 2000), which detected both saver and borrower oriented CUs in Colombia, we could not find any other work on CU orientation/domination for developing countries.
Of special interest to this paper, we could not find any previous work on the orientation of CUs in Brazil, which is of concern because it has been broadly recognized that CUs can improve financial access for the poor and, therefore, contribute to development and poverty reduction (Nair & Kloeppinger-Todd, 2007). Furthermore, new regulatory rules introduced by the Central Bank of Brazil in its resolution 3.106 of 25th July 2003 allow for the creation of multiple bond or open-admission CUs, which increases the importance of investigating the behavior of CUs in Brazil; where it is reasonable to suspect that “non-core members are more likely to be borrowers than core members” (Leggett & Stewart, 1999, pp. 235-236)(2).
The objectives of the present paper are twofold: to investigate and explain the member group orientation/domination of CUs in Brazil; and to investigate if Brazilian CUs have been more attractive to their members than other financial institutions, thus complying with CUs’ primary objectives: to promote thrift and provide credit at reasonable rates. This way, our work adds to the literature as the first to empirically study the orientation of Brazilian CUs, using a unique panel data obtained from the Brazilian Credit Cooperative System (hereafter Sicoob-Brasil). Note that the Cooperative Unions system in Brazil is composed of four CU networks: Sicredi, Unicredi, Ancosol, and Sicoob-Brasil, which is by far the largest one in Brazil(3).
This paper(4) is organized so that in the following section presents the basis to measure benefits and how they are divided across the members of a CU. Next follows the literature review on models of domination in credit unions and their estimation, and the specification of the baseline panel data regression model. Then the empirical results on Brazilian CU member domination and the factors determining it are presented. Finally, the paper closes with a summary, main conclusions and directions for future research.
Measuring Benefits for CU Members and How CUs Allocate Benefits among Member
Groups
Most theoretical articles suggest that a CU orientation/domination determines the way it allocates the monetary value it generates among its saver and borrower members. Walker and Chandler (1977) pointed out that the benefits a CU allocates to its members can be divided into monetary and non-monetary benefits. For instance, non-monetary benefits are the provision of financial advice, and theconvenience of directlydeducting savings applications and loan payments out of a member’s payroll. However, Walker and Chandler (1977), Smith et al. (1981), Smith (1984), Patin and McNiel (1991a), and Leggett and Stewart (1999) agree that non-monetary benefits are uniformly distributed across members of CUs and, therefore, will have no effect on the potential asymmetry by which benefits are distributed among their members group. Based on this, we ignore non-monetary benefits and focus only on how monetary benefits are distributed across CUs members.
Monetary benefits allocated to savers
NMBSit = (WADRit–WAMDRit)*TSit (1)
where at time t, NMBSit is the net monetary benefits received by the ith CU saver-member, WADRit
(5)
is the weighted average of the dividend rates paid by the ith CU on all savings instruments it offers,
WAMDRit(6) is the weighted average of the best alternative market dividend (savings) rates available on
similar types of savings instruments outside the ith CU, and TSit is the total monetary volume of
member savings balances in reais (R$) for the ith CU.
Patin and McNiel (1991a) argue that Equation (1) measures the monetary benefits accruing to the ith CU saver members at time t net of the opportunity costs associated with their decisions, and is based on the theoretical works of Walker and Chandler (1977), Smith et al. (1981), and Smith (1984).
Monetary benefits allocated to borrowers
Patin and McNiel (1991a) suggest that the net monetary benefits received by the ith CU borrower members at time t should be calculated by Equation (2).
NMBBit = (WAMLRit – WALRit*(1 – RRTit))*TLit (2)
where at time t, NMBBit is the net monetary benefits received by the CU borrower members,
WAMLRit(7) is the weighted average of market loan rates charged by other institutions on similar types
of debts instruments to those offered by the ith CU, WALRit(8)is the weighted average of loan rates
charged by the ith CU for all types of loans to members, RRTit is the proportion of interest income on
loans refunded to CU borrower members, and TLit is the total monetary volume of loans to the
members of the ith CU. About RRTit, we use as proxy the total income refunded to a CU’s members in
R$ over the total R$ income obtained by a CU from all charges on loans calculated as presented in the Appendix.
Note that Equation (2) measures the monetary benefits accruing to the ith CU borrower members net of the opportunity costs associated with borrowers’ decisions, and is based on the theoretical works of Walker and Chandler (1977), Smith et al. (1981), and Smith (1984).
In order to empirically compare the treatment of borrowers and savers, we follow Patin and McNiel (1991a), and calculate by Equation (3) the difference (difit) between the net benefits allocated
by the ith CU at time t to each member group.
difit = NMBSit – NMBBit (3)
The ith CU allocates more monetary benefits to savers (borrowers) at time t if difit is greater
(lower) than zero, otherwise the ith CU equally allocates benefits to both member groups. Furthermore, n1
idifit
can be used to investigate how a CU industry allocates aggregate benefits across member groups at time t such that if n1 0i difit
( 1 0)n idifit
then the CU industry allocates a greater level of aggregate net monetary benefits to member-savers (member-borrowers); otherwise, the CU industry equally allocates net monetary benefits among member groups (Patin & McNiel, 1991a).Patin and McNiel (1991a) suggested adjusting for size bias by calculating the degree to which the ith CU allocates benefits among member groups at time t as the index of domination (IDit)
calculated by Equation (4).
it it
t
ds
ID
std
(4)it it it it it
NMBS
NMBB
ds
TS
TL
(5)2 1 1 n i it t ds std n
(6)for the ith CU, dsit gives the difference between NMBSit per real of savings and NMBBit per real
loaned, and stdt is the standard deviation of dsit about zero at time t. Thus, the absolute value of IDit
gives the extent by which the ith CU deviates from perfect neutral behavior (IDit=0) at time t, and its
signal shows if the ith CU is saver dominated (IDit>0) or borrower dominated (IDit<0).
Data
The data used in this paper is an unbalanced panel with 40,664 observations of monthly accounting information for 533 Brazilian CUs affiliated with Sicoob-Brasil from January 2000 to June 2008, which represents 58.51% of the CUs affiliated with Sicoob-Brasil during this time period. Note that Sicoob-Brasil comprises 46.32% of all Brazilian single CUs, which makes Sicoob-Brasil by far the largest cooperative network in Brazil (Soares & Melo, 2007). The sources of our data are the Central Bank of Brazil, Sicoob-Brasil and Sicoob’s Deposit insurance Administration.
Models of Domination in Credit Unions and their Estimation
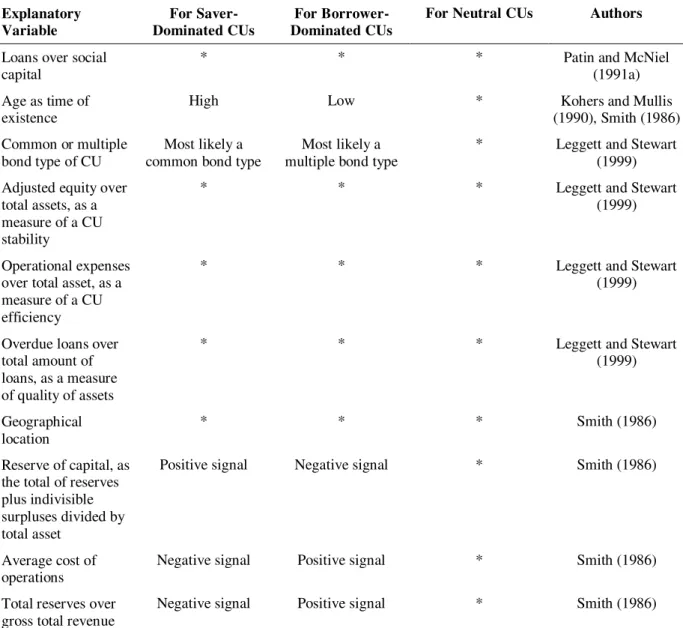
We rely on the literature as summarized in Table 1 as the basis to specify the variables and the functional forms of our models.
Table 1
Common Variables Used to Explain the Domination in CUs
Explanatory Variable For Saver-Dominated CUs For Borrower-Dominated CUs
For Neutral CUs Authors
Fees on loans and dividend rates
High fees on loans and high dividend rates on savings
Low fees on loans and low dividend rates on savings
Intermediate fees on loans and interest
rates on savings
Taylor (1971), Flannery (1974), Smith et al. (1981), Smith (1984, 1986),
Patin and McNiel (1991a), Leggett and
Stewart (1999)
Size as a CU’s total
asset
Intermediate Low High Patin and McNiel
(1991a), Smith (1986)8
Average monetary volume of loans and savings per member
Intermediate Low High Patin and McNiel
(1991a)
Net income distribution
Most of the net income is distributed
as dividends
Most of the net income is distributed
as low loan rates
Equally distributed Patin and McNiel (1991a)
Table 1 (continued) Explanatory Variable For Saver-Dominated CUs For Borrower-Dominated CUs
For Neutral CUs Authors
Loans over social capital
* * * Patin and McNiel
(1991a)
Age as time of existence
High Low * Kohers and Mullis
(1990), Smith (1986)
Common or multiple bond type of CU
Most likely a common bond type
Most likely a multiple bond type
* Leggett and Stewart (1999)
Adjusted equity over total assets, as a measure of a CU stability
* * * Leggett and Stewart
(1999)
Operational expenses over total asset, as a measure of a CU efficiency
* * * Leggett and Stewart
(1999)
Overdue loans over total amount of loans, as a measure of quality of assets
* * * Leggett and Stewart
(1999)
Geographical location
* * * Smith (1986)
Reserve of capital, as the total of reserves plus indivisible surpluses divided by total asset
Positive signal Negative signal * Smith (1986)
Average cost of operations
Negative signal Positive signal * Smith (1986)
Total reserves over gross total revenue
Negative signal Positive signal * Smith (1986)
Note. * denotes that although the authors thought of the variable as important and included it in their analysis, they could not find a clear pattern for the effect of the variable on the behavior of CUs.
From Table 1, we observe the variables fees on loans anddividend rates, average monetary
volume of loans and savings per member, net income distribution, and average cost of operations
are all by their own definitions closely related to IDit. Based on this and the lack of data available on
those variables, we chose not to include those variables in our models
We also did not include in our models the variable reserves over gross total revenue because of its high correlation with accounting records used to compute the variable reserve of capital. Also, we didn’t use the variable reserve of capital in our models because it is highly correlated with the variable adjusted equity over total assets. Finally, we did not include a CU geographical location in our models because it is a CU characteristic that does not change over time and, therefore, is already captured by the fixed effects models.
The remaining variables in Table 1, size as CU’s total asset, loans over social capital, age(9), common or multiple bond type of CU, adjusted equity over total assets, operational expenses
Baseline panel data regression model
The general procedure we use to search for the best model is composed of five steps. First, we estimate the pooled and fixed effects models and test if pooled is preferred to the fixed effects model by the Chow test. Second, we estimate the random effects model and test if pooled is preferred to random effects model by the Breusch-Pagan test. Third, we test if the random effects model is preferred to fixed effects model by the Hausman test. Provided that fixed effects is preferred to pooled and random effects models, we test for first-order autocorrelation by the F-test as proposed by Wooldridge (2002), and for within group homoscedasticity by the Wald test. Finally, provided that absence of first-order autocorrelation and group homoscedasticity are rejected, we re-estimate the fixed effects model by Feasible Generalized Least Squares (FGLS) estimators as proposed by Judge, Griffiths, Hill, and Lütkepohl (1985), and Davidson and MacKinnon (1993). Note that Baltagi and Wu (1999) and Hansen (2007) also use FGLS estimators for fixed effects linear panel data models presenting autocorrelation.
The causal relationship of interest is captured by the benchmark regression model formalized as Equation (7).
0 1 2 3 4 5 6 7
it it it it it it it it i it
ID
size
lsc
age
dt
aeta
oeta
ol
v
(7)where i = 1,..., 533 indexes CUs, t = 1, ..., 102 indexes the observation’s month such that: t = 1 denotes January of 2000 and t = 102 denotes June of 2008; IDit is the index of domination as in Equation (4);
0 is the intercept; the ’s are coefficients; sizeit stands for the size of the ith CU measured as its total
asset in R$ at time t; lscit denotes the total amount of loans over social capital; ageit denotes the time of
existence of the ith CU in years at time t; dtit is a dummy variable with value zero for common bond
type of CUs and value one for multiple bond type of CUs; aetait denotes the adjusted equity over total
assets; oetait denotes the current operational expenses over total asset; olit denotes overdue loans over
total amount of loans;
v
iis the ith CU fixed effects which are non-observables and do not vary overtime; and
itis an i.i.d. stochastic error. For the random effects model, vishould be taken as i.i.d.random variables distributed with zero mean and constant variance.
Empirical Evidence and Discussion
In this section we first discuss the empirical evidence of dominated behavior in Brazilian Credit Unions by analyzing the results obtained for the variables NMBSit(net monetary benefits received by
saver members), NMBBit (net monetary benefits received by borrower members), difit (the difference
between NMBSit and NMBBit), and IDit ( the index of domination for Brazilian credit unions). In the
second part of this section we present the estimates of the panel regression models and, relying on them, discuss the determinants of the index of domination in Brazilian Credit Unions.
The values for NMBSit were calculated according to Equation (1) such that a positive (negative)
value for NMBSit means the ith CU offers more favorable (less favorable) dividend rates to their
members than the best outside alternatives in the financial market. We find 92% of the calculated values of NMBSit were positive, which shows most Brazilian CUs offered more favorable dividend
rates to their members than the outside financial market from January 2000 to June 2008.
We calculate the values for NMBBit according to Equation (2) such that a positive (negative)
value for NMBBit means the ith CU offers more favorable (less favorable) loan rates to their saver
members than the best outside alternatives in the financial market. Note that by Equation (2), NMBBit
positive, which shows most Brazilian CUs offered more favorable loan rates to their members than the outside financial market from January 2000 to June 2008. In other words, the Brazilian CUs were more attractive as source of money for potential borrowers than other financial institutions.
Although observed values of NMBSit and NMBBit indicate Brazilian CUs are more attractive for
borrowing and depositing money than the outside financial market, it is the difference between NMBSit
and NMBBit, difit calculated by Equation (3) which gives the ith CU orientation/domination at time t.
We found 73.6% of the calculated values of difit were negative, which gives evidence that most
Brazilian CUs allocated more monetary benefits to their borrower members than to saver members from January 2000 to June 2008. To shed more light on this result, as a first step we tested the hypothesis by which the variable difit follows a normal distribution by the Jarque and Bera (1980) and
Doornik and Hansen (1994) tests. The rejection of the null hypothesis by these tests indicates there is no statistical basis for testing the difference between the mean of difit for the group with difit>0 (i.e.,
CUs are more favorable to saver members) and the mean of difit for the group with difit<0 (i.e., CUs
are more favorable to borrower members) by a paired Student’s t-test as in Patin and McNiel (1991a).
As an alternative to the paired Student’s t-test, we used the non-parametric Wilcoxon’s (1945) signed-rank test, and in addition tested if the medians of difit for the group with difit>0 and for group
with difit<0 come from the same probability distribution by the Mann-Whitney test. Results for these
two tests indicated the medians of difit for the group with difi > 0 and for the group with difi<0 are
statistically and significantly different, and did not come from the same probability distribution. In other words, the group of CUs more favorable to saver members is statistically different from the group of CUs more favorable to borrower members. Based on this and in the fact that 73.6% of calculated values of difit are negative in the panel, we conclude that most individual Brazilian CUs
generated more benefits for the group of borrower members at the expense of the group of saver members from January 2000 to June 2008.
Patin and McNiel (1991a) criticized the simple use of difit as an indicator of CUs
orientation/domination, and suggested fixing the size bias created with the use of difit by calculating
the index of domination IDit as given by Equation (4). Thus, the sign of IDit indicates if ith CU at time
t was dominated by borrower members (IDit < 0) or by saver members (IDit > 0), and the magnitude of
the absolute value of IDit gives a relative measure of the deviation from the neutral behavior such that
the closer to zero IDit is, the closer to neutrality a CU behaves. The calculated vales of IDit ranged
from -21.7481 to 22.4244 with a mean of 0.0326 and standard deviation of 0.6467. We found 87.3% of IDit values were negative, which confirms the individual Brazilian CUs are borrower dominated, as
they generated more benefits for the group of borrower members at the expense of the group of saver members. We also observed that most IDit values are close to zero. Therefore, we conclude that
individual Brazilian CUs are borrower dominated, but behave close to neutrality.
Determinants of the index of domination in Brazilian Credit Unions
Table 2
Sample Descriptive Statistics of Variables
Variables Mean Standard Deviations Minimum Maximum
Dependent variable
ID -0.0323 0.6470 -21.7480 22.4240
Explanatory variables
size 1.25e+07 4.17e+07 134.9700 1.31e+09
lsc 4.4970 11.5190 0.0000 646.1670
age 10.3011 7.8979 0.4050 41.4600
dt 0.9670 0.1790 0.0000 1.0000
aeta 0.2520 1.9420 -268.235 2.7700
oeta 0.0330 0.0460 0.000 3.7940
ol 0.0930 3.3170 1.68e-06 583.5680
The estimates for the panel data regression models are reported in Table 3.
Table 3
Estimates of the Determinants of the Index of Domination for Brazilian Credit Unions, from January 2000 to June 2008
Explanatory Variable Pooled Fixed Effects Random Effects Fixed Effects by FGLS
size -0.0000* -0.0000* -0.0000* -0.0000
lsc -0.0037* -0.0016* -0.0012* -0.0012*
age 0.0042* 0.0092* 0.0068* 0.0030*
dt 0.0905* 0.0484* 0.0435* 0.0030
aeta -0.8650* -1.5225* -1.4412* -0.2878*
oeta 2.7773* 0.5697* 0.7773* 0.2342*
ol 0.0005 0.0002 0.0002 0.0000
constant 0.0660* 0.2871* 0.3180* 2.0235*
N. of observations 40 664 40 664 40 664 40 664
N. of groups 0 533 533 533
Chow test: F(532, 40 124) = 21.09, p-value = 0.0000
Breusch-Pagan test: 2 (1) = 32,431.63, p-value = 0.0000
Hausman test: 2 (6) = 528.10, p-value = 0.0000
Wooldridge test: F(1,532) = 18.507, p-value = 0.0000
Wald test: 2(112) = 8.7E+07, p-value = 0.0000
Note: An *denotes a coefficient statistically significantly different from zero at the 1% level.
model is preferred to random effects by Hausman test. Finally, because first-order autocorrelation and group homoscedasticity are rejected respectively by the Wooldridge and Wald tests, the preferred model is the fixed effects model estimated by Feasible Generalized Least Squares (FGLS) or simple Fixed Effects by FGLS as in the fourth column of table 2. Thus, the following discussion is all based on the results for Fixed Effects by FGLS
Table 3 shows that for the fixed effects model estimated by FGLS, the coefficient of size is not statistically significantly different from zero, which means the CU’s size has no effect on the domination by members. Note that despite the coefficients of size are statistically significant for the other models, its coefficient estimates are all very close to zero.
The coefficient of lscit (total amount of loans over social capital) is negative and statistically
significantly different from zero, and indicates that for a one-unit increase in lscit the predicted value
of the index of domination IDit should fall by 0.0012. Although the literature gives no conclusive
direction for the effect of lscit on IDit, its negative signal seems reasonable. For instance, lscit can grow
as a result of an increase of the total amount of loans produced by a reduction in the interest/loan rates, which will certainly benefit borrower members. Note that the effect of lscit on IDit is not big in
practical terms. For instance, for a 10 unit increase in lscit which is a huge increase, IDit falls only by
0.012 which is very small compared to the sample range of variation of ID, -21.75 to 22.42 (see Table 2).
Table 3 shows the coefficient of ageit is positive and statistically significant, which implies that
is more likely for younger CUs to be dominated by borrower members and for older CUs to be dominated by saver members, which is in line with Smith (1986), Kohers and Mullis (1990) and Goddard and Wilson (2005). Despite this, this result should be taken with caution. For instance, for a one year increase in ageit the index of domination IDit would increase only by 0.0030, which is very
small compared with the sample range of variation of ID, -21.75 to 22.42 (see Table 2). Thus, the effect over time of increased ageit on IDit will likely be insufficient to move any CU in the sample
from being dominated by borrowers to be dominated by savers and vice-versa. In other words, it is likely the 87.3% of negative values of IDit observed in our sample will remain close to this value in the
following years if ageit is the only variable changing.
The coefficient of the dummy variable dtit is not statistically significant, which implies that if a
CU is of a multiple or common bond, type has no significant effect on its index of domination. Note that dtit is a dummy variable with value zero for common bond type of CUs and value one for multiple
bond type of CUs and we would expect a negative signal for its coefficient.
The coefficient of aetait (adjusted equity over total assets) is negative as expected, and
statistically significant (see Table 3), indicating that for a one-unit increase in aetait the expected value
of the index of domination IDit should fall by 0.2878. Note that aetaitcan be taken as the reciprocal of
the leverage index(10) where the lower the leverage index is for a financial institution the less likely it will be capable of raising funds outside in the market. Thus, an increase in aetait, which is equivalent
to a decrease in the leverage index, implies the CU can more easily raise funds from market, without relying on its saver members and, therefore, making it possible for the CU to reduce benefits for saver members.
The coefficient of oetait (current operational expenses over total asset) is positive as expected
and statistically significant (see Table 3), indicating that for a one-unit increase in oetait the expected
value of the index of domination IDit should increase by 0.2342. Note that an increase in the current
operational expenses relative to the total asset of a CU indicates that the CU is providing more benefits to its members. For instance, the CU is likely to be paying high dividend rates to saver members. Furthermore, oetait measures the costs of managing the CU’s assets and can be seen as the degree of
operational efficiency of a CU. According to the World Council of Credit Unions (WOCCU), to be considered operationally efficient a CU should have an oetait below 10% (Richardson, 2002). From
Table 2, we observed that the mean value of oetait in the sample is 3.3%, indicating the CUs in the
Finally, the variable olit (overdue loans) is not statistically significant to explain the index of
dominance in Brazilian credit unions. In addition, its estimated coefficient shows a value almost equal to zero. Despite this, we keep this variable in the model because of the overall statistic significant of the model by the Wald test.
Summary and Conclusion
In this paper, a Credit Union (CU) is taken as a financial institution, which inherently intermediates conflict between saver members who want high dividend rate on savings and borrower members who prefer low interest rates on loans. Based on previous theoretical works, a borrower- (saver-) oriented/dominated CU benefits borrower (saver) members at the expenses of saver (borrower) members, and a neutral CU equally benefits its member groups.
In order to explain member group orientation/domination for Brazilian CUs, we used a unique panel data composed of 40,664 observations of monthly accounting information from January 2000 to June 2008 for 533 CUs affiliated to the Brazilian Credit Cooperative System (Sicoob-Brasil), which is by far the largest cooperative network in Brazil. We found that individual Brazilian CUs are dominated by borrower members, but behave closely to neutrality, as expected (Smith, Cargill, & Meyer, 1981). We also observed that individual Brazilian CUs are more attractive to their borrower and saver members than are other financial institutions, for instance, banks. In other words, Brazilian CUs seem to have complied with their primary objectives of promoting thrift and providing credit at reasonable rates.
In order to investigate the determinants of member group orientation/domination for Brazilian CUs, we used Feasible Generalized Least Squares estimates obtained for a fixed effects panel data regression model. Based on its estimates, we found that common or multiple bond type, size and
overdue loans of a CU have no individual effect on its orientation/domination. Hence, we expect new
regulatory measures introduced by the Central Bank of Brazil as of July of 2003, which allow for the creation of multiple bond CUs, will have no effect on the domination behavior of Brazilian CUs.
The preferred model estimates also showed that the total amount of loans over social capital
and adjusted equity over total assets for a CU are individually significant to explain a CU
orientation/domination so that the greater each one of them is, the more likely a CU will be borrower dominated. On the other hand, results showed that the age and current operational expenses over
total asset of a CU are individually significant so that the greater each of them, is the more likely a
CU will be saver dominated. Finally, the average value of the current operational expenses over
total asset in the panel data indicated that the Brazilian CUs were operationally efficient according to
the criterion of the World Council of Credit Unions.
We suggest that future research should focus on investigating the implications Brazilian CU domination has on the way the Brazilian CUs are administrated and on their financial sustainability. Also, as more data become available, the analysis conducted in the present paper should be extended so as to include CUs affiliated with the other Brazilian cooperative systems Sicredi, Unicredi, and Ancosol.
Acknowledgments
Notes
1 Patin and McNiel (1991a) criticized this classification criterion, arguing that it fails to directly incorporate any measures of
the benefits accruing to either borrowers or savers.
2 Freitas, A. F. de, Amaral, I. C., & Braga, M. J. (2008). A influência dos riscos de liquidez e de crédito no processo de
conversão das cooperativas de crédito rural em cooperativas de crédito de livre admissão: um estudo de caso [Versão eletrônica]. Revista de Contabilidade e Organizações, 2(4), 126-147, found that Brazilian common bond CUs who converted to open-admission experienced a significant increase in their levels of credit risk. Thus, it seems reasonable to conjecture that the increase in credit risk has been caused by the expansion of credit to new CUs members who, therefore, should have been necessarily borrowers.
3 Demirgüç-Kunt, A., Karacaovali, B., & Laeven, L. A. (2005). Deposit insurance around the world: a comprehensive
database [World Bank Policy Research Working Paper No. 3628]. The World Bank, Washington-DC, USA, presents a detailed description about financial cooperatives in Brazil.
4 This paper was presented at the “2nd Brazilian Summit of Researchers on Cooperatives”.
5We used as proxy the total of the CU’s expenses with dividends payments divided by the total monetary volume of member
savings balances, both measured as Real (R$) which is the Brazilian currency unit.
6 We used as proxy the nominal interest rate for savings accounts at Brazilian banks measured as percentage per month.
7 We use as proxy the average of the pre-fixed referential interest rates for free resources – personal credit – measured as
percentage per month.
8 We use as proxy the total income obtained by a CU from all charges on loans over the total volume of loans to CU
members, both measured as R$.
9Smith (1986) does not find evidence of member groups’ domination but points out that the size effect can be captured by
the variable age.
10 Leverage is defined as the Total Assets over Adjusted Equity.
References
Baltagi, B. H., & Wu, P. X. (1999). Unequally spaced panel data regressions with AR(1) disturbances.
Econometric Theory, 15(6), 814-823.doi: 10.1017/S0266466699156020
Black, H., & Dugger, R. H. (1981). Credit union structure, growth and regulatory problems. Journal of Finance, 36(2), 529-538. doi: 10.1111/j.1540-6261.1981.tb00471.x
Davidson, R., & MacKinnon, J. G. (1993). Estimation and inference in econometrics. Oxford: University Press.
Doornik, J. A., & Hansen, H. (1994). An omnibus test for univariate and multivariate normality [Working Paper]. Nuffield College, Oxford. Retrieved from http://www.doornik.com/research/normal2.pdf
Fischer, K. P. (2000). Deposit insurance and moral hazard in financial cooperatives. Quebec: Université Laval. Retrieved from http://www.cofi.ecn.ulaval.ca/PubDom/cu_di.pdf
Flannery, M. J. (1974). An economic evaluation of credit unions in the united states (Report Nº 54), Boston, Federal Reserve Bank of Boston.
Hansen, C. B. (2007). Generalized least squares inference in panel and multilevel models with serial correlation and fixed effects. Journal of Econometrics, 140(2), 670-694. doi: 10.1016/j.jeconom.2006.07.011
Jarque, C. M., & Bera, A. K. (1980). Efficient tests for normality, homoscedasticity and serial independence of regression residuals. Economics Letters, 6(3), 255-259. doi: 10.1016/0165-1765(80)90024-5
Judge, G. G., Griffiths, W. E., Hill, R. C., & Lütkepohl, H. (1985). The theory and practice of econometrics (2nd ed.). New York: Wiley.
Kohers, T., & Mullis, D. (1990). The impact of a financial institution’s age on its financial profile and operating characteristics: the evidence for the credit union industry. Review of Business and Economic Research,26, 38-49.
Leggett, K. J., & Stewart, Y. H. (1999). Multiple common bond credit unions and the allocation of benefits. Journal of Economics and Finance, 23(3), 235-245.doi: 10.1007/BF02757708
Nair, A., & Kloeppinger-Todd, R. (2007). Reaching rural areas with financial services: lessons from financial cooperatives in Brazil, Burkina Faso, Kenya, and Sri Lanka [Agriculture and Rural Development Discussion Paper No. 35]. The International Bank for Reconstruction and Development/The World Bank, Washington-DC, USA.
Patin, R. P., Jr., & McNiel, D. W. (1991a). Benefit imbalances among credit union member groups: evidence of borrower-dominated, saver-dominated and neutral behavior? Applied Economics,
23(4), 769-780. doi: 10.1080/00036849108841034
Patin, R. P., Jr., & McNiel, D. W. (1991b). Member group orientation of credit unions and total member benefits. Review of Social Economy, 49(1), 37-61. doi: 10.1080/00346769100000003
Richardson, D. C. (2002). PEARLS monitoring system. World Council of Credit Unions Toolkit series [Number 4]. Madison, WI, EUA. Retrieved from http://www.woccu.org/pdf/monogr4.pdf
Smith, D. J. (1984). A theoretic framework for the analysis of credit union decision making. Journal of Finance, 39(4), 1155-1168. doi: 10.1111/j.1540-6261.1984.tb03899.x
Smith, D. J. (1986). A test for variant objective functions in credit unions. Applied Economics, 18(9), 959-970. doi:10.1080/00036848600000053
Smith, D. J. (1988). Credit union rate and earnings retention decisions under uncertainty and taxation.
Journal of Money, Credit, and Banking, 20(1), 119-131.
Smith, D. J., Cargill, T. F., & Meyer, R. A. (1981). Credit unions: an economic theory of a credit union. Journal of Finance, 36(2), 519-528. doi: 10.1111/j.1540-6261.1981.tb00470.x
Soares, M. M., & Melo, A. D. de, Sobrinho (2007). Microfinanças: o papel do Banco Central do Brasil e a importância do cooperativismo de crédito. Brasília, DF: Banco Central do Brasil.
Spencer, J. E. (1996). An extension to Taylor’s model of credit unions. Review of Social Economy,
54(1), 89-98. doi: 10.1080/00346769600000004
Taylor, R. A. (1971). The credit union as a cooperative institution. Review of Social Economy, 29(2), 207-217. doi:10.1080/00346767100000033
Wilcoxon, F. (1945). Individual comparisons by ranking methods. Biometrics Bulletin, 1(6), 80-83. doi: 10.2307/3001968
APPENDIX
Operationalization of RRT
RRT = proportion of interest income on loans refunded to CU borrower members: (E/C)
E = refunded income in R$
Number of COSIF Account Description
(+) 6.1.7.00.00-2 Leftover or losses accumulated (balance at the end of month)
(+) 4.9.3.10.00-5 Dividends and bonus to pay (balance at the end of month)
C = income earned by the CU or fee charged by the CU on loans (movement of the month in R$)
Number of COSIF Account Description
(+) 7.1.1.03.00-8 Income from advances to depositors (movement of the month)
(+) 7.1.1.05.00-6 Income from loans (movement of the month)
(+) 7.1.1.10.00-8 Income on discounted securities (movement of the month)
(+) 7.1.1.15.00-3 Income from financing (movement of the month)
(+) 7.1.1.40.00-9 Income of rural financing - free applications (movement of the month)
(+) 7.1.1.50.00-6 Income of rural financing - passed and refunded applications (movement of the month)
(+) 7.1.1.55.00-1 Income from agribusiness financing (movement of the month)