R E S E A R C H
Open Access
Patterns of eye movement in
matching-to-sample tasks
Edson Massayuki Huziwara
1,2*, Deisy das Graças de Souza
2,3and Gerson Yukio Tomanari
2,4Abstract
The present study evaluated whether during a matching-to-sample procedure (MTS), the time spent observing stimuli is related to the establishment of selection or rejection controlling relationships in human participants. It also evaluated whether different response topographies (i.e., participants using the keyboard or mouse) would influence the duration of eye fixations. Ten college students participated. The procedure established conditional relationships among six sets of abstract stimuli. Five participants selected the comparison stimuli using a computer mouse and five used a keyboard. An eye-scan device recorded eye movements throughout the training procedure. After participants completed training, probes verified whether the conditional relationships learned were controlled by selection (e.g., if A1, select B1), by rejection (e.g., if A1, reject B2), or both. All participants displayed a similar pattern of stimuli observation. Time spent observing the sample stimulus (e.g., A1) was longer than observing the comparison stimuli (e.g., B1 and B2). Time spent observing S+ (positive stimuli; e.g., B1) was longer than observing S- (negative stimuli; e.g., B2). Duration of eye fixation was not related to selection or rejection controlling relationships, but different response topographies appeared to modulate the amount of time spent observing stimuli.
Keywords:Eye movements, Eye fixation, Conditional relations, Stimulus control topographies, Response topographies, College students
Background
Training conditional relationships using a matching-to-sample (MTS) procedure typically consists of providing one sample, A1, and then rewarding only subsequent choices of B1 (and not, for example, B2). In this case, B1 is the positive stimulus or S+ and B2 is the negative stimulus or S-. When A2 is given, the opposite occurs: B1 is not associated with any consequences, but now B2 is followed by reinforcement (i.e., B1 is the S- and B2 is the S+, when A2 is the sample).
According to Carrigan and Sidman (1992), two main fac-tors can modulate the learning of conditional relationships during MTS procedures. The first regards the pairing of stimuli during training, more specifically, whether the sam-ple is related to S+ or S-. The second factor concerns the behavioral component that defines relationship between the sample and the comparison stimuli. Aselect control oc-curs when the sample relates to S+ and the established
behavioral component is to choose (e.g., if A1, thenchoose B1). A reject control, in contrast, occurs when the sample relates to S- and the established behavioral component is “do not choose”or“reject”(e.g., if A1, thenrejectB2).
Perez and Tomanari (2008) have identified three main experimental variations used to study the occurrence of selection and rejection controlling relationships: (i) procedures that add new stimuli to replace one of the comparison stimuli (e.g., Cumming and Berryman 1965; Dixon and Dixon 1978; Goulart et al. 2005; McIlvane et al. 1987; Stromer and Osborne 1982); (ii) procedures that add masks to replace one of the comparison stimuli (e.g., McIlvane et al. 1987; Wilkinson and McIlvane 1997); and (iii) procedures that use different amounts of S+ and S- to establish the two types of stimulus control (e.g., Johnson and Sidman 1993; Magnusson 2002).
The experiment designed by Stromer and Osborne (1982) is an example of the use of new stimuli. Four adolescents with atypical development were taught to conditionally relate visual stimuli of two distinct sets (AB relations). Given A1, the participants should choose the comparison B1 and not choose the comparison B2. * Correspondence:[email protected]
1
Universidade Federal de Minas Gerais, Belo Horizonte, MG, Brasil
2Instituto Nacional de Ciência e Tecnologia sobre Comportamento, Cognição e Ensino, Brasil
Full list of author information is available at the end of the article
Given A2, they should choose the comparison B2 and not the comparison B1. After achieving a learning criterion, participants were exposed to symmetrical trials (BA rela-tions) with the introduction of new stimuli to evaluate the establishment of control by selection and rejection. For example, given B1, the comparisons could be A1 and a new stimulus. Participants choosing A1 would demon-strate that they had established the relationship between the sample and S+ (i.e., select control). On the other hand, given the same sample B1, another comparison could be A2 and a new stimulus. In this second case, partici-pants choosing the new stimulus would demonstrate that they had established the relationship between B1 and S- (i.e., reject control). In the study by Stromer and Osborne, participants exhibited a high percentages of correct responses in both types of trials, demonstrating that the initial procedure had established both selection and rejection controlling relationships.
The study carried out by McIlvane et al. (1987) is an example of the use of masks. Eight adults with typical development were trained on conditional relationships between nonsense words that were composed of three letters. Given the samples “CUG,” “VEK,” and “DAX,” the correct responses were“ZID,” “PAF,”and “BEH,” re-spectively. Each trial presented a word as the sample (e.g., “CUG”) in the center of a computer screen and another two words as comparison stimuli on the bottom of the screen (e.g., “ZID” and “PAF”). After participants learned the conditional relationships between the words, probe trials with masks were used to test selection and rejection relationships. Each probe trial presented a word as the sample (e.g., “CUG”) and, as comparison stimuli, a word and a mask or “empty” stimulus (e.g., “ZID”and “===”or“===”and “PAF”). In trials in which the S- was replaced by a mask, participants chose the words more frequently than the masks, thus demonstrat-ing the establishment of the relationship between the sample and S+ (i.e., select control). In trials in which the S+ was replaced by a mask, participants more frequently chose the mask instead of the words, thus demonstrating a learned relationship between the sample and S- (i.e., reject control).
Finally, the study by Johnson and Sidman (1993) is an example of the third experimental variation: each sample was related to a single S- stimulus and four S+ stimuli. Thus, given A1, some trials had B1 and B2 as compari-son stimuli, other trials had X1 and B2, and so on. Four conditional relationships were therefore led to selection control (i.e., if A1, then choose B1, X1, X2, or X3), and only one conditional relationship led to rejection control (i.e., if A1, do not choose B2). Overall, this procedure more strongly fostered the reject control, since learning to reject B2 was sufficient for obtaining correct responses on all trial types.
Observing the stimuli selected and, more specifically, the duration of eye fixation on each alternative, can be used to assess the establishment of control by selection or rejection (Kato et al. 2008; Wilkinson and McIlvane 1997). Kato et al. (2008) suggested that participants who spend more time observing S+ stimuli have an increased likelihood of establishing selection control, whereas par-ticipants who spend more time observing S- stimuli have an increased likelihood of establishing rejection control. Importantly, all of the procedures used to study selection and rejection relationships seem to require some specific patterns of visual contact with the stimuli in each trial and this fact could be related to the controlling relations established. In the procedure by Johnson and Sidman (1993), for example, considering the trials in which A1 was presented, B2 (S-) was presented four times more often than the each S+ (B1, X1, X2 and X3). McIlvane et al. (1987) and Stromer and Osborne (1982) did not manipulate the frequency of each stimuli, but they did manipulate the possibility of visual contact by replacing one of the comparison stimuli with masks or new stimuli.
The link between learning conditional relationships and eye movements was directly assessed in an experi-ment by Dube et al. (2006). Each trial began with the presentation of a sample composed of four elements in a 2 × 2 matrix. When the participant touched any point in the sample, it disappeared. After 1 s, three comparison stimuli were presented each in one of the four corners of the monitor screen. One comparison stimulus was identical to one of the elements of the sample previously presented, and touching it was defined as the correct response. Eye movements were recorded during the pro-cedure and participants who spent more time observing the samples achieved a higher percentage of correct re-sponses in this task, whereas participants who spent less time observing the samples achieved a lower percentage of correct responses. The participants who demonstrated lower percentages of correct responses were given add-itional training sessions using the same procedure. Their rate of performance improvement was associated with the extent to which they increased time spent observing the components of the sample stimulus. Dube et al. (2010) replicated this study and showed that for partici-pants who performed poorly, increasing the duration of observation of sample stimuli increased accuracy. Simi-lar results have been described in other experiments that have related one’s time spent observing stimuli and pat-tern of choosing the stimuli in simple discrimination tasks (Pessôa et al. 2009; Schroeder 1970).
conditional relationships based on the procedure used by Johnson and Sidman (1993). Eye movements were defined by the frequency with which participants observed one of the comparison stimuli. Duration of observation was not considered. Participants observed S- more frequently than S+ when establishing a rejection control relationship, but observed S+ more frequently than S- when establishing a selection control relationship. Thus, this experiment dem-onstrated that particular relationship to be learned can modulate the frequency of stimuli observations. The rela-tionship between the duration of eye fixation and the establishment of controls, however, has not yet been sys-tematically investigated.
One important issue about eye movements is that the duration of stimulus observation in MTS tasks can be modulated by different response topographies, as sug-gested by Kato et al. (2008). According to these authors, the use of a computer mouse to select a comparison stimulus can provide the participant with an occasion to spend more time observing the stimuli, because responding requires looking at the S+ and positioning the cursor on it. The use of a keyboard does not require this added looking time. If this is true, an increase in the time spent observing the S+ stimuli would contribute to establishing selection control relationships among those participants who use a mouse. Another issue to consider regarding the measurement of eye movements is that in general looking frequency and duration will be corre-lated. However, the method of responding may bias measurements. By using a keyboard, often participants look back and forth between the stimuli and the keyboard many times within the same trial. This results in a greater frequency of short-duration observations of stimuli. Such patterns do not occur when a mouse is used.
Considering that (i) visual contact and time spent ob-serving stimuli in each trial are important aspects involved in the establishment of conditional relationships, and that (ii) the topographies of responses can bias eye movements, the aim of the present study was to investigate the eye movements of participants learning conditional relation-ships via MTS and to compare those indicating responses with a mouse to those using a keyboard. We evaluated whether eye movements, analyzed in terms of gaze fixation duration, are related to establishing selection and rejection control relationships and whether the use of different response topographies influences the time spent observing the stimuli presented in each trial.
Method
Participants
Ten college students with no previous experience on Experimental Analysis of Behavior research and without noticeable visual deficits participated in the study. Table 1 presents general information about the participants,
including age, gender, undergraduate course, and experi-mental condition.
Setting and apparatus
The research was conducted in a 2 × 3.5 m room with fur-niture, adequate illumination, and noise control. Training procedures and data recording were controlled by MTS software (Dube 1991), installed on an Apple Macintosh 6160 computer with a 15-inch screen. Stimuli were black abstract figures drawn on 5 × 5 cm white squares. Twelve stimuli were used in this experiment. These stimuli were equally divided into six sets which were identified by the letters A through F. Together with the letters, numbers were used to differentiate stimuli within the same set. Thus, set A was composed of A1 and A2, set B of B1 and B2, and so on.
An ISCAN® corneal reflection tracking system with 0.3° precision in a visual field of 20° × 20° was used to record the eye movements. A video of the participants’ visual field was captured and recorded on a second com-puter using Pinnacle Studio Plus 9® software. In this video, a cross-shaped cursor showed the participant’s focus of vision. Video Frame Coder® software was used to transform the video into a continuous sequence of frames at regular 30-ms intervals (see Fig. 1 for an example).
According to the location of the cross-shaped cursor, in each we identified the stimulus being observed and the duration of eye fixation on each stimulus. A second inde-pendent observer, who had no knowledge about the issues involved in the present experiment, coded the frames of 20 % of all sessions. The percentage of agreement between observers was obtained by dividing the number of agree-ments by the sum of agreeagree-ments and disagreeagree-ments and multiplying by 100. The average of percentage of agree-ment between observers was greater than 95 %.
Table 1General Characteristics Of The Participants: Age, Gender, Undergraduate Course, And Experimental Condition To Which They Were Assigned
Participant Age (years) Gender Undergraduate course
Experimental condition
P1 26 Male Oceanography Keyboard
P2 20 Male Engineering Keyboard
P3 22 Female Biology Keyboard
P4 23 Female Letters Keyboard
P5 41 Male Geography Keyboard
P6 23 Female Geophysics Mouse
P7 19 Female Letters Mouse
P8 19 Female Pedagogy Mouse
P9 20 Female Letters Mouse
Procedure
Teaching conditional relationships
Trials were initiated with the presentation of a sample stimulus in the center of the screen. Responding to this sample added to the screen the presentation of two comparison stimuli in two of the four lateral win-dows. Correct responses were followed by the presen-tation of the word “CORRECT” above the central position of the screen followed by a 2-s inter-trial interval (ITI). Incorrect responses were followed by a black screen for 3 s then the ITI. During the ITI, a
blank white screen was presented and responses did not have any programmed consequences.
The conditional relationships for EF, DE, CD, BC, and AB were trained in five distinct steps in that order. The transition from one step to the next depended on the achievement of a learning criterion. During Step 1 (EF relationships), for example, one stimulus of Set E (i.e., E1 or E2) was presented as the sample and both stimuli of Set F were simultaneously displayed as com-parisons (i.e., F1 and F2). In Step 2 (DE), one stimulus of Set D (i.e., D1 or D2) was presented as the sample and both stimuli of Set E were simultaneously pre-sented as comparisons (i.e., E1 and E2), and so on. Each step was divided into three blocks (with the exception of Step 1, which had only two blocks). The first block consisted of eight trials in which a written hint was pre-sented on the screen. Above the sample was the phrase, “when this is here,” and above the correct comparison was the phrase,“press here.” The learning criterion was 100 % correct responses in a block and teaching trials repeated until this criterion was reached. The second block consisted of 16 trials with the same conditional relationships without the written hint. The learning cri-terion remained at 100 %. The third block consisted of a cumulative baseline of all previous conditional rela-tionships with the number of trials increasing from one step to the next. The learning criterion was 95 % correct responses, and the entire block of trials was re-peated until this criterion was met. Table 2 shows the order of exposure to the steps, the type and number of trials, and the learning criteria.
Fig. 1Example of a Frame Generated By ISCAN. The Cross-Shaped Cursor Represents the Location Where the Participant Directing His/Her Focus at the Time of Image Capture
Table 2Sequence of training steps, functions of each step, relations trained, number of trials in each block, and criterion for termination
Step Block Relation trained Number and type of trial Total Criterion of correct responses
1 1 EF with hint 4 EF1; 4 EF2 8 100 %
2 EF without hint 8 EF1; 8 EF2 16 100 %
2 1 DE with hint 4 DE1; 4 DE2 8 100 %
2 DE without hint 8 DE1; 8 DE2 16 100 %
3 EF/DE 4 EF1; 4 EF2;4 DE1; 4 DE2 16 95 %
3 1 CD with hint 4 CD1; 4 CD2 8 100 %
2 CD without hint 8 CD1; 8 CD2 16 100 %
3 EF/DE/CD 4 EF1; 4 EF2; 4 DE1;4 DE2; 4 CD1; 4 CD2
24 95 %
4 1 BC with hint 4 BC1; 4 BC2 8 100 %
2 BC without hint 8 BC1; 8 BC2 16 100 %
3 EF/DE/CD/BC 3 EF1; 3 EF2; 3 DE1;3 DE2; 3 CD1; 3 CD2;3 BC1; 3 BC2
24 95 %
5 1 AB with hint 4 AB1; 4 AB2 8 100 %
2 AB without hint 8 AB1; 8 AB2 16 100 %
3 EF/DE/CD/BC/AB 4 EF1; 4 EF2; 4 DE1;4 DE2; 4 CD1; 4 CD2;4 BC1; 4 BC2; 4 AB1; 4 AB2
Probes of selection and rejection controlling relationships After participants reached the learning criterion at the end of the fifth step, in which all trial types were mixed, trials probing the establishment of conditional relation-ships began. At the beginning of these sessions, a mes-sage on the computer screen informed the participants that the different consequences for correct and incorrect responses would no longer be presented. This session consisted of 80 trials, 40 baseline and 40 probe trials. Identical to the experiment by Stromer and Osborne (1982), the new stimuli were added in trials that were symmetrical to those that were presented during train-ing. Thus, trials evaluating selection control relation-ships had, for example, F1 as the sample followed by a choice between E1 (S+) and a new stimulus (NS). In these trials, the choice of E1 would indicate that the par-ticipant had learned the relationship between the sample (F1) and S+ (E1). Similarly, trials evaluating rejection control relationships had, for example, F1 as the sample followed by a choice between E2 (S-) and NS. In these trials, choosing NS demonstrated the establishment of the rejection control relationship between the sample (F1) and S- (E2). The new stimuli replaced S+ in half of the testing trials and replaced the S- in the other half.
Response topography
Participants were equally divided into two experimental conditions, concerning the response topography used in the baseline and probing process. Participants in the Keyboard condition received the following written in-structions (in Portuguese): “You will make your choice responses by pressing numerical keys that correspond the positions of the windows in which stimuli will be displayed on the computer screen. Key 5 corresponds to the central window. Key 7 corresponds to the upper left window. Key 9 corresponds to the upper right window. Key 1 corresponds to the bottom left window and Key 3 corresponds to the bottom right window.“ Participants in the Mouse condition received the following written instructions (in Portuguese):“You will make your choice responses by moving and pressing the mouse cursor. You will need to move the cursor to the window that contains the stimulus, to put the cursor on it, and press the right mouse button.” After participants read these instructions, the experimenter asked whether they had any questions and, when necessary, the experimenter demonstrated the response techniques in each case.
Recording eye movements
During all teaching and probing procedures, partici-pants’eye movements were recorded. The response was defined as directing focus on the window that corre-sponded a presented stimulus (see Fig. 1). The average distance between the participants’ eyes and the screen
was 65 cm. The stimulus sizes were 2° × 2°, and the pres-entation window was 3.5° × 3.5°.
Results
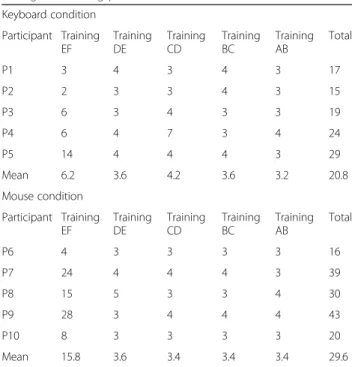
Table 3 presents the number of blocks that each partici-pant required to achieve the learning criterion across the steps of the teaching procedure sorted by response con-dition (keyboard or mouse). If the participant did not make any errors, then the procedure was finished after 14 blocks. Analyses of the Keyboard condition indicated that most of the errors occurred during EF training (i.e., the first conditional relationship that was trained). In this training, participants P1 through P5 achieved the learning criterion in three blocks, P2 in two blocks, P3 and P4 in six blocks, and P5 in 14 blocks. During DE training, P1, P4, and P5 achieved the criterion after four blocks, and P2 and P3 after three blocks. Two blocks were required by P1 and P2 for achieving the criterion during CD training, four blocks for P3 and P5, and seven blocks for P4. For achieving the criterion in training BC, four blocks were required by P1, P2, and P5, and three blocks for P3 and P4. Finally, during training AB, all par-ticipants achieved the criterion after three blocks, except P4 who achieved it after four blocks. On average, partici-pants in this condition required 20.8 blocks to complete the entire training process.
Similar to the participants in the Keyboard condition, the number of errors was higher in EF training when compared with DE, CD, BC, and AB trainings for partic-ipants in the Mouse condition (P6 through P10). In EF training, P6 achieved the criterion in four blocks, P7 in
Table 3Number of blocks required to achieve the criteria during the training procedure
Keyboard condition
Participant Training EF
Training DE
Training CD
Training BC
Training AB
Total
P1 3 4 3 4 3 17
P2 2 3 3 4 3 15
P3 6 3 4 3 3 19
P4 6 4 7 3 4 24
P5 14 4 4 4 3 29
Mean 6.2 3.6 4.2 3.6 3.2 20.8
Mouse condition
Participant Training EF
Training DE
Training CD
Training BC
Training AB
Total
P6 4 3 3 3 3 16
P7 24 4 4 4 3 39
P8 15 5 3 3 4 30
P9 28 3 4 4 4 43
P10 8 3 3 3 3 20
24 blocks, P8 in 15 blocks, P9 in 28 blocks, and P10 in eight blocks. During DE training, P6, P9, and P10 achieved the criterion after three blocks, P7 after four blocks, and P8 after five blocks. Three blocks were used by P6, P8, and P10 for achieving the criterion during CD training, and four blocks were used by P7 and P9. For achieving the criterion in BC training three blocks were required for P6, P8, and P10, and four blocks for P7 and P9. Finally, during AB training, P6, P7, and P10 achieved the criterion after three blocks and P8 and P9 after four blocks. The mean number of blocks required by partici-pants in the Mouse condition was 29.6.
A comparison of the results in the Keyboard and Mouse conditions revealed a difference in the mean number of sessions required for learning (20.8 blocks vs. 29.6 blocks, respectively). This difference was largely caused by the number of blocks required to reach the learning criterion in EF training: Participants using the mouse required an average of 15.8 blocks, whereas participants using the keyboard required approximately six blocks. For the other training steps (DE, CD, BC, and AB training), the mean number of blocks required was approximately four in both conditions.
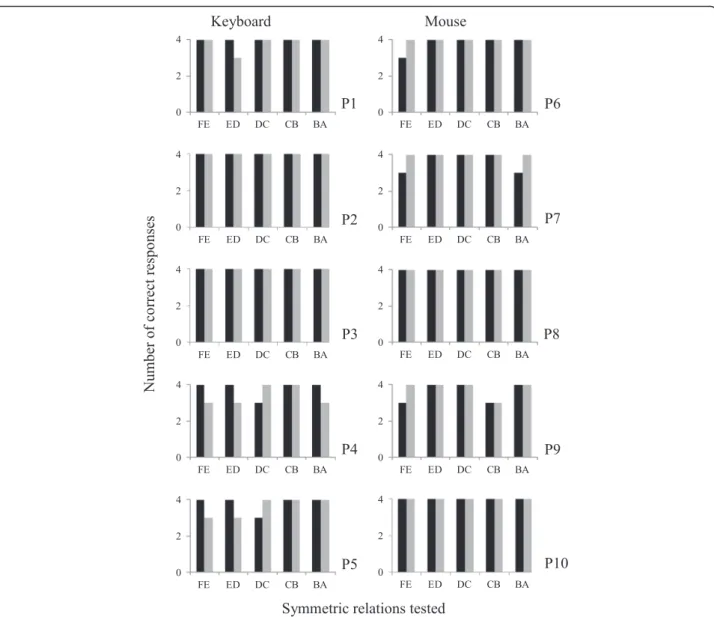
Figure 2 presents the results of the probe trials used to evaluate the establishment of selection and rejection re-lationships. The left and right panels of Fig. 2 present the number of correct responses in the Keyboard and Mouse conditions, respectively. The black bars represent the number of correct responses in probe trials that evaluated controlling relations by rejection, and the gray bars represent the number of correct responses in probe trials that evaluated controlling by selection. All partici-pants, regardless of condition, responded correctly in most of the trials. Participants P2, P3, P8, and P10 made correct responses for all 40 testing trials. Participant P1 made only one error in a trial that evaluated selection control of the ED relationship. Participant P6 also made only one error in a trial that evaluated rejection control of the FE relationship. Participant P7 made two errors in trials that evaluated rejection control of the FE and BA relationships. Participant P4 made four errors, and both P5 and P9 made three errors each. In summary, the par-ticipants in the Keyboard condition made a total of eight errors, six in the probe trials that evaluated controlling by selection and two in the trials that evaluated control-ling by rejection. In the Mouse condition, six errors were observed, with only one error in the trials that evaluated controlling by selection and five errors in the trials that evaluated controlling by rejection.
In Fig. 3, black triangles represent the time spent ob-serving the sample stimulus, black squares present the time spent observing the S+, and white circles present the time spent observing the S- stimulus during the training procedure. Once again, the left and right panels
present the results in the Keyboard and Mouse conditions, respectively. Due to problems in the ISCAN system, data of DE training for P2 and BC training for P5 could not be analyzed.
All participants exhibited the same general pattern of eye fixation duration. They observed the sample stim-uli for longer periods than they observed the compari-son stimuli and they observed the S+ stimuli longer than S- stimuli. The majority of participants also ex-hibited a considerable decrease in duration of fixation in successive steps of the learning phase. In the Mouse condition, for the participants P6, P8, and P9, we observed a gradual decrease in the total time spent observing all stimuli. In contrast, participant P10 spent approximately 60s observing the sample stimulus during each of the five steps of training. We also observed a gradual decrease in the total time spent observing all stimuli for participants P2 and P3 in the Keyboard condition. Remaining partici-pants in both conditions maintained considerably stable observation durations across all training sessions.
Discussion
The present study sought to investigate the patterns of ob-serving sample and comparison stimuli (both S+ and S-) of participants learning a series of five pairs of conditional relationships under two conditions of responding (using either a mouse or keyboard). In particular, we assessed whether our training procedure would establish selection and/or rejection control relationships, and whether eye movements and response topographies would impact the learning of these relationships. The main measurement of participant eye movements was the duration of gaze fixation on the different stimuli.
All participants exhibited the same pattern of eye fix-ation durfix-ation. The sample stimulus was observed for a longer period in each trial, followed by the S+ and then S-. If the time spent observing the S+ or S- could be related to the establishment of selection control, as argued by Wilkinson and McIlvane (1997) and Kato et al. (2008), all participants should therefore exhibit a greater proportion of correct responses in the probe trials evaluating selec-tion control and a lower proporselec-tion of correct responses in the probe trials evaluating rejection control. Most par-ticipants, however, made correct responses in all trials (P2, P3, P8, and P10) or made only one error (P1 and P6). This indicates that the teaching procedure established both types of controlling relationships (selection and rejection). As pointed out by McIlvane et al. (2000), learning both routes establishes robust stimulus control of conditional
relationships. Only four participants out of ten made two errors or more. Participants from the Mouse condition (P7 and P9), for example, made more errors in trials that evaluated rejection control. Participants from the Key-board condition (P4 and P5), in turn, made more errors in trials that evaluated selection control. The frequency of er-rors, however, was low in both conditions, despite the fact that participants observed the S+ for longer periods than they observed the S-. Therefore, under the conditions of the present study, we did not find any evidence of a rela-tionship between the time spent observing stimuli in MTS tasks and the establishment of selection and rejection control.
authors (Fields et al. 1990; Saunders and Green 1999; Saunders et al. 1993) this process may be less effective than other training arrangements for the generation of stimuli equivalence. Thus, considering the analysis of Johnson and Sidman (1993), this linear training struc-ture could generate only one of the two types of
stimulus controls (selection or rejection). If that happened, we could then identify if there were any re-lationship between eye fixation and the particular stimulus control. However, as already described, our procedure generated both selection and rejection stimulus control. This result was probably due to
Cumulative time
(s)
0 20 40 60 80
EF DE CD BC AB
0 20 40 60 80
EF DE CD BC AB
0 20 40 60 80
EF DE CD BC AB
0 20 40 60 80
EF DE CD BC AB
0 20 40 60 80
EF DE CD BC AB
0 20 40 60 80
EF DE CD BC AB
0 20 40 60 80
EF DE CD BC AB
0 20 40 60 80
EF DE CD BC AB
0 20 40 60 80
EF DE CD BC AB
0 20 40 60 80
EF DE CD BC AB
0 20 40 60 80
EF DE CD BC AB
0 20 40 60 80
EF DE CD BC AB
Keyboard Mouse
P1
P2
P3
P4
P5
Average
P6
P7
P8
P9
P10
Average
Conditional relations trained
some features of the teaching procedure, including the use of written instructions about the sample-S+ rela-tionship in the first block of trials and the strict learn-ing criterion.
However, the low variability we observed in perform-ance does not exclude the possibility of a relationship be-tween the duration of eye fixation and the establishment of controlling by selection or rejection. For example, in terms of duration of eye fixation, it would be important to know whether other participants exhibiting a different pattern than that of the participants in the present experi-ment would achieve a high percentage of correct re-sponses in probes evaluating select and reject control relationships. In a similar way, it would be important to know whether participants who performed poorly on tests would exhibit a pattern of eye fixation different from that of the present experiment. These questions require future studies in which experimental manipulations generate dif-ferential patterns of select and reject controlling relation-ships (for example, as suggested by Johnson and Sidman 1993) in order to assess whether such variability is related to patterns of eye fixation.
The second aspect investigated in the present study was related to the influence of different response topographies on the time spent observing the stimuli. First, it was observed that irrespective of the response topography, there was a practice effect whereby observation durations declined across the steps of the training process. This is similar to that described by Schroeder (1970) and other experiments (e.g., Perez et al. 2014; Pessôa et al. 2009). Schroeder analyzed eye movement behavior in college students who received training in a simple discrimination task and showed a decrease in the time spent observing stimuli throughout the training steps. We observed a very similar pattern for duration of eye fixation, especially for P2 and P3 in the Keyboard condition and for P6, P8, and P9 in the Mouse condition.
According to Kato et al. (2008), using a mouse to indi-cate choices compared to using a keyboard will: (i) in-crease the time spent observing the S+ because it demands that the participants observe the stimulus to position the cursor and (ii) consequently favors the es-tablishment of selection control over rejection control relationships. With regard to the time of observation, our results indicated that the time spent observing the S + was indeed greater for participants in the Mouse dition compared with participants in the Keyboard con-dition (Fig. 3). Participants in the Mouse concon-dition also observed the sample stimuli and S- longer than partici-pants in the Keyboard condition.
Differences in the time spent observing the sample stimuli and the S- may have influenced the perform-ance of P10. If we consider, for example, the average time spent observing stimuli during DE training,
including participant P10, the means are 42.2 s for the sample, 20.2 s for S+, and 5 s for the S- (see Fig. 3, Average). However, if we exclude participant P10 from analyses, then the mean durations are 34.05 s for the sample stimuli, 19.1 s for the S+, and 3.8 s for the S-. Thus, the values would be considerably different for the sample and the S-, but very similar for the S+. The same analysis holds true for the other training steps. Therefore, the conclusion regarding the increase in the time spent observing the S+ by the participants in the Mouse condition appears to be true, even accounting for the influence of participant P10.
We can also observe that the participants in the Mouse condition required more blocks to achieve the learning criterion for EF training, compared to partici-pants in the Keyboard condition. The increase in the number of blocks consequently results in an increase in the overall time exposed to the stimuli, and this may explain the differences in the time spent observing the stimuli only for this training step. The difference in the number of blocks that were needed to achieve the cri-terion was not observed for any of the other training steps, whereas differences in the time spent observing the S+ persisted. For example, the average number of blocks required in DE training was 3.6 for both condi-tions. Despite this fact, the S+ stimuli were observed for 11.4 s by the participants in the Keyboard condi-tion but 20.2 s by participants in the Mouse condicondi-tion.
According to Kato et al. (2008), the increase in the time spent observing the S+ favors the establishment of selection control in participants who undergo training with a mouse. Among our five participants in the Mouse condition, indeed, only one made an error in the trials that evaluated selection control. However, among the five participants in the Keyboard condition, three participants made six errors selection control trials. Despite the low variability among the participants in the different conditions, these results may support the suggesting by Kato et al. (2008) that using a mouse favors the establishment of selection control.
Conclusions
behavior (Pessôa and Tomanari 2012). In this sense, our findings suggest that the duration of eye fixation may be an important issue to be considered in future experimen-tal procedures and teaching situations.
Competing interests
The authors declare that they have no competing interests.
Authors' contributions
EMH carried out data collection, conducted the data analysis and drafted themanuscript. DGS guided the design of the project, conducted the data analysis anddrafted the manuscript. GYT guided the design of the project, conducted the dataanalysis and drafted the manuscript. All authors read and approved the final manuscript.
Acknowledgements
The present manuscript is part of the Ph.D. research developed by the first author, supported by FAPESP (doctoral fellowship grant) and CAPES (doctoral sandwich grant). Preparation of the manuscript were supported by CNPq (grant # 573972/2008-7) and FAPESP (grant # 08/57705-8), both for the Instituto Nacional de Ciência e Tecnologia sobre Comportamento, Cognição e Ensino (INCT-ECCE).
Author details
1Universidade Federal de Minas Gerais, Belo Horizonte, MG, Brasil.2Instituto Nacional de Ciência e Tecnologia sobre Comportamento, Cognição e Ensino, Brasil.3Universidade Federal de São Carlos, São Carlos, SP, Brasil.4Universidade de São Paulo, São Paulo, SP, Brasil.
Received: 8 February 2016 Accepted: 2 March 2016
References
Carrigan PF, Sidman M. Conditional discrimination and equivalence relations: a theoretical analysis of control by negative stimuli. J Exp Anal Behav. 1992;58: 183–204. doi:10.1901/jeab.1992.58-183.
Cumming WW, Berryman R. The complex discriminated operant: Studies of matching to sample and related problems. Em D. I. Mostofski (Org.), Stimulus generalization. Stanford: Stanford University Press; 1965. p. 284–329. Dinsmoor JA. The role of observing and attention in establishing stimulus
control. J Exp Anal Behav. 1985;43:365–81. doi:10.1901/jeab.1985.43-365. Dixon MH, Dixon LS. The nature of standard control in children’s matching to
sample. J Exp Anal Behav. 1978;30:205–12. doi:10.1901/jeab.1978.30-205. Doran J, Holland JG. Eye movements as a function of response contingencies
measured by blackout technique. J Appl Behav Analy. 1971;4:11–7. doi:10.1901/jaba.1971.4-11.
Dube WV. Computer software for stimulus control research with Macintosh computers. Exp Anal Hum Behav Bull. 1991;9:28–30.
Dube WV, Balsamo LM, Fowler TR, Dickson CA, Lombard KM, Tomanari GY. Observing behavior topography in delayed matching to multiple samples. Psychol Rec. 2006;56:233–44.
Dube WV, Dickson CA, Balsamo LM, Odonnell KL, Tomanari GY, Farren KM, et al. Observing behavior and atypically restricted stimulus control. J Exp Anal Behav. 2010;94:297–313. doi:10.1901/jeab.2010.94-297.
Fields L, Adams BJ, Verhave T, Newman S. The effects of nodality on the formation of equivalence classes. J Exp Anal Behav. 1990;53:345–58. doi:10. 1901/jeab.1990.53-345.
Goulart PRK, Mendonça MB, Barros RS, Galvão OF, McIlvane WJ. A note on select-and reject-controlling relations in the simple discrimination of capuchin monkeys (Cebus apella). Behav Processes. 2005;69:295–302. doi:10.1016/j. beproc.2004.12.005.
Johnson C, Sidman M. Conditional discrimination and equivalence relations: control by negative stimuli. J Exp Anal Behav. 1993;59:333–47. doi:10.1901/ jeab.1993.59-333.
Kato OM, de Rose JC, Faleiros PB. Topography of responses in conditional discrimination influences formation of equivalence classes. Psychol Rec. 2008; 58:245–67.
Magnusson A. Topography of eye movements under select and reject control (Dissertação de mestrado). Boston: Northeastern University; 2002.
McIlvane WJ, Kledaras JB, Munson LC, King KA, de Rose JC, Stoddard LT. Controlling relations in conditional discrimination and matching by exclusion. J Exp Anal Behav. 1987;48:187–208. doi:10.1901/jeab.1987.48-187. McIlvane WJ, Wilkinson KM, de Souza DG. As origens da exclusão. Temas em
Psicologia. 2000;8:195–203.
Perez WF, Endemann P, Pessôa CV, Tomanari GY. Assessing stimulus control in a discrimination task with compound stimuli: Evaluating testing procedures and tracking eye fixations. Psychol Rec. 2014. Advance online publication. doi: 10.1007/s40732-014-0092-1.
Perez WF, Tomanari GY. Controles por seleção e rejeição em treinos de discriminação condicional e testes de equivalência. Revista Brasileira de Análise do Comportamento. 2008;4:175–90.
Pessôa CVBB, Huziwara E, Perez W, Endemann P, Tomanari GY. Eye fixation to figures in a four-choice situation with luminance balanced areas: evaluating practice effects. J Eye Move Res. 2009;2:1–6.
Pessôa CVBB, Tomanari GY. Medidas de controle de estímulos: Fixação do olhar como respostas de observação naturais. Revista Brasileira de Terapia Comportamental e Cognitiva. 2012;14:34–50.
Saunders RR, Green G. A discrimination analysis of training-structure effects on stimulus equivalence outcomes. J Exp Anal Behav. 1999;72:117–37. doi:10. 1901/jeab.1999.72-117.
Saunders KJ, Saunders RR, Williams DC, Spradlin JE. An interaction of instructions and training design on stimulus class formation: extending the analysis of equivalence. Psychol Rec. 1993;43:725–44.
Schroeder SR. Selective eye movements to simultaneously presented stimuli during discrimination. Percept Psychophys. 1970;7:121–4. doi:10.3758/ BF03210147.
Serna R, Carlin MT. Guiding visual attention in individual with mental retardation. Int Rev Res Ment Retard. 2001;24:321–57. doi:10.1016/S0074-7750(01)80013-6. Stromer R, Osborne JG. Control of adolescents’arbitrary matching to sample by
positive and negative stimulus relations. J Exp Anal Behav. 1982;37:329–48. doi:10.1901/jeab.1982.37-329.
Wilkinson KM, McIlvane JW. Blank comparison analysis of emergent symbolic mapping by young children. J Exp Child Psychol. 1997;67:115–30. doi:10. 1006/jecp.1997.2402.
Submit your manuscript to a
journal and benefi t from:
7Convenient online submission
7Rigorous peer review
7Immediate publication on acceptance
7Open access: articles freely available online
7High visibility within the fi eld
7Retaining the copyright to your article