28
disponível em www.scielo.br/prc
Sons and Daughters’ Perception of Parents as a Couple:
Distinguishing Characteristics of a Measurement Model
A Percepção dos Filhos sobre a Conjugalidade dos Pais: Características
Distintas de um Modelo de Medida
Cilio Ziviani
*, Terezinha Féres-Carneiro, & Andrea Seixas Magalhães
Pontifícia Universidade Católica do Rio de Janeiro, Rio de Janeiro, Brasil
Abstract
Perceptions and memories that youths may have of their parents’ marital relationship were addressed by a self-report questionnaire, composed by 26 Likert scale items which were taken to constitute the “Percep-tion of Parents as a Couple” instrument. Answers from 1,612 male and female youths produced a matrix of non-negative correlations. The sample was randomly split into calibrating and validating subsamples of 806 people each. Exploratory factor and principal component analyses present a circular plot of loading s after the first and second extractions. In the latter, pairs of similar magnitude, but of opposing signs, not only convey theoretical meaning, but also entail an order – Guttman’s circular law of order. A specification search, through a confirmatory factor analysis, performed under a measurement model presenting three pairs of opposing-signs and cross-loaded variables, generated a downward chi-square value for each indi-cated parameter respecification. Following that ordered list top-down, ten other items were specified to cross-load in the model. Once tested, running the validating subsample data, satisfactory fit indices were obtained. We propose the Möbius strip as a functional analogue to model this kind of circular ordering. Finally, we nominate two theoretical orientations for further research on the explanation of results – the generational psychic transmission reviewed in the introduction contrasted to the cognitive unconscious theory. Keywords: Parents’ marital relationship; Circumplex structure; Möbius strip; Confirmatory factor analysis.
Resumo
Percepções e memórias que os jovens tenham das relações conjugais de seus pais foram investigadas por um questionário auto-aplicável, no qual 26 itens tipo Likert constituíram o instrumento sobre a Percepção dos Pais na Conjugalidade. Respostas de 1.612 jovens adultos produziram uma matriz de correlações não-negativas. A amostra foi dividida aleatoriamente em subamostras de calibração e de validação, com 806 pessoas cada. Análises exploratórias fatoriais e de componentes principais apresentam um gráfico de cargas de forma circular, após a primeira e a segunda extração. Nesta última, pares de magnitude similar, mas de sinais opostos, não apenas expressam significado teórico, mas acarretam uma ordem – a lei da ordem circular de Guttman. Uma busca de especificação, por meio de análise fatorial confirmatória executada sob um modelo de medida apresentando três pares de variáveis de carga cruzada e sinais opostos, apresentou um valor de qui-quadrado, classificado do maior para o menor, para cada re-especificação de parâmetro indicada. Seguindo esta lista de cima para baixo, mais dez itens foram especificados para cruzamento de carga no modelo. Uma vez testado, processando os dados da subamostra de validação, resultam índices de ajuste satisfatórios. Propomos a fita de Möbius como um análogo funcional para modelar esse tipo de ordenação circular. Finalmente, nomeamos duas orientações teóricas para a pesquisa posterior acerca da explanação dos resultados – a transmissão psíquica geracional revista na introdução, contrastada com a teoria do inconsciente cognitivo.
Palavras-chave:Conjugalidade dos pais; Estrutura circumplexa; Fita de Möbius; Análise fatorial confirmatória.
This research was supported by grants from the Bra-zilian agencies CNPq and FAPERJ which included scholarships to the research assistant collaborators Aline Vieira de Souza, Laura Marques Rizzaro, Luciana Janei-ro Silva, Mariana Reis Barcellos, Vanessa Augusta de Souza, and to the technical collaboration of Rebeca Nonato as well. In addition, authors wish to acknowledge the support of Prof. Orestes Diniz Neto, from the De-partment of Psychology of the Federal University of Minas Gerais, and Prof. Virgílio Gomes do Nascimento, One major assumption held by the theoretical standpoint of generational psychic transmission is that psychological
processes between parents are transmitted to sons and daughters. Our underlying assumption is that there is a
from the Psychology Program at Sociedade Educacional Fluminense, for collecting data in Belo Horizonte and Baixada Fluminense, respectively, and also the assistance of Isabel Elia Ziviani, designer, for the graphical work with figures.
relationship between parents’ marital relations and the concepts, motivations, myths and expectations that sons and daughters have about the marital link. Knowing about this relationship helps understanding sons and daughters’ current position about the role of marriage in their lives. Thus, the influence parents’ marital relations may exert in the consideration of the marital link in the life project of not yet married young adults provides the framework for the presentation of a scale that asks sons and daughters about their parents’ marital relations. The interrelation-ships among the scale item responses produced a resulting covariance matrix with a variety of unexpected characte-ristics. Some of these characteristics – positive manifold, circumplex, meaningful two-factor cross-loading of items – are fully addressed in the present article. They are finally tested, using an independent second sample in a confir-matory factor analysis measurement model.
The theoretical concept of generational psychic trans-mission goes back to the Freudian notion that the newborn, as a subject, is symbolically inserted in a chain in which he or she is a link, and that he or she serves even against one will (Kaës, 1993/2003). According to Freud (1914/ 1999b), the person does carry on a twofold existence, one to serve his or her own purposes (sein Selbstzweck), and the other constituting a link in a chain (als Glied in einer Kette), in which the person serves against his or her will, or at least involuntarily. What follows is the tension between serving one’s own purposes and being a link, beneficiary, servant, and heir of a generational chain – for it defines his or her position as subject of a group, i.e., his or her family.
When investigating the family, we are permanently confronted with different faces of the generational psychic transmission. From the psychic point of view, the family has the central challenge of promoting the individuation of its members. The accomplishment of this task implies the agency of the subject to the place which he or she belongs in the generational chain. The family that psychi-cally nourishes the baby subject since birth, and even before its gestation, preparing a symbolic place to receive it, wishing it, is the same family that has the mission of launching it to the world to germinate its history, its legacy. Investigations on the family have provided important subsidies to understand psychic transmission. In contem-porary society there is a variety of relationship arrange-ments, presenting a raising number of separations and remarriages. The love link presents itself increasingly unstable, of short duration and with plenty of uncertainties regarding its development. In the current society charac-terized by the instantaneous and the disposable, love rela-tionships offer less emotional refuge, frequently rendering into helplessness.
Even so, the family continues to exert a social-affective function, yet representing a refuge against the so-called “liquid modernity” (Bauman, 2003). On the one hand, we face the fluidity and discontinuity of the marital link; on the other hand, there is the difficulty that single adult
sons and daughters have to break off their financial and emotional-affective dependency on their families of ori-gin, in order to inaugurate a new and necessary condition as autonomous adults. There are in the literature reports of an increasing number of sons and daughters, around thirty years of age, living with their parents, with lesser expectations of their marrying possibilities or of raising their own families (Enriques, Féres-Carneiro, & Maga-lhães, 2006; Ramos, 2003).
This is the overall theoretical framework within which the present research was first conceived. An instrument that would be sensible enough to detect meaningful signs of how subjects recollect their parents’ marital relations could be useful. First, in the research setting, to detect how the perception of parents as a couple would influence how sons and daughters currently conceive the marital link in their lives. Second, the instrument would be useful in the clinical endeavor of helping people to better cope with their psychic inheritance.
This instrument, devised as a five-category Likert-type sixty-item questionnaire, was elaborated under two ma-jor sources of influence: the ENRICH Marital Inventory, and the Family Background Questionnaire (FBQ). The first was designed as a multidimensional inventory, which assesses dimensions of marital relationships, as its acronym indicates (Evaluating and Nurturing Relationship Issues, Communication, and Happiness: ENRICH). Both its validity study (Fowers & Olson, 1989) and its major application in a sample of 6,267 couples (Olson & Fowers, 1993) were used as a source of inspiration for writing item content. The second instrument – the Family Back-ground Questionnaire ([FBQ], Melchert & Sayger, 1998), addresses the characteristics of the family of origin and was developed following a thorough review of the avai-lable instruments for assessing family history (Melchert, 1998) – under the proviso that family of origin instruments assess family of origin memories, but not the veridicality of the memories reported.
As Melchert and Sayger (1998) insist, to achieve a full understanding of the validity of family of origin instruments, two perspectives may be applied, a veridical and a phenomenological. Although family of origin me-mory veridicality may be important in a forensic dispute, one cannot infer that experiences reported as family of origin memories actually took place, for there are factors that may result in inaccurate perception and recall. Con-cluding, Melchert and Sayger (1998) posit that objectively accurate and meaningful criteria for establishing the veri-dicality of all family of origin memories do not exist.
Psicologia: Reflexão e Crítica, 24(1), 28-39.
30
Strategy of Analysis
The sample of 1,612 participants was divided into two halves using a computerized random procedure. The first half was the subsample for the exploratory, model generating phase of analysis. The second half was the subsample used to finally test the model indicated by the exploratory procedures developed in the first phase. “Model generating” is an expression used by Jöreskog (1993) when discussing issues related to the translation of a theory to a statistical model. Inspiration for our strategy of analysis comes from this author.
Under this methodological framework, twenty-six items comprising the Perception of Parents as a Couple scale were submitted to an Exploratory Factor Analysis (EFA), after a Principal Components Analysis (PCA), in order to investigate its dimensionality and factorial structure. The third step in the exploratory phase was the tentative testing of the preliminary exploratory results, using a Confirmatory Factor Analysis (CFA) measurement model. A considered model, initially proposed, may not fit the data set well. Thus, the question is how to modify the model seeking a better fit to the data at hand. The answer to this question is to be found in the so-called specification search process, in which changes in chi-square – using Lagrange Multiplier test statistics – indicate parts of the model that, if altered, would improve the fitting of the model to the data.
Is the result, then, the “best” model? No, absolutely not. Specification search by itself does not guarantee mo-del quality, because its results could have been reached by “capitalizing on chance”. Reasonable models generated by means of that kind of model specification process should be cross-validated on independent data. This is the role of the second half of our sample: to serve as a va-lidation subsample in the final testing of the “best” model arrived at the first half using the calibration subsample.
Method
Participants
The sample consisted of 1,612 young adults between 18 and 29 years of age (M = 22.23, SD = 3.25), both male (42%, N = 681) and female (58%, N = 931), from which 1,424 (88%) reported being single. For most (84%, N = 1.349), the parents were the reference couple for answering the questionnaire. Most of the participants were recruited in the city of Rio de Janeiro (27%, N = 437) and its surroundings (62%, N = 993); the other persons were recruited in the city of Belo Horizonte (11%, N = 182). Most (65%, N = 1.049) were attending college or had already reached a higher educational level; more than half (59%, N = 949) reported belonging to middle-class, upper-middle-class or higher. Finally, a minority reported living out of their parents’ home (20%, N = 328), whereas most reported living with both parents (53%, N = 862), with
the mother (22%, N = 351), or with the father (4%, N = 61). Ten people did not answer this question.
Instrument
The 26-item Perception of Parents as a Couple (PPC) scale is part of a 60-item questionnaire on father and mo-ther marital relations as seen by their sons and daughters. The present 26 items address both parents; they do not distinguish between father and mother, as done by other items in the overall questionnaire. The Likert five cate-gories are never, rarely, sometimes, generally, and always. The remaining items are in different formats. For instance, 28 of them refer, actually, to 14 pairs of same-item, but referred to a different parent (one for the mother, and the other for the father). The remaining items have an inter-mediate category for the situations where this is the best kind of answer.
The research project was approved by the university Ethical Committee. The questionnaire, as well as a bio-graphical form, was first applied to a pilot casual sample of 278 people recruited in undergraduate and graduate classes from ten different universities in the city of Rio de Janeiro. Among them, 251 young adults then met the research conditions of being single, middle and upper-middle-class, and between 19 and 30 years of age. A number of items, none of them from the present 26-item PPC scale, were modified after thorough psychometric evaluation. In its preliminary form, the overall scale pre-sented high reliability (Cronbach’s alpha, .96) for 56 items taken together (four items were left out of the analysis). The preliminary study also interviewed 14 people who had responded the questionnaire, with the main goal of knowing how they conceived the marital link, and how the prospect of marrying was considered in their life pro-ject (Féres-Carneiro, Seixas, & Ziviani, 2006).
Results and Discussion
Reliability of the PPC scale on both subsamples is alfa = .96 (the same .96 observed in the pilot study, and repor-ted by Melchert and Sayger in 1998). Before proceeding to the results of multivariate analyses, we comment on differences between exploratory factor analysis (EFA) and principal component analysis (PCA) that bear directly on our results. “Principal components have the special property that the vectors of loadings are orthogonal and the component scores are uncorrelated . . . because of the presence of orthogonal rotations at the heart of the algo-rithm for simple components” (Jolliffe, 2004, p. 291). As such, one can view the effect of carrying a PCA as a rigid rotation of the original coordinate axes. In effect, accor-ding to Raykov and Marcoulides (2008), performing a PCA precludes the need for rotation of resulting princi-pal components. In short, while EFA produce factors, PCA produce components that are independent, and component scores that are uncorrelated.
Exploratory Procedure
Table 1 presents loadings from both an EFA and a PCA. Principal Axis Factoring (SPSS) was the method used for EFA. Estimates of communality, instead of 1’s as in PCA, are in the diagonal of the correlation matrix, and only the variance that each variable shares with other variables in the analysis at hand is factor analyzed.
All columns of Table 1 are sorted in descending order of the statistics – communalities, factor loadings, and com-ponent loadings. The amount of variance accounted for by each factor or component – its eigenvalue – is given by each column sum of squared loadings (Tabachnick & Fidell, 2007). For example, the sum of squares (SS) at the bottom of the table for C1 amounts to 13.22, and for C2 to 2.08. Since PCA considers all the variance (equal to 26, the number of variables), C1 accounts for 50.85% (13.22 / 26 = .5085) of the variance, while C2 accounts for 8% (2.08 / 26 = .08). F1 and F2 account for less than that, since PAF analyzes common variance only.
There are the high loadings on unrotated F1, as well as on unrotated C1. Loadings are correlations between the item and the factor or component. The only item with a correlation lower than .50 is 54 break, with .48 on F1, and .49 on C1. This result suggests that the scale is uni-dimentional. If this is the case, what might the second factor mean? EFA presents nine items with either positive or negative loadings higher than .30, and lower than -.30. Considerations on statistical power are offered by Hair, Black, Babin, Anderson and Tatham (2006) as a guideline for identifying significant factor loadings. They based their proposition on sample size, under the stated objec-tive of obtaining a power level of 80 percent, the use of a .05 significance level, and standard errors twice as higher as those of conventional correlation coefficients. Under these conditions, a factor loading of .30 needs, for significance, a sample size of N = 350 persons (for a .40
factor loading, 200 persons are needed; .50, 120; .60, 85; and for .70, 60 persons). Thus, at N = 767, our calibrating subsample is more than twice the minimum size required for significance of a .30 loading.
Exploratory Factor Analysis
As far as unrotated loadings are concerned, be them from EFA or PCA, we should consider that all items belong to the first dimension. Furthermore, this overall result is one indication that the scale is unidimensional, i.e., it measures only one construct. However, there is a second factor, and certainly there is a second component, which is orthogonal to the first, i.e., independent on the first. Although the same cannot be said of EFA, since it takes into account only the variance items have in common (their communalities), the overall result is practically equivalent – except for the Varimax rotation.
The Varimax orthogonal rotation does achieve a simple structure, as we can see in Table 1. The simple structure presents two factors. Let us keep in F1 the eighteen items from 30 caress down to 05 share. This proceeding coincides to the point, in F2, that items from 44 flexible down to 42 kiss start presenting lower loadings of .29 or less. However, does it make sense, from a psychological perspective, to keep in the same dimension such opposing items as 29 fight (a loading of .77) side by side with 60 happy (a loading of .57)? We believe it does not.
Principal Components and the Circumplex
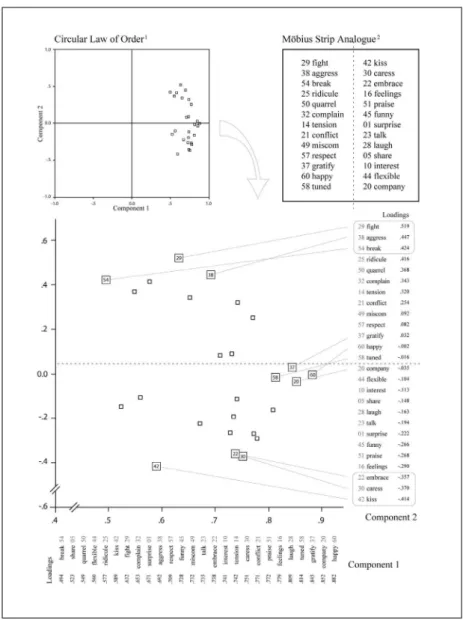
Thus, we decided to keep the PCA results and explore the fact that C1 is orthogonal to C2, i.e., they are inde-pendent. C1 and C2 loadings are again depicted in Fi-gure 1, organized to show distinguishing characteristics of the measurement model data not easily detected by the analyses conducted so far of the first two components, the first component on the X-axis and the second on the Y-axis. The scatter of data points, forming a close-to half circle, suggests a circumplex structure. “Circumplex” is the contraction of the words circular continuum of complexity. Guttman (1954/1955) coined this term when arguing that some human characteristics differing in kind should have an order among them, but not a simple order of complexity, in which there is a ranking from highest to lowest. Then, Guttman asks himself: would it be possible to have an ordering without a head and foot to it? And promptly provided the answer:
P
sic
ol
og
ia
: R
e
fl
e
xã
o e
C
rít
ic
a
, 2
4
(1
), 2
8
-3
9
.
3
2
Table 1
Exploratory Factor Analysis (EFA) and Principal Component Analysis (PCA) of the Perception of Parents as a Couple Scale
EFA1 PCA
Communality Unrotated factor loadings Rotated factor loadings (Varimax) Communality Unrotated factor loadings
(after extraction) F1 F2 F1 F2 (after extraction) C1 C2
60 happy .79 60 happy .88 29 fight .48 30 caress .80 29 fight .77 60 happy .78 60 happy .88 29 fight .52
20 company .72 20 company .85 38 aggress .42 22 embrace .78 38 aggress .76 20 company .73 20 company .85 38 aggress .45
37 gratify .71 37 gratify .84 25 ridicule .35 16 feelings .77 14 tension .70 37 gratify .71 37 gratify .85 54 break .42
30 caress .68 58 tuned .81 54 break .33 51 praise .75 21 conflict .68 30 caress .70 58 tuned .81 25 ridicule .42
16 feelings .67 28 laugh .80 14 tension .30 28 laugh .71 32 complain .64 16 feelings .69 28 laugh .81 50 quarrel .37
28 laugh .66 16 feelings .77 32 complain .30 45 funny .70 25 ridicule .62 28 laugh .68 16 feelings .78 32 complain .34
58 tuned ..65 51 praise .76 50 quarrel .29 60 happy .67 60 happy .57 38 aggress .68 51 praise .77 14 tension .32
22 embrace .64 21 conflict .76 21 conflict .24 20 company .67 50 quarrel .56 22 embrace .67 21 conflict .77 21 conflict .25
51praise .64 30 caress .75 49 miscom .09 42 kiss .66 37 gratify .56 29 fight .67 30 caress .75 49 miscom .09
21 aggress .64 14 tension .73 57 respect .08 23 talk .66 54 break .56 51 praise .66 14 tension .74 57 respect .08
14 conflict .64 22 embrace .73 37 gratify .03 58 tuned .62 49 miscom .53 58 tuned .66 10 interest .74 37 gratify .03
29 fight .62 10 interest .73 60 happy .00 37 gratify .62 20 company .52 21 conflict .66 22 embrace .74 60 happy .00
45 funny .57 23 talk .72 58 tuned -.01 01 surprise .62 58 tuned .51 14 tension .65 23 talk .74 58 tuned -.02
10 talk .55 49 miscom .72 20 company -.03 10 interest .62 57 respect .50 45 funny .60 49 miscom .73 20 company -.03
49 miscom .52 45 funny .72 44 flexible -.07 49 miscom .49 28 laugh .40 23 talk .58 45 funny .73 44 flexible -.10
32 complain .50 57 respect .69 10 interest -.09 57 respect .48 10 interest .39 10 interest .56 57 respect .71 10 interest -.11
57 respect .49 38 aggress .68 05 share -.11 44 flexible .46 23 talk .33 32 complain .54 38 aggress .69 05 share -.15
01 surprise .46 01 surprise .65 28 laugh -.15 05 share .45 51 praise .30 49 miscom .54 01 surprise .67 28 laugh -.16
42 kiss .45 32 complain .64 23 talk -.17 21 conflict .43 44 flexible .29 42 kiss .52 32 complain .65 23 talk -.19
25 ridicule .43 29 fight .62 01 surprise -.18 14 tension .37 16 feelings .28 57 respect .51 29 fight .63 01 surprise -.22
50 quarrel .37 42 kiss .57 45 funny -.23 32 complain .30 45 funny .28 25 ridicule .51 42 kiss .59 45 funny -.27
54 break .33 25 ridicule .56 51 praise -.25 38 aggress .26 01 surprise .28 01 surprise .50 25 ridicule .58 51 praise -.27
44 quarrel .37 44 flexible .54 16 feelings -.28 50 quarrel .22 05 share .24 50 quarrel .44 44 flexible .56 16 feelings -.29
54 break .34 50 quarrel .53 22 embrace -.34 25 ridicule .21 22 embrace .21 54 break .42 50 quarrel .55 22 embrace -.36
44 flexible .29 05 share .50 42 kiss -.35 29 fight .17 30 caress .21 44 flexible .32 05 share .52 30 caress -.37
05 share .26 54 break .48 30 caress -.35 54 break .16 42 kiss .10 05 share .30 54 break .49 42 kiss -.41
Eigenvalue (SS) SS = 12.81 SS = 1.63 SSL = 8.21 SSL = 6.22 Eigenvalue (SS) SS = 13.22 SS = 2.08
Figure 1. Plot of Component 1 and Component 2 Item Loadings of the PPC Scale
Note. (1) Or “law of neighboring”: Guttman (1954/1955). (2) Möbius (1886). The curvilinear plot illustrates the polarity between opposing elements inherent in the circumplex model (Plutchik, 1997).
Turning to Figure 1 again, one can see the items written sideways along the horizontal axis, positioned from low to high loadings on the first component. Similarly, on the vertical, at the right side, from top to bottom, one can see, from high to low loadings, the items on the second component. The first is 29 fight (loading of .519); the last, 42 kiss (loading of -.414). The cross-loading of items can be observed all over Figure 1.
Moreover, the order of the loadings in Component 1 does not make sense regarding meaningful item neigh-borhoods, while in Component 2 it does – items relating to affect are at the extremes, and indifferent items at the middle. In Component 2, there is a discernible semantic affinity among the items, turning the order amenable to theoretical interpretation. The existence of a such an order is postulated by Guttman (1954/1955) to serve as a crite-rion for recognizing a circumplex. For if one variable is
chosen to be a focus, the correlation of this variable with both of its two nearest neighbors should be the highest of the set.
Psicologia: Reflexão e Crítica, 24(1), 28-39.
34
neighbors. In addition, the higher correlation (.808) refers to the neighbor above (GRATIFY), whereas the lower correlation refers to the neighbor below (TUNED), thus preserving the circular order. Among those nine variables, similar conditions occur. This empirical result accounts for a circular order that has neither beginning nor end, as in Guttman’s circumplex.
Figure 1 also features the Möbius Strip Analogue box. The order of the items inside the box reflects the order of the loadings for Component 2. The column on the left side of the box features item 29 fight at the top, down to item 58 tuned. The column on the right side of the box features items 42 kiss at the top, down to 20 company. That column is reversed (i.e., reflected from the horizon-tal dotted line). We thus preserve the convergence of item meaning, going from an emotionally meaningful pola-rization of high-loading affect items, to a meaningless gathering of close-to-zero-loading emotionally indifferent items. Imagine, first, cutting the box with a pair of scissors and then folding the paper at the dotted line. If the item fight is up front, kiss is on the back; if caress is up front, aggress is on the back; and so forth. Now we have a strip that we can glue the ends together twisting one of the ends 180 degrees. When doing so, kiss will be neighbor to tuned, and fight neighbor to company. And there we have the items in a reversing circular law of order, in a nonorientable surface, that is, in a Möbius (1886) strip.
Confirmatory Procedure
Now the elements are at hand to investigate differences in covariance, to test measurement models in confirma-tory factor analyses (CFA). Up to this point, we had a set of variables and we wanted to know how many factors or components were needed to account for the correlations among them, and what they were measuring. Contrasting to the exploratory phase, in CFA we start by defining the latent variables we would like to measure. As Jöreskog (2007) explains, with CFA no eigenvalues and eigen-vectors are involved, the solution is obtained in one step, and no factor rotation is needed. CFA shifts the focus from EFA’s factor extraction and rotation to the problem of testing a specified model.
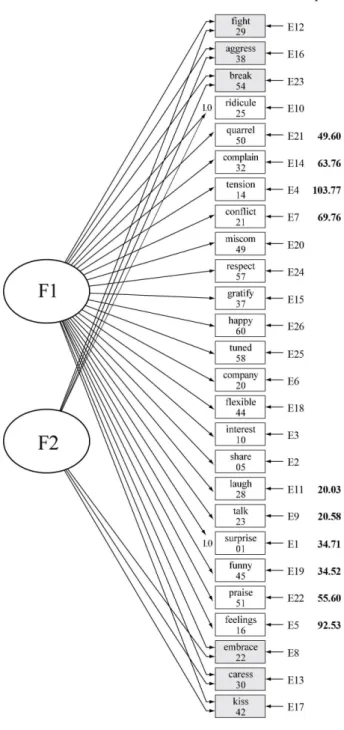
Figure 2 presents a confirmatory factor analysis (CFA) for Measurement Model B (MMB). MMB was run by EQS (Bentler, 2006) using the calibrating sample data (N = 767). MMB replicates exactly the higher and lower portions of the classification of item loadings on Com-ponent 2 in Figure 1. The three highest loadings are 29 fight, 38 aggress, and 54 break, reading them top-down. By their position in the amplified plot of Component 1 and Component 2 loadings, we can see that these items load relatively low on Component 1 (.632, .692, and .494, respectively), as can be seen along the horizontal axis. These items are seen as reflected on the lowest three items on Component 2, at the bottom of the vertical column showing Component 2 loadings: 42 kiss, 30 caress, and 22 embrace, reading them bottom-up.
Figure 2. Confirmatory Factor Analysis (CFA) Measurement Model B
Note. Confirmatory factor analysis run by EQS (Bentler, 2006) on calibrating subsample (N = 767). Measurement indicator weights fixed at 1.0 by EQS (with program notation between parentheses): surprise 01 (1F1+E1) and ridicule 25 (1F2+F1+E10). Comparative Fit Index, CFI = .899. Root Mean Square Error of Approximation, RMSEA = .073, 90% Confidence Interval [.069, .076]. Chi-square values refer to specification search results.
bottom-up, items from 20 company (loading or correlation with Component 2, -.035) through 37 gratify (loading or correlation with Component 2, .032), would practically
be eliminated, because whatever scores persons have on these items would be multiplied by these close-to-zero coefficients.
Table 2
Goodness of Fit Statistics and Specification Search for Confirmatory Factor Analysis (CFA) Measurement Models (Model A, Model B, and Model C)
A) Goodness of fit statistics for the calibrating subsample, N = 767
Measurement Method = Maximum Likelihood Method = Robust Model
Chi-square df CFI SRMR RMSEA 90% CI CFI RMSEA 90% CI
One-factor, Model A 2563.28 299 .838 .067 .099 [.096, .103] .861 .084 [.081, .088]
Two-factor, Model B 1950.93 293 .881 .061 .086 [.082, .090] .899 .073 [.069, .076]
Two-factor, Model C 1251.15 282 .931 .037 .067 [.063, .071] .942 .056 [.052, .060]
B) Goodness of fit statistics for the testing subsample, N = 762
Measurement Method = Maximum Likelihood Method = Robust Model
Chi-square df CFI SRMR RMSEA 90% CI CFI RMSEA 90% CI
Two-factor, Model C 1234.22 282 .935 .033 .067 [.063, .070] .947 .057 [.053, .060]
C) Multivariate Lagrange Multiplier (LM) test for adding parameters
Specification search for Model B fit improvement
Cumulative multivariate statistics Increment
Step Parameter Chi-square df Chi-square df
1 14 tension, *F2 103.77 1 103.77 293
2 16 feelings, *F2 196.30 2 92.53 292
3 21 conflict, *F2 266.06 3 69.76 29
4 32 complain, *F2 329.82 4 63.76 290
5 51 praise, *F2 385.43 5 55.60 289
6 50 quarrel, *F2 435.03 6 49.60 288
7 01 surprise, *F2 469.74 7 34.71 287
8 45 funny, *F2 504.26 8 34.52 286
9 28 laugh, *F2 524.29 9 20.03 285
10 23 talk, *F2 544.87 10 20.58 284
11 F2, F1 558.86 11 13.99 283
12 57 respect, F2 569.92 12 11.06 282
Specification search for Model C fit improvement
Cumulative multivariate statistics Increment
Step Parameter Chi-square df Chi-square df
1 57 respect, F2 16.87 1 16.87 282
2 10 interest, F2 24.22 2 7.34 281
3 05 share, F2 30.73 3 6.52 280
Psicologia: Reflexão e Crítica, 24(1), 28-39.
36
Table 2 shows the results of fit indices for three models. The first, Model A (MMA), tests the fit of a unidimensio-nal, one-factor scale. Two methods of estimation were chosen, maximum likelihood and robust. Indices were not satisfactory, with Comparative Fit Index, CFI = .861, and Root Mean Square Error of Approximation, RMSEA = .084 (method, robust), and Standardized Root Mean-Square Residual, SRMR = .067 (method, maximum likelihood). In reporting on model-fitting results, Byrne (2005) recommend that researchers specify the chi-square value followed by its degrees of freedom, and then report the goodness-of-fit statistics CFI, SRMR, and RMSEA together with its 90% CI (Byrne, 2005). Indicators of a well-fitting model would be evidenced, says Byrne (2005), from a CFI value equal to or greater than .93, a SRMR value equal to or greater than .08, and a RMSEA value of less than .05. However, Browne and Cudeck asserts that a value of .05 or less of the RMSEA would indicate close fit, but they are “. . . also of the opinion that a value of about 0.08 or less for the RMSEA would indicate a reasonable error of approximation” (1993, p. 144).
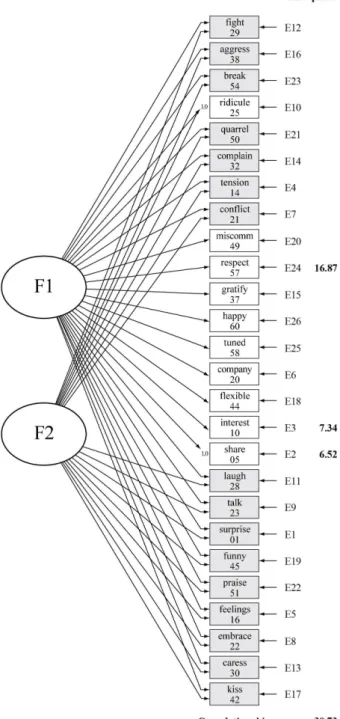
We believe that these considerations about fit indices are enough for establishing a subjective judgment about how well our “final” proposed Measurement Model C (MMC) performs in the test of fitting to the validating subsample data. This is shown in Figure 3, which depicts MMC run by EQS (Bentler, 2006). With RMSEA at .056, and remaining indices presenting reasonable results, we conclude that the fitting indices turn out as favorable overall evidence to the theoretical model under discussion. Now let us return to Table 2 and comment on its item C, the multivariate Lagrange Multiplier test for adding parameters. In running Measurement Model B (MMB), we asked for specification search for Model B fit improvement. EQS delivered chi-square values indicate that item 14 tension should also be included in both factors F1 and F2. If so, there would be a chi-square drop of 103.77, representing the main source for improving model fit. Since it also coincides to being more meaningful according to our theoretical proposition, it was done when setting-up Measurement Model C. After the first, the next step that improves fit the most is to make indicator 16 feelings cross-load on both factors, with a 92.53 drop in chi-square. And so forth, going from item 14 tension, with a 103.77 chi-square drop, all the way down to a chi-square drop of 20.58 for the 23 talk item.
These chi-square figures were repeated in Figure 2, on the right side, next to their respective indicators. Exami-ning the chi-square statistics magnitudes produced by the multivariate Lagrange Multiplier (LM) test for adding parameters by simultaneous process in the specification search presented in Table 2 (part C), we can see that the order from highest to lowest there corresponds to the order observed in the Component 2 loadings in the rightmost column at Table 1, as well as in the vertical column at the right side of Figure 1. These chi-square values are also reproduced in the right vertical side of Figure 2. Following
Figure 3. Confirmatory Factor Analysis (CFA) Measurement Model C
Note. Confirmatory factor analysis Model C run by EQS (Bentler, 2006) on validating subsample (N = 762). Comparative Fit Index, CFI = .947. Root Mean Square Error of Appro-ximation, RMSEA = .057. 90% Confidence Interval of RMSEA, CI [.053, .060]. Method = robust. When first run on the calibrating subsample (N = 767): CFI = 942. Root Mean Square Error of Approximation, RMSEA = .056. 90% Confidence Interval of RMSEA, CI [.052, .060]. Method = robust. Measurement indicator weights fixed at 1.0 by EQS: share 05 (1F1+E11) and ridicule 25 (1F2+F1+E10).
We can see, then, that the order of decreasing chi-square values of the LM test actually converge to positions at the center of the listing of loadings, where there is a reversal – of loading magnitude and direction, as well as of item semantic similarity. The reversing property of the nonorientable Möbius strip becomes a functional analo-gue as far as it models that empirical reversal. Hence, in addition to model fit per se, the breaking down of the multivariate LM test into a series of incremental univa-riate tests, a method “unique to EQS” (Bentler, 2006, p. 162), made it possible not only to test for Guttman’s law of neighboring, but also to propose the Möbius strip for modeling our kind of data. But why, theoretically, specific response covariances compelled specific items to be neighbors in loading magnitude?
The items relating to affect are most responsible for the effect we have been discussing. Let us consider kiss, caress, and embrace as indicators of “love”, and consider fight, aggress, and break as indicators of “hate”. Accor-ding to Freud (1915/1999a), the transformation of an instinct in its material contrary (die Verwandlung eines Triebes in sein (materielles) Gegenteil) is only observed in one instance (wird nur in einem Falle beobachtet) – the transposition of love into hate (bei der Umsetzung von Liebe in Hass). Content reversal (inhaltliche Verkehrung) one finds in the unique case (findet sich in dem einen Falle) of the transformation of love into hate (der Verwandlung des Liebens in ein Hassen). Thus indicators of positive and negative affect, taken eihter as contraries or as opposing poles in the same continuum, may find a promising theoretical niche to be studied in future.
Conclusion
We conclude that our previously stated objective, to establish an instrument that is sensible enough to detect meaningful signs of how subjects are recollecting their parents’ marital relations, was achieved. In the research setting, these signs are useful to identify how perception of parents as a couple influences how sons and daughters currently conceive the marital link in their lives. Moreo-ver, they may be also useful in the clinical endeavor of helping people to better cope with their psychic inhe-ritance. Components and factors are now meaningfully interpretable, and component scores can identify which people most contribute to which factor. This is one of our research prospects.
The kind of data generated by the Perception of Parents as a Couple measurement model have distinguishing characteristics. These characteristics would not be de-tected had we taken for granted the exploratory factor analysis orthogonal rotation result, which actually achie-ved simple structure, albeit meaningless to our theoretical underlying assumptions. For there is no simple way for people to cope with their psychic inheritance. A person memory, when recollecting data on parents, may well
leave the explicit memory domain, and enter into the implicit memory realm. We propose the word “explicit” to name the role items play in the first factor or component, and the word “implicit” to name the role the same items play in the second factor. For decades now there have been studies on implicit memory, with extension to the explicit-implicit distinction into the domains of percep-tion, learning, and thought. According to Kihlstrom (2008), this literature describes the cognitive unconscious (Kihlstrom, 1987, 1999). Further research may well contrast to the cognitive unconscious theoretical orien-tation, and the generational psychic transmission concepts of intersubjectivity and unconscious alliances (Kaës, 1993/2003, 2007, 2009). In so doing, we could explore which theoretical standpoint better explain our results bearing on the question of how people covariation in answers to items related to affect can play two different roles in the same instrument.
References
Bauman, Z. (2003). Liquid love: On the frailty of human bonds. Cambridge, UK: Polity Press.
Bentler, P. M. (2006). EQS 6 Structural Equations Program Manual. Encino, CA: Multivariate Software.
Browne, M. W., & Cudeck, R. (1993). Alternative ways of assessing model fit. In K. A. Bollen & J. S. Long (Eds.), Testing structural equation models (pp. 136-192). Newbury Park, CA: Sage.
Byrne, B. M. (2005). Factor analytic models: Viewing the structure of an assessment instrument from three perspectives. Journal of Personality Assessment, 85, 17-32.
Enriques, C. R., Féres-Carneiro, T., & Magalhães, A. S. (2006). Trabalho e família: O prolongamento da convivência fami-liar em questão. Paidéia, 16, 327-336.
Féres-Carneiro, T., Seixas, A., & Ziviani, C. (2006). Conyuga-lidad de los padres y proyectos de vida de los hijos frente al matrimonio [Sons and daughters’ plans of marriage and their parent’s marital relationship]. Cultura y Educación, 18, 95-108.
Fowers, B. J., & Olson, D. H. (1989). ENRICH Marital Inven-tory: A discriminant validity and cross-validity assessment. Journal of Marital and Family Therapy, 15, 65-79. Freud, S. (1999a). Triebe und Triebschicksale [Instinct and their
vicissitudes]. In S. Freud, Gesammelte Werke X [Complete Works X] (pp. 210-232). Frankfurt, Germany: Fischer. (Ori-ginal work published 1915)
Freud, S. (1999b). Zur Einführung des Narzissmus [Introduction to narcissism]. In S. Freud, Gesammelte Werke X [Complete Works X] (pp. 137-170). Frankfurt, Germany: Fischer. (Ori-ginal work published 1914)
Graham, J. W. (2009). Missing data analysis: Making it work in the real world. Annual Review of Psychology, 60, 549-576.
Guttman, L. (1955). A new approach to factor analysis: The radex. In P. Lazarsfeld (Ed.), Mathematical thinking in the social sciences (2nd Rev. Ed., pp. 258-348). Glencoe, IL: The Free Press. (Original work published 1954)
Psicologia: Reflexão e Crítica, 24(1), 28-39.
38
Jolliffe, I. T. (2004). Principal component analysis (2nd ed.). New York: Springer.
Jöreskog, K. G. (1993). Testing structural equation models. In K. A. Bollen & J. S. Long (Eds.), Testing structural equation models (pp. 294-316). Newbury Park, CA: Sage.
Jöreskog, K. G. (2007). Factor analysis and its extensions. In R. Cudeck & R. C. MacCallum (Eds.), Factor analysis at 100: Historical developments and future directions (pp. 47-77). Mahwah, NJ: Lawrence Erlbaum.
Kaës, R. (2003). Introduction au concept de transmission psy-chique dans la pensée de Freud [Introduction to the concept of psychic transmission in the thinking of Freud]. In R. Kaës, H. Faimberg, M. Enriquez, & J.-J. Baranes (Eds.), Trans-mission de la vie psychique entre generations [Transmission of psychic life between generations] (pp. 17-58). Paris: Dunod. (Original work published 1993)
Kaës, R. (2007). Linking, alliances, and shared space: Groups and the psychoanalyst (A. Weller, Trans.). London: The International Psychoanalytical Association.
Kaës, R. (2009). Les alliances inconscientes [Unconcious alliances]. Paris: Dunod.
Kihlstrom, J. F. (1987). The cognitive unconscious. Science, 237, 1445-1452.
Kihlstrom, J. F. (1999). Conscious versus unconscious cog-nition. In R. J. Sternberg (Ed.), The nature of cognition (pp. 173-203). Cambridge, MA: The MIT Press.
Kihlstrom, J. F. (2008). The psychological unconscious. In O. P. John, R. W. Robins, & L. A. Pervin (Eds.), Handbook of personality: Theory and research (pp. 583-602). New York: Guilford Press.
Melchert, T. P. (1998). A review of instruments for assessing family history. Clinical Psychology Review, 18, 163-187. Melchert, T. P., & Sayger, T. V. (1998). The development of an
instrument for measuring memories of family of origin characteristics. Educational and Psychological Measurement, 58, 99-118.
Möbius, A. F. (1886). Zur Theorie der Polyëder und der Elementarverwandtschaft. In F. Klein (Ed.), Gesammelte Werke: Vol. 2 (pp. 519-559). Leipzig, Germany: Verlag von S. Hirzel.
Olson, D. H., & Fowers, B. J. (1993). Five types of marriage: An empirical typology based on ENRICH. The Family Journal, 3, 196-207.
Plutchik, R. (1997). The circumplex as a general model of the structure of emotions and personality. In R. Plutchick & H. R. Conte (Eds.), Circumplex models of personality and emotions (pp. 103-132). Washington, DC: American Psy-chological Association.
Ramos, E. (2003). Âge et places dans la cohabitation inter-générationnelle [Age and places in the intergenerational cohabitation]. Agora, 33, 98-108.
Raykov, T., & Marcoulides, G. A. (2008). An introduction to applied multivariate analysis. New York: Routledge. Tabachnick, B. G., & Fidell, L. S. (2007). Using multivariate
statistics. Boston, MA: Allyn & Bacon.
3 9 n i, C ., F é re s-C a rn e iro , T. & M a g a lh ã e s, A . S . (2 0 1 1 ). S on s a n d D a u g h te rs ’ P e rc e p tion of P a re n ts a s a C ou p le : D is tin g u is h in g ra ct e ris tic
s of a
M e a su re m e n t M od e l.
Item Correlation Matrix of the Calibration Subsample, N = 767
1 5 10 14 16 20 21 22 23 25 28 29 30 32 37 38 42 44 45 49 50 51 54 57 58 60
λ
1 1 353 526 437 587 563 472 544 457 285 504 298 554 385 529 350 467 405 467 428 344 548 253 434 546 565 13213
5 353 1 459 315 407 499 355 370 389 268 389 233 383 227 425 296 275 369 376 311 225 411 237 351 418 422 2081
10 526 459 1 493 580 658 527 526 586 336 565 395 536 402 641 437 369 424 549 524 329 568 354 504 590 646 988
14 437 315 493 1 486 609 681 421 487 507 550 611 433 586 621 597 335 369 442 567 489 484 417 487 577 654 880
16 587 407 580 486 1 668 516 699 570 368 625 363 715 420 648 427 572 419 565 490 332 677 292 491 596 673 796
20 563 499 658 609 668 1 642 591 643 468 659 482 606 527 754 541 447 430 607 620 421 635 385 561 703 796 733
21 472 355 527 681 516 642 1 466 512 475 573 600 473 568 652 580 332 351 490 612 498 506 387 525 638 687 612
22 544 370 526 421 699 591 466 1 594 321 645 319 726 398 555 406 656 360 582 473 311 625 285 446 539 606 564
23 457 389 586 487 570 643 512 594 1 362 669 366 545 370 592 391 433 362 618 510 265 572 326 500 593 650 525
25 285 268 336 507 368 468 475 321 362 1 409 539 299 433 470 583 253 288 304 424 370 333 459 393 430 460 493
28 504 389 565 550 625 659 573 645 669 409 1 464 641 475 656 481 496 418 707 570 327 662 317 560 659 696 467
29 298 233 395 611 363 482 600 319 366 539 464 1 302 532 534 620 209 324 353 479 443 367 542 439 454 519 441
30 554 383 536 433 715 606 473 726 545 299 641 302 1 406 617 405 631 422 583 493 336 673 240 462 563 631 429
32 385 227 402 586 420 527 568 398 370 433 475 532 406 1 519 607 302 285 357 507 500 401 328 462 506 557 391
37 529 425 641 621 648 754 652 555 592 470 656 534 617 519 1 539 436 460 568 622 462 619 420 564 686 808 384
38 350 296 437 597 427 541 580 406 391 583 481 620 405 607 539 1 285 322 393 488 519 434 519 549 531 571 365
42 467 275 369 335 572 447 332 656 433 253 496 209 631 302 436 285 1 314 468 376 233 559 163 331 422 463 340
44 405 369 424 369 419 430 351 360 362 288 418 324 422 285 460 322 314 1 435 392 228 449 238 493 425 443 327
45 467 376 549 442 565 607 490 582 618 304 707 353 583 357 568 393 468 435 1 516 273 608 263 480 593 647 299
49 428 311 524 567 490 620 612 473 510 424 570 479 493 507 622 488 376 392 516 1 419 503 264 545 572 664 289
50 344 225 329 489 332 421 498 311 265 370 327 443 336 500 462 519 233 228 273 419 1 383 340 373 429 444 281
51 548 411 568 484 677 635 506 625 572 333 662 367 673 401 619 434 559 449 608 503 383 1 292 509 615 638 268
54 253 237 354 417 292 385 387 285 326 459 317 542 240 328 420 519 163 238 263 264 340 292 1 345 331 405 242
57 434 351 504 487 491 561 525 446 500 393 560 439 462 462 564 549 331 493 480 545 373 509 345 1 616 610 228
58 546 418 590 577 596 703 638 539 593 430 659 454 563 506 686 531 422 425 593 572 429 615 331 616 1 783 213
60 565 422 646 654 673 796 687 606 650 460 696 519 631 557 808 571 463 443 647 664 444 638 405 610 783 1 149 25998
SD 1080 1308 1191 1152 1187 1205 1297 1311 1074 975 1122 1155 1227 1097 1255 1164 1338 1001 1141 1222 1287 1137 1036 1155 1183 1230
26
M 2730 3550 3690 3600 3380 3810 3530 3570 4000 4390 3740 3720 3280 3350 3570 3850 2980 2900 3530 3510 3300 3100 4510 3420 3430 3720
Note. Abbreviations: SD = standard deviations, M = means, λ = eigenvalues. Table entries are multiplied by 100, except the 1’s in the main diagonal, and the rounded up eigenvalue sum (25.998 = 26).
Cells with border signalize the “law of neighboring” exemplary correlations discussed in the Principal Components and the Circumplex subsection.