CuI Film Produced by Chemical Extraction Method in Diferent Media
Ishak Afşin Karipera*
Received: January 26, 2016; Revised: May 12, 2016; Accepted: June 25, 2016
CuI crystalline thin ilms were produced on substrates (commercial glass) using chemical extraction method in diferent chemical bath media. In this study, their structural, optical and electrical properties were analyzed. Transmittance, absorption, optical band gap and refractive index of the ilms were examined by UV/VIS spectrum. XRD data showed that the ilm has a hexagonal structure for CuI. Surface and elemental (in terms of ratio) analysis of the ilms were performed via SEM and EDX analysis. The highest average grain size of CuI was observed for the ilm produced in aqueous media whereas the lowest average grain size was seen in chloroform bath. The curve formed by the number of crystallites per unit area (N) is diferent than the curves of dislocation density and average grain size. Number of crystallites per unit area has reached its maximum value in CCl4 bath, but it has been decreased in chloroform bath. In addition, ilm thickness has varied between 1232 nm and 3624 nm according to the solvent of bath.
Keywords: CuI ilms, Chrystal growth, Thin ilm, Optical properties
* e-mail: [email protected]
1. Introduction
Copper iodine is a metal halide such as AgI, PbI2,
etc… Similar to AgI, Copper iodine has three crystalline phases α, β, γ1-4. In α-phase, CuI has a cubic structure and it is conductive because of copper ions1. In β-phase, it has
a hexagonal structure and ionic conductivity is observed, whereas in γ-phase, cubic structure with p-type semiconducting has been observed. These phases change with temperature; in the literature it has been stated that CuI is at α-phase up to 392o C, whereas it switches to the γ-phase at below 350o C. CuI shows P-type semi conductivity depending on the excess iodine in its structure and the band gap was determined as 3.1 eV2-4.
Copper iodine thin ilms are used in photovoltaic cells, cathodic dye-sensitization and electrolytic methods5-7.
Researchers have worked on copper iodine by using diferent methods, both chemical (in water and ethanol) and physical8-10.
But nobody has investigated CuI thin ilms produced via chemical extraction method up to now, so we are unaware of how the bath conditions will impact CuI ilm structure, as well as its optical and electrical properties. Producing CuI thin ilm via chemical bath deposition is quite diicult, because copper ions are reduced by iodine, consequently contamination of iodine decreases with the formation of copper iodine.
The aim of this paper is to produce CuI thin ilm via chemical extraction method and examine its structural and optical properties. In this study, we attempted to show that optical and structural properties of CuI could be controlled by changing the media in which CuI ilms are produced. Since no one has worked on CuI thin ilm produced via chemical extraction method, we were unaware of how diferent bath environment might afect CuI ilm structure and its optical properties.
2. Experimental
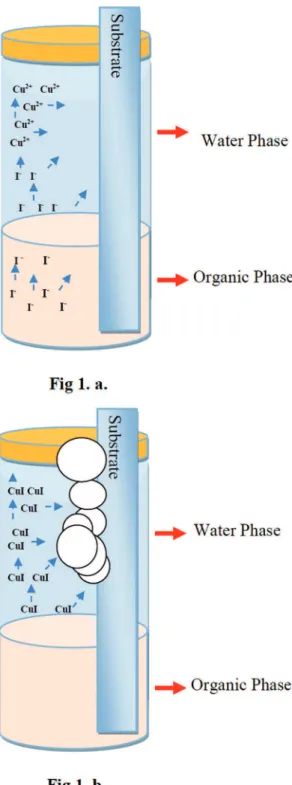
The components of bath were 1 % (w/v) nitric acid, 0.005 M copper nitrate hemi hydrate and 0.015 M potassium iodide. First, 100 mL 0.015 M potassium iodide was prepared as a stock solution using diferent solvents, namely water, ethanol, CCl4 and chloroform; then 0.005 M copper ion stock solution was prepared. 10 ml 0.005 M copper nitrate hemi hydrate and 10 ml 0.015 M potassium iodide (each time prepared with diferent solvents) were put in the beakers. Iodide solutions used in chemical baths were prepared with diferent solvents. The deposition temperature of chemical baths was 50°C and the deposition time was 4 hours. After taking the ilms out of the bath, each of them was washed with the solvent forming the base of the iodine solution, in order to get rid of iodine ions that might have been adhered to the surface. Figure 1a shows the production of the ilms
surface properties of the ilms were examined by using an EVO40-LEO computer controlled digital scanning electron microscope (SEM). Film thicknesses were measured with a Veeco Multi Mode AFM (Controller=NanoScope 3D). Thicknesses were measured in a 10x10 μm area with tapping mode. The optical measurements were performed by Hach Lange DR 5000 Spectrophotometer at room temperature by placing an uncoated identical commercial glass substrate to the reference beam. The optical spectrum of thin ilms was recorded at the range of 300-1100 nm wavelength.
3. Results and Discussion
The chemical reactions regarding the deposition of copper iodine ilms, which occurred in the bath, are shown below. Copper ions (Cu+2) are combined with iodine (I-) in
order to form the insoluble CuIin the bath.
Figure 1: Chemical Extraction Method and Chemical Bath Deposition
via Chemical Extraction Method with organic solvents whereas Figure 1b shows chemical extraction deposition resulted after this process.
The crystalline structure of CuI was conirmed by X-ray difraction (XRD) with a CuKα1 radiation source
(Rikagu RadB model, λ=1.5406 Å) over the range 10o <2θ<90o at a speed of 3o min-1 with a step size of 0.02o. The
(
)
( )
H O
3 ++
I
-H O
2+
HI
in water
1
( )
Cu
3
I
CuI
( )kI
( )s2
2
2
+
+
+
-The production of copper iodine was not similar to producing other metal halides, because, the solid iodide formed in the bath was giving a dark red color to the solution. Then, iodide should be separated from copper iodine thin ilm and should be puriied. Accordingly, Iodine ions adhered to the surface of CuI has been removed and the amount of iodine ions was reduced. Thus, performing the production in aqueous media may not always be the right way for thin ilms where a very good puriication is required, of course without damaging the ilm. We didn’t even need to do it because excess iodine was not seen much in chloroform, carbon tetra chloride, and ethanol media. Iodine passes to aqueous media before the equilibrium is established. The main problem was that these solvents might also remove copper iodine thin ilm from the substrate. Thus, we should decide about which solvent is correct. In other words, the quality of CuI ilms depends on the media of chemical bath.
XRD patterns of CuI ilms deposited via CBD in diferent bath media are presented in Figure 2 and hkl values are presented in Table 1. Structural properties were calculated by Scherrer formula with the following variables; grain size (D), dislocation density (δ), and number of crystallites per unit area (N). Lattice parameters along (220), (102), (200), (103) plane were calculated by using the formulas given below11-15:
.
( )
cos
D
B
0 9
3
i
m
=
( )
D
1
4
2
( ) d
a
h hk l
cl Hexagonal Structure 3 4 1 5 2 2 2 2 2 2 = + + +
] g ^ h
( )
N
D
t
6
3=
Figure 2: XRD patterns of CuI thin ilms formed in diferent media
of chemical bath (a) water, (b) ethanol, (c) chloroform, (d) carbon tetrachloride
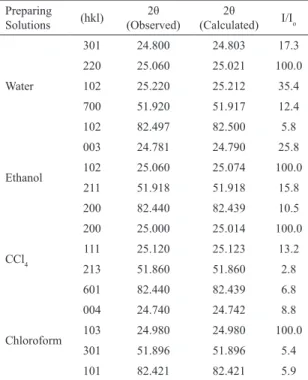
Table 1: XRD patterns of CuI thin ilms formed in diferent
chemical bath media. Preparing
Solutions (hkl) (Observed)2θ (Calculated)2θ I/Io
Water
301 24.800 24.803 17.3
220 25.060 25.021 100.0
102 25.220 25.212 35.4
700 51.920 51.917 12.4
102 82.497 82.500 5.8
Ethanol
003 24.781 24.790 25.8
102 25.060 25.074 100.0
211 51.918 51.918 15.8
200 82.440 82.439 10.5
CCl4
200 25.000 25.014 100.0
111 25.120 25.123 13.2
213 51.860 51.860 2.8
601 82.440 82.439 6.8
Chloroform
004 24.740 24.742 8.8
103 24.980 24.980 100.0
301 51.896 51.896 5.4
101 82.421 82.421 5.9
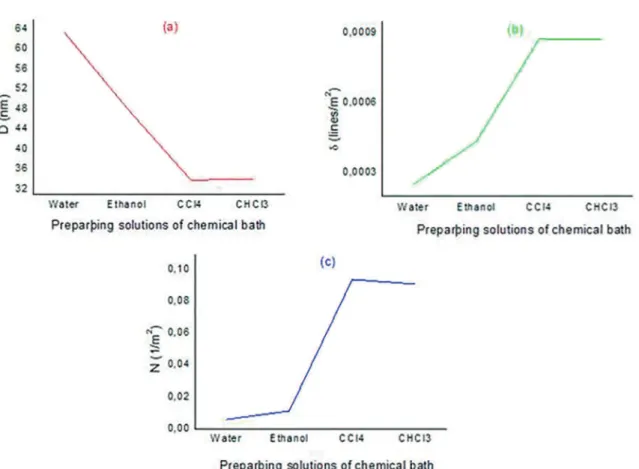
Where t is ilm thickness, λ is wavelength of X-ray used (1.5406 Å), β is FWHM of the peak, θ is Bragg angle, δ is dislocation density which is deined as the length of dislocation lines per unit volume of the crystal, N is number of crystallites per unit area. Higher N value indicates an abundance of crystallization. Average grain size of CuI has varied according to the media of the bath. The change of dislocation density and number of crystallites per unit area for each bath media are displayed in Figure 3.
Maximum peaks of the ilms with γ-CuI structure, were observed at 24-25 2θ degree. Z. Zheng et al. produced CuI thin ilms via sonochemical method and they observed maximum peaks at 43.12-50.32 (θ) degree. They also observed peaks at 25.16-42.02 (θ) degree. K. Tennakone et al. also produced CuI ilms in aqueous media, on glass substrates. The ilm that they have produced had γ-CuI structure and they identiied maximum peaks at 25.563 (θ) degrees8. In fact, all our peaks
are compatible with ASTM data iles; their structures could be easily elucidated by indexing via XRD EVA program. Actually, it is not possible to ind CuI ilms produced via chemical extraction method, on amorphous glasses with so obvious and clearly marked XRD peaks in the literature.
We even didn’t need to clean the raw data that we have received from EVA program16. Of course, there is a diference
between these degrees and the ones in the literature, which occurred because of diferent crystalline orientations formed due to diferent production methods. But, these values are not very big; these are the deviations acceptable by the international literature. These results were in agreement with the literature.
The highest and sharpest peaks were observed in water and ethanol, and presented in Figure 1. Hexagonal structure was seen in all CuI thin ilms. The biggest average grain size of CuI was observed in the ilm formed in the water bath, as 64 nm while the smallest was observed as 33 nm in the ilm from the chloroform bath. This is because the solubility of Cu2+ and I- ions is lower in water and alcohol, compared
Figure 3: Average crystallite size (a), dislocation density (b), and number of crystallites per unit area (c) of CuI produced in diferent
chemical bath media.
This result showed that the ilm thickness has been increased in chloroform bath. Regarding the utilization of carbon tetra chloride and chloroform, since they are immiscible with water, copper ions stayed in the water whereas iodide ions stayed in the solvent. This fact let us relect if the ilm can be produced on the surface via the extraction process, a method very well-known by chemists. Although copper ions cannot pass into carbon tetra chloride and chloroform media, the transition of iodine to another media, such as water or ethanol, is possible. So, we took iodine from the other solvents, and we performed a very diferent extraction process in the aqueous media enriched by CuI. Chloroform has a polar structure, whereas the structure of carbon tetra chloride is apolar. Thus, iodide ions in the chloroform pass to aqueous media better than iodide ions in carbon tetra chloride. Therefore, because of the increased concentration of iodine in the water, CuI precipitation has been formed. While the ilm is formed on the substrate’s surface, the amount of CuI in the water decreases and a portion of it formed a precipitate. In this event, the increase of the amount of iodine in the aqueous media will afect the ilm thickness depending on the extraction process. This efect is shown in Figure 4. However, since the whole substrate would not be
Figure 4: Film thickness of CuI thin ilms.
covered with the ilm, we had to cut a part of the substrate (the part stayed in the other solvent). But still, about half of the substrate was covered with the ilm.
The transmittance (T) for CuI thin ilm can be calculated by using relectivity (R) and absorbance (A) spectra from the expression16:
( )
T
=
]
1
-
R e
g
2 -A7
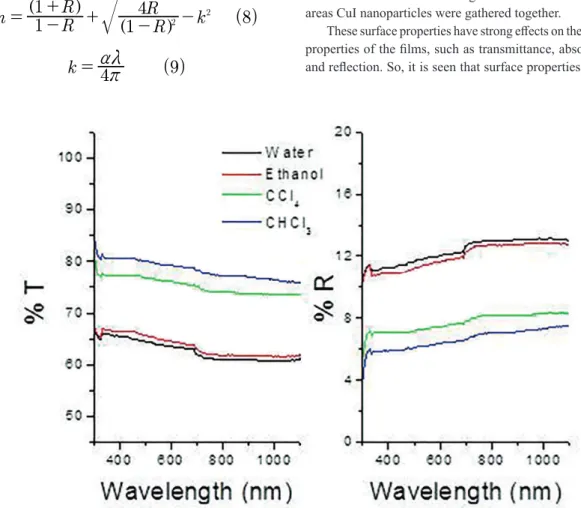
baths were prepared with diferent solvents. Therefore, transmissions of the ilms produced in diferent media have varied. Transmission of the ilm produced in chloroform bath was the highest whereas the one produced in water bath was the lowest. As mentioned above, the formation of smaller particles in chloroform media causes the ilms produced in this media to absorb the light less. The transmission of the materials, which absorb light less, is lower. As expected, relectivity curves of CuI thin ilms were just opposite of the transmittance curves. Optical transmission of the ilm produced in water bath was 63 %, whereas optical transmission of the ilm produced in chloroform bath was 79 % (550 nm wavelengths). Relectivity of the ilm produced in water bath was 12 %, whereas relectivity of the ilm produced in chloroform bath was 6 % (550 nm wavelengths). Transmission increased with ilm thickness whereas relection decreased with it.
Y. Yan et al. produced CuI via spraying method. They produced CuI having 35 nm grain sizes, with 65 % transmittance17. The results of the ilms obtained from
chloroform and carbon tetra chloride baths were in accordance with the literature regarding grain size and transmittance.
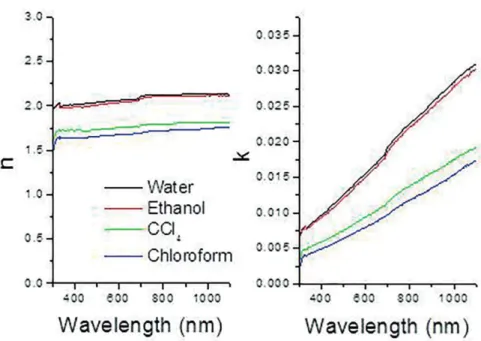
Refractive index and extinction coeicient of the ilms are given by the following formulas16:
Figure 5: Transmittance (T) and relectivity (R) of CuI thin ilms produced in diferent media.
Refractive index and extinction coeicient of CuI thin ilms are shown in Figure 6. Refractive index were 2.05, 2.02, 1.74 and 1.66, for the ilms produced in water, ethanol, carbon tetra chloride and chloroform solutions, and it is displayed in Figure 5 (550 nm wavelength). Similarly, the refractive index of the ilm produced in the chloroform bath, in which particle size was comparably smaller than the others, is lower. On the other hand, extinction coeicient behaved as refractive index and took values 0.014, 0,013, 0.008 and 0.007, for the ilms produced in the baths prepared with water, ethanol, carbon tetra chloride and chloroform, respectively (550 nm wavelength). Refractive index and extinction coeicient of CuI thin ilms were directly proportional to ilm thickness.
Scanning electron microscopy (SEM) was used to examine the efect of the bath media on the properties of ilm surface, as the surface properties directly afected electrical and optical properties of the ilms. SEM images of CuI thin ilms produced in diferent baths are presented in Figure 7. SEM analysis provided more accurate information about grain structure. As can be seen in Figure 7a–d, the size of crystallites is smaller for the ilms produced in chloroform and carbon tetra chloride solutions. The biggest grains were observed for the ilm produced in water bath. All ilms had insular structure (island) and had strong adherence to substrates. It can be seen in Figure 7b and 7c that in some areas CuI nanoparticles were gathered together.
These surface properties have strong efects on the optical properties of the ilms, such as transmittance, absorbance and relection. So, it is seen that surface properties of CuI
( )
n
R
R
R
R
k
1
1
1
4
28
2
=
]
-
+
g
+
]
-
g
-( )
k
4
r
9
am
Figure 6: Refractive index (n) and extinction coeicient (k) of CuI thin ilms produced in diferent media.
Figure 7: SEM images of CuI thin ilms.
ilms were in line with their optical properties. The lowest transmittance, the highest refractive index, and regular grain structure of CuI thin ilms were observed in the ilms
produced in water and ethanol baths9. Kosta et al. have also identiied pebble structure for CuI18. The quality of the ilms
easy and cheap method is similar to the quality of the ones that Kosta et al. have produced through electrochemical method on a crystalline structure; a similar type of surface can be seen in Figure 7a. Grundman et al, who showed that they have produced the most regular structure through SEM images, have captured particle structures similar to triangular prism, as can be seen in our SEM images19. Bu all these researchers have attempted to growth crystalline ilm on crystal substrates using devices.
The EDX technique was used to estimate the composition of CuIthin ilms. Figure 8 shows the average elemental molar ratio of Cu/I as a factor of chemical bath solvents. It was seen that Cu/I ratio has been changed with chemical bath’s solution. EDX results indicate that the average elemental molar ratio of Cu/I was nearly equal to its stoichiometric ratio in the ethanol solution (elemental molar ratio of Cu/I = 0.458 and elemental ratio of Cu/I 29.06% / 70.94% = 0.409). The theoretical elemental molar ratio of Cu/I is 0.459 and elemental ratio of Cu is 29.16% and I is 70.84%. The EDX results are in line with XRD and SEM measurements. Since the solubility of iodine and CuI is higher in chloroform and carbon tetra chloride, Cu2+ ions were stuck to the surface
of the substrate with the ilm because of the incarceration mechanism.
Figure 8: EDX analysis of CuI thin ilms produced in diferent media.
4. Conclusion
CuI thin ilm attracted the attention of the researchers because of its ionic conductivity, thus in this study we discussed what kind of CuI ilms we can produce using
extraction method, which is very often used by organic chemists. The aim of this study is to decide which media or solvent should be used in chemical bath for producing better CuI thin ilms. As a result, it has been found that CuI thin ilms produced in the water bath had the best crystalline form; their average grain size and ilm thickness were higher than the others according to XRD calculations and SEM images. Films produced in chloroform and carbon tetra chloride baths had the lowest ilm thickness; they were coated only on the half of the glass material. Although commercial glass is very cheap, ITO or FTO substrates are quite expensive. So, this method is not suitable for producing thin ilms on ITO or FTO. Finally, the ilm thickness and grain size can change with bath media and this is a very useful and cheap method for producing CuI in ethanol media. In addition, the ratio of Cu/I in ethanol media is almost equal to its theoretical ratio. At the same time, due to their spectroscopic properties, these ilms can also be used in scintillation applications. Thallium-activated NaI crystals are used to measure low-energy X-and gamma rays. CuI thin ilms can be used instead of it, which will be more handy and ergonomic.
5. Acknowledgement
This study is supported by Erciyes Üniversitesi Teknopark (ETTO).
6. References
1. Zheng-Johansson JXM, McGreevy RL. A molecular dynamics study of ionic conduction in CuI. II. Local ionic motion and conduction mechanisms. Solid State Ionics.1996;83(1-2):35-48. 2. Zheng-Johansson JXM, Ebbsjö I, McGreevy RL. A molecular dynamics study of ionic conduction in CuI. I. Derivation of the interionic potential from dynamic properties. Solid State Ionics. 1995;82(3-4):115-122.
3. Miyake S, Hoshino S, Takenaka T. On the Phase Transition in Cuprous Iodide. Journal of the Physical Society of Japan. 1952;7:19-24.
4. Bührer W, Hälg W. Crystal structure of high-temperature cuprous iodide and cuprous bromide. Electrochimica Acta. 1977;22(7):701-704.
5. Tennakone K, Kumara GRRA, Kumarasinghe AR, Wijayantha KGU, Sirimanne PM. A dye-sensitized nano-porous solid-state photovoltaic cell. Semiconductor Science and Technology. 1995;10(12):1689-1693.
6. Tennakone K, Kumarasinghe AR, Sirimanne PM, Kumara GRRA. Chlorophyll-sensitized microporous copper iodide photocathode. Journal of Photochemistry and Photobiology A: Chemistry. 1995;91(1):59-61.
8. Tennakone K, Kumara GRRA, Kottegoda IRM, Perera VPS, Aponsu GMLP, Wijayantha KGU. Deposition of Thin Conducting Films of CuI on Glass. Solar Energy Materials and Solar Cells. 1998;55(3):283-289.
9. Huang B, Zheng Z, Yang F, Zhang Y, Pu D, Zhao H, et al. A rapid sonochemical approach to semiconductor thin ilms: The case of metal iodides. Solid State Ionics. 2008;179(35-36):2006-2010. 10. Sirimanne PM, Soga T, Kunst M. Observation of microwave
conductivity in copper iodide ilms and relay efect in the dye molecules attached to CuI photocathode. Journal of Solid State Chemistry. 2005;178(10):3010-3013.
11. Cullity BD. Elements of X-ray Difraction. 2nd Ed. Reading: Addison-Wesley; 1978.
12. Mott NF, Davis EA. Electronic Processes in Non-Crystalline Materials. Oxford: Clarendon Press; 1979. p.273-274. 13. Mamazza Jr RF, Morel DL, Ferekides CS. Transparent conducting
oxide thin ilms of Cd2SnO4 prepared by RF magnetron
co-sputtering of the constituent binary oxides. Thin Solid Films. 2005;484(1-2):26-33.
14. Ferro R, Rodriguez JA, Vigil O, Morales-Acevedo A. Chemical composition and electrical conduction mechanism for CdO:F thin ilms deposited by spray pyrolysis. Materials Science and Engineering: B. 2001;87(1):83-86.
15. Callister WD. Materials Science and Engineering - An Introduction. New York: John Wiley and Sons; 1997.
16. Pejova B, Grozdanov I, Tanuševski A. Optical and thermal band gap energy of chemically deposited bismuth(III) selenide thin ilms. Materials Chemistry and Physics. 2004;83(2-3):245-249. 17. Yan YH, Liu YC, Fang L, Lu ZC, Li ZB, Zhou SX. Growth of
CuI bufer layer prepared by spraying method. Transactions of Nonferrous Metals Society of China. 2011;21(2):359-363. 18. Kosta I, Azaceta E, Yate L, Cabañero G, Grande H, Tena-Zaera
R. Cathodic electrochemical deposition of CuI from room temperature ionic liquid-based electrolytes. Electrochemistry Communications. 2015;59:20-23.