www.atmos-chem-phys.org/acp/4/2259/ SRef-ID: 1680-7324/acp/2004-4-2259 European Geosciences Union
Chemistry
and Physics
The origin of sea salt in snow on Arctic sea ice and in coastal regions
F. Domine1, R. Sparapani2, A. Ianniello2, and H. J. Beine2
1CNRS, Laboratoire de Glaciologie et Geophysique de l’Environnement, BP 96, 38402 Saint Martin d’H`eres cedex, France 2C.N.R.-IIA, Via Salaria Km 29,3 , I-00016 Monterotondo Scalo (Roma), Italy
Received: 19 May 2004 – Published in Atmos. Chem. Phys. Discuss.: 24 August 2004 Revised: 20 October 2004 – Accepted: 30 October 2004 – Published: 23 November 2004
Abstract. Snow, through its trace constituents, can have a major impact on lower tropospheric chemistry, as evidenced by ozone depletion events (ODEs) in oceanic polar areas. These ODEs are caused by the chemistry of bromine com-pounds that originate from sea salt bromide. Bromide may be supplied to the snow surface by upward migration from sea ice, by frost flowers being wind-blown to the snow surface, or by wind-transported aerosol generated by sea spray. We investigate here the relative importance of these processes by analyzing ions in snow near Alert and Ny- ˚Alesund (Cana-dian and European high Arctic) in winter and spring. Verti-cal ionic profiles in the snowpack on sea ice are measured to test upward migration of sea salt ions and to seek evidence for ion fractionation processes. Time series of the ionic com-position of surface snow layers are investigated to quantify wind-transported ions. Upward migration of unfractionated sea salt to heights of at least 17 cm was observed in winter snow, leading to Cl−
concentration of several hundredµM. Upward migration thus has the potential to supply ions to surface snow layers. Time series show that wind can deposit aerosols to the top few cm of the snow, leading also to Cl−
concentrations of several hundredµM, so that both diffusion from sea ice and wind transport can significantly contribute ions to snow. At Ny- ˚Alesund, sea salt transported by wind was unfractionated, implying that it comes from sea spray rather than frost flowers. Estimations based on our results suggest that the marine snowpack contains about 10 times more Na+ than the frost flowers, so that both the marine
snowpack and frost flowers need to be considered as sea salt sources. Our data suggest that ozone depletion chemistry can significantly enhance the Br−
content of snow. We speculate that this can also take place in coastal regions and contribute to propagate ODEs inland. Finally, we stress the need to measure snow physical parameters such as permeability and specific surface area to understand quantitatively changes in snow chemistry.
Correspondence to:F. Domine (florent@lgge.obs.ujf-grenoble.fr)
1 Introduction
Interactions between the snowpack and the atmosphere lead to important modifications of atmospheric composition (Domine and Shepson, 2002), and a most dramatic example is the complete destruction of ozone from the ground up to altitudes greater than 1000 m, observed in the Arctic (tenheim et al., 2000) and the Antarctic (Tarasick and Bot-tenheim, 2002) in the spring, when the frozen sea and the ground are almost entirely snow-covered. It is now reason-ably certain that brominated species, derived from sea salt bromide, are key species in the chemistry of this ozone de-struction (Barrie et al., 1988; Fan and Jacob, 1992; Tang and McConnell, 1996).
However, many aspects of this chemistry are not fully un-derstood and prevent the detailed modeling, let alone the pre-diction, of these ozone depletion events (ODEs) (Bottenheim et al., 2002a). Among these, the processes by which sea salt and bromide reach the snow surface to become available for activation into brominated compounds is unclear. Three ma-jor processes can be envisaged.
Sea water Sea salt
wind
Frost flowers
Open sea Sea spray
wind
Upward migration of Sea salt
Sea ice
Sea ice Sea
water
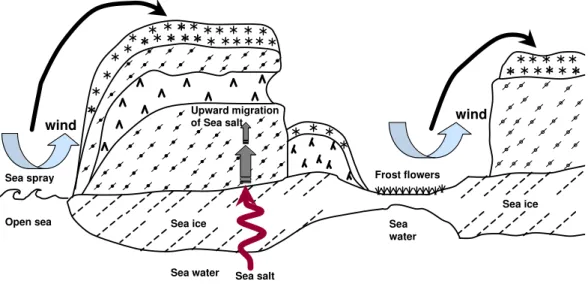
Fig. 1. Illustration of the main three processes suspected of supplying sea salt ions to marine snow: wind-transport of sea spray, upward migration from sea ice, and wind-blown frost flowers.
snow on the Antarctic continent and on surface marine snow (Wolff et al., 2003). Kaleschke et al. (2004) concluded from a modeling study that most ODEs could be correlated to the occurrence of frost flowers, which stresses the importance of these crystals. However, frost flowers provide intense point sources of sea salt to the atmosphere and snow and are eas-ier to detect (for example from their strong radar backscatter signal) than more widespread and less intense processes that may also have a significant global impact, such as the follow-ing process.
The second process is the upward migration of a sea salt enriched brine from the sea ice to the snowpack. Brines are often present at the sea ice–snow interface and can travel up the snow by capillary forces (Perovich and Richter-Menge, 1994). The wettability of snow crystal surfaces by the brine is then the driving force for this process. Numerous stud-ies in Antarctica (Eicken et al., 1994; Massom et al., 2002) have shown that salinities up to 5 psu could often be found in snow at a height of 20 cm above the sea ice. More lim-ited studies in the Arctic have also shown that a slush layer was present at the surface of Arctic ice (Garrity, 1992) from which the capillary motion of a brine can be inferred. Di-rect salinity measurements (Eicken et al., 2002) have also shown that high salinities could be found in snow on sea ice. However, these measurements were done in the summer, when the warmer temperatures favor the presence of a liq-uid phase, while ozone depletion episodes mostly take place around early spring. It is thus not clear whether surface snow, that is more susceptible to interact with the atmosphere, can be directly affected by sea salt migrating up from the sea ice in the spring.
The third process is the transport of sea salt aerosol gener-ated by sea spray (Buat-M´enard et al., 1974) to snow-covered
surfaces. Rankin et al. (2000) concluded that the open sea was not as efficient a source of sea salt aerosol as frost flow-ers, for transport to the Antarctic coast. However, in places such as Svalbard, where the open sea is never far because of the presence of the Gulf stream, and where ODEs have been observed (Solberg et al., 1996), this process cannot be ruled out and deserves investigation.
These three processes, that can bring bromide from sea salt into the surface layers of the marine snowpack, are illustrated in Fig. 1. Understanding and modeling the flux of bromi-nated compounds to the atmosphere through bromide activa-tion requires, among many other aspects, the determinaactiva-tion of which of these three processes is predominant. The impor-tance of each process may also evolve with climate change, and determining their current state is a first step towards pre-dicting the future availability of bromide for activation in sur-face snow.
To help shed some light on this question, we took advan-tage of three expeditions to the Arctic to sample snow on the sea ice, where the direct influence of the underlying ocean would be detectable, and on land near the coast, where the influence of marine air masses would be felt, but not that of migration from sea ice. These expeditions were the winter and spring intensive campaigns of Alert 2000 (Bottenheim et al., 2002b) and the spring intensive of the NICE campaign in Ny- ˚Alesund, Spitsbergen, in April/May 2001 (Beine et al., 2003).
Table 1.Operating conditions of the IC analyses during all campaigns.
IC DX 100 cation analysis IC DX 120 anion analysis
Column CS12A (4×250 mm) AS12A (4×200 mm)
Pre-column CG12A (4×50 mm) AG12A (4×50 mm)
Suppressor CSRS-II (4 mm) ASRS-II (4 mm)
Operative Flow Rate 1 ml/min 1.5 ml/min
Loop 150µl 300µl
Elution procedure Isocratic isocratic
Dionex Eluent Methanesulphonic acid, MSA 20 mM Buffer solution of Na2CO32.1 mM, NaHCO30.8 mM Analyte species Na+, K+, Ca2+, Mg2+, NH+
4 SO
2−
4 , NO
−
3, Cl
−, NO−
2, Br
−
Detector Conductivity cell Conductivity cell
are expected if snow is affected by frost flowers deposited by wind (Rankin et al., 2002).
We present here vertical profiles and time series of ion compositions in several Arctic locations. Our initial objec-tive in these sampling campaigns was not to answer the ti-tle question of this paper, and the first samplings were thus not perfectly targeted. Subsequent samplings became more adequately focused. Although the present data do not fully answer our question, we feel that they do bring a useful con-tribution to our understanding of the mechanism of transfer of sea salt and bromide to Arctic snow.
2 Experimental methods
2.1 Sites
Around Alert, (North coast of Ellesmere island, Cana-dian high Arctic) the sampling site on land was within 400 m of the FTX building (82◦27.28′N, 62◦29.69′W,
Domine et al., 2002), about 5.4 km from the coast. On the sea ice, the winter sampling site was on Joliffe bay (82◦31.07′N, 62◦42.05′W) and the spring sampling site was
at 82◦31.74′N, 62◦44.39′W, near Williams island. Sampling
was also done on the Northern Arctic ocean on 25 April 2000, at 84◦
56′
N, 67◦
28′
W.
Around Ny- ˚Alesund (Svalbard archipelago, Spitsbergen island, European high Arctic), sampling was done near the Ny- ˚Alesund village (78◦55.45 N, 11◦55.67 E) by the
Amundsen mast, about 30 m from the shoreline. Sampling on the sea ice was in one of the rare locations where sea ice was present around Ny- ˚Alesund in May 2001, at 78◦49′N,
11◦40′E.
2.2 Snow sampling
Snow was sampled in a manner essentially similar to that de-scribed by Domine et al. (2002) for physical measurements. Polyethylene gloves were used to avoid contamination, and snow was sampled into polyethylene sampling vials. For
Table 2.Laboratory precision and detection limits during all cam-paigns.
Measured species by IC Precision1[%] 3σL.O.D. [µM]
Cl− 3.33 0.05
NO−2 3.29 0.013
Br− 1.40 0.01
NO−3 1.36 0.01
SO24− 2.18 0.02
Na+ 2.99 0.04
NH+4 3.63 0.02
K+ 2.29 0.01
Mg2+ 2.46 0.08
Ca2+ 1.42 0.25
1The laboratory precision is estimated on the basis of repeated
anal-yses carried out at a concentration level of 100 ng/ml typical of sam-ples collected in polar sites.
each snow layer, triplicate samples were taken for anions and another set of triplicates was taken for cations. Samples were usually melted and analyzed on site by ion chromatog-raphy within 12 h of sampling, and in a few cases were stored frozen for up to 48 h before analysis.
2.3 Ion chromatography analyses
Melted snow was analyzed by ion chromatography (Dionex IC mod. DX120 and DX100) using Dionex AS12 and CS12 columns for anions and cations, respectively, as detailed in Table 1. Detection was by conductimetry coupled with post-column suppression of eluent ions. The use of self-regenerating suppressors that enhance analyte conductiv-ity while suppressing eluent conductivconductiv-ity allowed parts-per-billion (ppb) detection limits for anions and cations without preconcentration.
11 Feb. '00 Alert sea ice
0 5 10 15 20 25 30 35 40 45
0 100 200 300
Cl- Na+ µM ; Br- 10-8M
D
is
ta
n
c
e
a
b
o
v
e
s
e
a
i
c
e
,
c
m
Cl-Na+
Br-Samplings
≈≈
4
0
c
m
Sea ice
Depth hoar, d=0.25
Hard windpack d=0.35 Hard windpack, d=0.41
7 february snowfall
T=-27°C T=-40°C
T=-34°C
T=-29°C
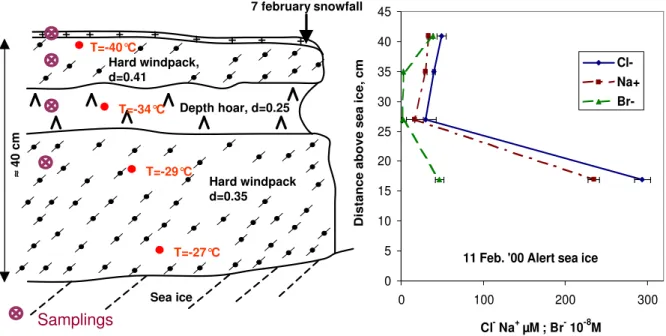
Fig. 2.Stratigraphy and concentrations of Cl−, Na+and Br−in a snow bank on sea ice near Alert, on 11 February 2000. Density (d) and temperature (T) values of the snow are indicated. Symbols for snow crystals are those recommended by Colbeck et al. (1990).
quality control/assurance procedures (Allegrini et al., 1999; Perrino et al., 2001). The lower detection limits (L.O.D.) of the analytical technique (Table 2) were calculated as the analyte signal which is three times the standard deviation (3σ) of a near-zero concentration measurement. The pre-cision and accuracy of ion chromatography measurements were determined from the standard deviation and mean of re-peated analyses of the laboratory standard. Typically, a mul-tipoint calibration (seven standards in the range 5–1000 ppb) was used. The correlation coefficient from the regression equation of the average values was always greater than 0.999. The IC response was linear up to 20µM for each chemi-cal species analyzed, and dilutions were performed for more concentrated samples. For chromatographic analyses, con-trol samples, consisting of calibration solutions of anions (Cl−, Br−, NO−
3, NO
−
2, SO2
−
4 )and cations (Na
+, NH+
4, K
+,
Mg2+, Ca2+), were analyzed every twenty samples in order
to re-calibrate the ion chromatograph. Calibration solutions were prepared every two weeks from 1000 ppm standard so-lutions of salts (MERCK).
3 Results and discussion
3.1 Vertical profiles on pack ice
The snow pack was studied in Joliffe Bay, near Alert, on 11 and 17 February 2000. The ice is essentially permanent there, and the probability that our sampling was on multiyear ice is then high. The snow stratigraphy was very variable, as detailed by Domine et al. (2002), with snow depth varying
between 0 and 50 cm. The aspect of the snow bank that was sampled is shown in Fig. 2, along with sampling levels. The snow temperature near the surface was−40◦C, increasing to
−27◦C 5 cm above the sea ice and no liquid water could be
detected. The Na+, Cl−, and Br−profiles are also shown in
Fig. 2. The maximum concentrations, with 295µM of Cl−
are found in the windpack closest to the sea ice, and the min-imum concentrations (30µM of Cl−) are found in the depth
hoar. Cl−/Na+molar ratios vary from 1.25 (lowest sampled
layer) to 1.79 (depth hoar), i.e. somewhat higher than the sea salt value of 1.165 (Holland, 1978). This difference is not significant for the lowest layer sampled. Cl−
/Br−
values are 631 in the lower windpack, essentially identical to the sea water value of 647 (Holland, 1978), while it is 126 for the uppermost layer, i.e. enriched in Br−
by a factor of 5 rela-tive to sea water. This ratio is around 1700 for both middle layers, but the Br−value is close to the detection limit,
im-plying a large uncertainty. It nevertheless appears likely that these layers are depleted in Br− relative to sea salt.
Subse-quent samplings at the same levels on 17 February yielded similar results. Interestingly, the lowest layer sampled had ratios of Cl−, Br−, Mg2+, and K+ to Na+ within 10% of
those of sea water. Ca2+/Na+was 10 times the ocean value,
Samplings
Sea ice h (cm)22 23
21
17
Depth hoar Windpack Slightly crusted
Surface hoar
T=-17°C T=-20°C
Arctic Ocean, 85°N
0 5 10 15 20 25
0 200 400 600
Cl- Na+ µM ; Br- nM
D
is
ta
n
c
e
a
b
o
v
e
s
e
a
i
c
e
,
c
m
Cl-Na+
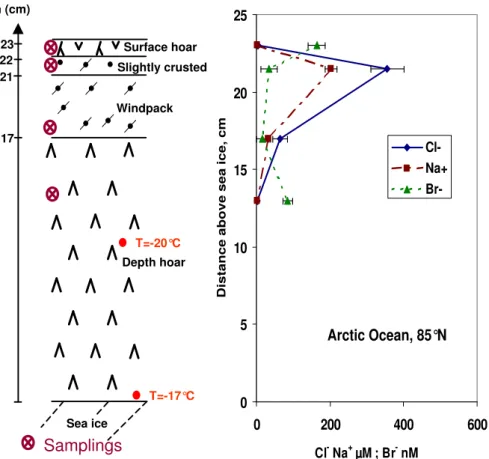
Br-Fig. 3. Stratigraphy and concentrations of Cl−, Na+and Br−in a snow bank on the Northern Arctic Ocean (84◦56′N, 67◦28′W) on 25 April 2000.
detailed sampling was done in the vicinity of the sea ice to confirm the presence of a gradient and to evidence higher concentrations near the ice surface.
Migration from the sea ice may not explain all the compo-sitions observed. [Cl−
] in the uppermost layer is 49.8µM, while that of the depth hoar is 30.1µM. This may seem to rule out migration from the base of the snowpack. However, if migration of ions is by capillary forces and therefore takes place on the surface of snow crystals, it is possible that the ionic concentrations are proportional to the specific surface area (SSA) of the snow. Domine et al. (2002) mention that the depth hoar, the top windpack, and the recent surface snow had SSAs of 200, 240, and 680 cm2/g, respectively. The higher SSA of the higher layers imply that upward migra-tion may have produced higher concentramigra-tions in these lay-ers than in lower ones. However, an examination of the ionic ratios shows that the snow composition is different from that of sea salt. For example, in the top snow layer, Mg2+/Na+
and K+
/Na+
are 2.1 and 1.7 times the sea salt values. We then conclude that, even if upward migration reached surface snow, wet or dry deposition made significant contributions to the ionic content of the surface snow layers.
Data obtained on the Arctic Ocean site (84◦56′N,
67◦28′W) on 25 April 2000 tend to confirm this conclusion.
The sampling site was in the vicinity of a recently refrozen lead, on an ice plate surrounded by pressure ridges. Judging from the extensive depth hoar development, the ice must have formed in the previous fall, and may even have been multi-year ice. The snow stratigraphy and chemistry are shown in Fig. 3. Large concentrations of sodium (202µM) and chlo-ride (356µM) were seen near the surface, while much lower values (1.4 and 2.7µM) were observed in the lowermost layer sampled, 13 cm above the ice. This clearly rules out upward capillary migration to explain the high near-surface concentrations. Ionic ratios are also very different from sea water values. Cl−/Na+values in the 4 layers sampled are,
from top to bottom, 2.75, 1.76, 2.06, 1.96, all much higher than the 1.165 ocean value. The Cl−/Br−ratios are 25 and
32 in the top and bottom layers, much lower than the 647 ocean value, indicating bromide enrichment by a factor over 20. On the contrary, both middle layers are very depleted, with Cl−
/Br−
ratios of 11 000 and 3000, again with a large uncertainty. Mg2+
/Na+
and K+
/Na+
Samplings Sea ice h (cm)
Forming depth hoar Soft windpack Recent snow
10 28
0 25
6 33 35
Soft windpack
T=-22.5°C
Alert, sea ice, 23 April 2000
0 5 10 15 20 25 30 35
0 20 40 60
Cl- Na+ µM ; Br- 10-8 M
D
is
ta
n
c
e
a
b
o
v
e
s
e
a
i
c
e
,
c
m
Cl-Na+
Br-Fig. 4.Stratigraphy and concentrations of Cl−, Na+and Br−in a snow bank on sea ice near Alert, on 23 April 2000.
to explain the high sodium and chloride concentrations ob-served it clearly did not come directly upwards from the sea ice. The significant enrichment or depletion of all layers in Br− implies that the ions did not come directly from frost
flower formation, as Rankin et al. (2002) have reported that in Antarctica, this ratio was similar to that of sea water. De-pletion may be explained by Br−
activation during ODEs, while enrichment may be due to the deposition of HBr pro-duced by ODEs, in agreement with the suggestions of Simp-son et al. (2004)1 who studied Cl−
/Br−
ratios in northern Alaska. The high Mg2+
/Na+
and K+
/Na+
ratios can be in-terpreted as a contribution from other sources, such as soil dust (as confirmed by high Ca2+values) and anthropogenic
emissions (as confirmed by high sulphate values).
These first two examples show that both upward migra-tion and deposimigra-tion from the atmosphere can lead to snow of salinity 0.02 psu (Na+content around 200µM), about 20 cm
above the ice surface. However, snow compositions in both these cases are very different, and this makes it possible to conclude that upward migration took place near Alert, while wind deposition took place on the northern Arctic ocean.
A further example of sea salt ions brought by wet or dry deposition comes from a study of the snowpack on sea ice 1Simpson, W. R., Alvarez-Aviles, L., Douglas, T. A., Sturm,
M., and Domine, F.: Halogens in the coastal snowpack near Bar-row, Alaska: Evidence for active bromine air-snow chemistry dur-ing sprdur-ingtime, Geophys. Res. Lett., submitted, 2004.
near Alert on 23 April 2000 (Fig. 4). Again, only the top layers were analyzed. Cl−and Na+concentrations are fairly
high, showing that sea salt contributed to snow chemistry. The shapes of the vertical profiles do not appear to be caused by upward transport, although windpacks usually have SSAs greater than depth hoar (Legagneux et al., 2002) and the pro-cess cannot be ruled out from the profiles only. Ionic ratios are different from those of sea salt: Cl−
/Na+
values in the 4 layers sampled are, from top to bottom, 2.55, 1.92, 2.20, 3.28. Mg2+
/Na+
and K+
/Na+
ratios are 3 to 5 times higher than in ocean water, again indicating multiple sources. In-terestingly, the Cl−/Br−ratio is less different from the ocean
values than in the preceding case. The top layer has a value of 137, i.e. enriched by a factor of 5 relative to the ocean, but the other 3 layers have values of 515, 610 and 432, i.e. barely significantly different from the ocean values.
The importance of upward motion of salt from the sea ice was tested in the spring near Ny- ˚Alesund. Figure 5 shows the stratigraphy and the Cl−profile of the snow pack on sea
Sea ice
h (cm)
6.5
2
0 9.5 10
d=0.25 d=0.25
d=0.25
Small rounded grains Decomposing grains
Melt/freeze crust
Wet snow
Samplings
T=-5.8°C T=-4.7°C T=-5.8°C
6 may '01, Ny Alesund
0 2 4 6 8 10
1,E+00 1,E+02 1,E+04 1,E+06
Cl- µM
D
is
ta
n
c
e
f
ro
m
s
e
a
i
c
e
,
c
m
Cl-Cl-, sea water
Sea water, Cl
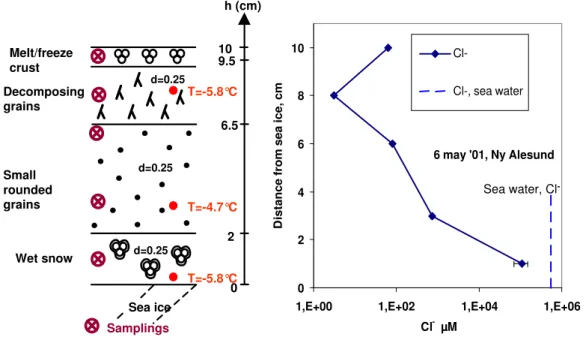
-Fig. 5.Stratigraphy and concentrations of Cl−on sea ice near Ny- ˚Alesund, on 6 May 2001. Density (d) and temperature (T) values of the snow are indicated. Note that a log scale had to be used to show very large Cl−concentrations.
liquid water were observed in the bottom layer, 2 cm thick. Figure 5 shows that huge ionic concentrations exist in the lowest layer: this snow has a salinity of about 5 psu. It did not appear to be water-saturated, and this is confirmed by its low density of 0.25. According to Colbeck (1982), this im-plies that the liquid water content was less than 14%, and the liquid was then rather a brine with a Cl−content of at least
28 g/L. Unfortunately, an error in sample handling during the dilution procedure prevented the accurate quantification of all ions, and the values for this layer, are then lower limits. The measured Cl−
/Na+
ratio of 8.4 appears unrealistic and illustrates the problem encountered.
The Cl−
profile of Fig. 5 clearly suggests that upward mi-gration took place to a height of about 6 cm. At that level, the composition of the snow appears consistent with migra-tion of sea salt, and addimigra-tional atmospheric input of SO2−
4 and Ca++. The Cl−/Br− ratio is half that of sea water, and
this may be due to atmospheric input of Br−. The second
layer from the top has very low ionic concentrations, and al-though ion ratios are close to those of sea water, we suggest that its composition is due to the atmospheric scavenging of mostly sea salt aerosol produced by sea spray. Finally, the Cl−
concentration from the top layer, 62µM, cannot be due to transport from the ice at all, considering the low concen-tration of the underlying layer.
Two conclusions can be derived from this vertical profile. First, upward transport of sea salt in the presence of a brine is clearly evidenced. This has already been concluded from snow salinity studies (Eicken et al., 1994; Massom et al., 2001). However, the interesting observation is that, even at
the warm temperatures observed, upward capillary motion leads to high sea salt concentrations only up to 6 to 7 cm, over a time scale that we estimate as a month at the most. Even in this thin 10 cm snowpack, the basal brine does not affect the top snow layer, at least over a time scale of about a month.
To sum up this section, 2 of these 4 profiles indicate that upward capillary motion does take place up to a certain height in the snowpack. In the other 2 cases, this conclusion is not reached simply because the relevant measurements were not made, and the existence of this physical process cannot be ruled out. However, in all 4 cases we can safely say that the composition of the uppermost snow layer was not significantly affected by upward capillary motion. The chemical composition of these top layers indicates several contributing sources, and we may have detected the effect of ozone depletion chemistry on snow composition, as this pro-cess may explain high Br−concentrations. Sea salt deposited
from the atmosphere was clearly a contributor to the chem-istry of the top snow layer. We cannot determine whether this “atmospheric” sea salt was supplied by frost flowers, as sulphate can have multiple sources, and the SO24−/Na+
ratio cannot be used for that purpose. In the case of the Spitsber-gen profile, Cl−
0 10 20 30 40 50 60 70
08-févr 11-févr 14-févr 17-févr 20-févr 23-févr
Date
C
l
- µ
M
0 100 200 300 400 500 600 700
B
r
- n
M
Cl-, 7 Feb. Layer Cl-, 3 Feb. Layer Br-, 7 Feb Layer Br-, 3 Feb Layer
0 100 200 300 400 500 600 700
08-févr 11-févr 14-févr 17-févr 20-févr 23-févr
Date
C
l
- /B
r
- M
o
la
r
Cl-/Br-, 7 Feb. Layer Cl-/Br-, 3 Feb. Layer
a
b
Fig. 6. (a)Time series of the Cl−and Br−concentrations of two snow layer on land, near Alert, in February 2000. Both snow layers were mixed together by a wind storm on 22 February, and were then sampled together.(b)Time series of the Cl−/Br−ratio of these same layers.
3.2 Time series
3.2.1 3 and 7 February layers, Alert
The chemistry of the snowfalls of 3 and 7 February 2000 (Domine et al., 2002) was monitored on land at Alert, near the FTX building. The evolutions of the Cl−and Br−
con-centrations are shown in Fig. 6a. As detailed in Domine et al. (2002) both layers were deposited on a hard wind-packed layer. The 3 February layer fell under windy conditions, ac-cumulated in wind-sheltered spots such as the lee of sastrugi and was discontinuous. The 7 February layer fell under calm conditions and was homogeneous. Its composition indicates contributions from sea salt, long range transport of SO24− and other ions, and a local source of several ions, essentially Ca2+
(Toom-Sauntry and Barrie, 2002). The Cl−
concen-trations showed little variations until 22 February. The slow decrease of Cl−
in the 7 February layer is probably due to the dilution of this layer by surface hoar that formed con-tinuously (Domine et al., 2002) but in insufficient amounts to be sampled separately. To try to determine the chemistry of surface hoar, hoar frost that was growing on antenna guy wires was sampled, and showed a Cl−content of 11.9µM
on 16 February and of 13.3µM on 20 February, confirm-ing the dilution suggestion. Until 20 February, Cl−in the 3
February layer shows slight variations without a clear trend, ascribed, as in the case of its physical properties, to the spa-tially variable wind action during deposition (Domine et al., 2002). Br−
decreases slightly in the 7 February layer, while its decrease is dramatic in the 3 February layer. A possible interpretation is that Br−
is depleted by dark reactions that activate bromide into Br2and BrCl, as detected by Foster et al. (2001) with an instrument located near our sampling site. The decrease is less in the 7 February layer because Br−can
be dry-deposited and because surface hoar contains 110 nM of Br−, as suggested by hoar frost analyses.
As shown in Fig. 6b the Cl−
/Br−
ratio is fairly stable around 100 in the 7 February layer until 20 February show-ing that Br−is enriched relative to sea salt by a factor of 5 to
8. Regarding the 3 February layer, the ratio on 9 February is
similar to that of the upper layer, but then rises to 450 on 20 February.
On 22 February, a wind storm took place, with wind speeds measured at the nearby GAW laboratory that aver-aged 4 m/s over about 8 h, and with a maximum of 7 m/s. This mixed both layers and accumulated them in wind-sheltered spots, with the probable addition of a few loose crystals from the windpack. Both Cl− and Br−
concentra-tions increased dramatically. Ianniello et al. (2002) analyzed aerosols and gases at Alert between 9 and 21 February 2000, with a 48 h time resolution. They report mean HCl and HBr atmospheric concentrations of 11.3 and 16.7 ng.m−3, while Cl− and Br− concentration from aerosols were 73.9
and 5.2 ng.m−3. However, these values show much scatter with time, and to estimate a value for 22 February, we pre-fer to consider the value measured for the period from 19 to 21 February, which are undetectable for HCl, 23 ng.m−3 for HBr, and 31.8 and 10.5 ng.m−3for Cl−
and Br−
. Both aerosol deposition and the scavenging of HCl and HBr may have contributed to the increases in snow concentrations. Judging from the mass of snow present on the ground before and after the wind storm, sublimation by wind transport can-not explain the increase. In any case, this wind storm proves that large amounts of Cl−and Br−can rapidly be deposited
to snow by wind. Enrichment by windpack crystals can be safely ruled out, as the concentrations there were lower than in both February layers, and Br− levels in particular were
undetectable. Finally, while (Cl−+HCl)/(Br−+HBr) in the
atmosphere was 8.8 on a molar basis, the wind-blown snow took up about 50µM of Cl−
and only about 0.3µM of Br−
, indicating that Cl−
was transferred to the snow much more efficiently than Br−
, possibly because a greater fraction of chloride was in the aerosol form. A quantitative comparison of ion uptake with other wind storms will be done after the description of those observed at Ny- ˚Alesund.
3.2.2 27 and 29 April 2001 layer, Ny- ˚Alesund
-12 -10 -8 -6 -4 -2 0 2
27-Apr 29-Apr 1-May 3-May 5-May 7-May 9-May 11-May
Solar Time
A
ir
t
e
m
p
e
ra
tu
re
(
°C
)
0 2 4 6 8 10 12 14
W
in
d
s
p
e
e
d
,
m
/s
Temperature at 2.37 m Wind speed at 2.71 m
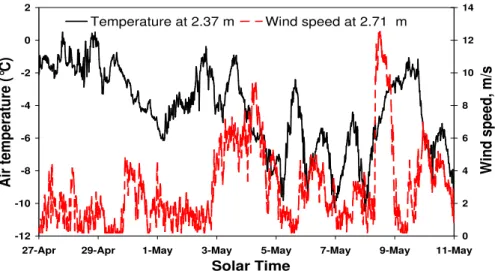
Fig. 7.Temperature and wind speed measured near Ny- ˚Alesund, within 50 m of our sampling site at the Amundsen mast, in spring 2001.
−2◦
C (Fig. 7). It consisted of rimed dendritic crystals. Snow showers then occurred in the afternoon and evening, with snow crystals having various shapes: plates, dendritic crys-tals, and needles in the evening. The total thickness of the snowfall was about 3 cm (Fig. 8). The air temperature then rose to 0.5◦C in the evening of both the 27th and the 28th
un-der overcast conditions, initiating melting at the top of the layer. This produced a superficial melt-freeze crust about 5 mm thick that was still permeable and never resembled an ice layer. No percolation was observed in the underlying part of the layer. This snow layer was covered on 29 April by a new snowfall, 4.5 cm thick, made up of small irregular crys-tals that fell under air temperatures between 1 and −3◦
C, between 6:00 and 23:00. A wind crust progressively formed on the 29 April layer that reached a thickness of 1 cm on 4 May (Fig. 9). This new snowfall and the crust certainly hin-dered subsequent exchanges between the atmosphere and the 27 April layer.
At Ny- ˚Alesund, snow falls were very frequent, making conditions quite different from those at Alert. Solid precipi-tations were observed on 18, 20, 23 and 25 April, producing snow layers a few cm thick at the most. Also, while Alert is generally quite calm, there is always wind at Ny- ˚Alesund. As a result, some snow is frequently raised by wind, some layers are eroded and several different layers are exposed. A newly deposited layer can thus easily be contaminated by wind-raised snow, originating from different layers of poten-tially very different chemical composition. The snow sur-face is very irregular, with sastrugi about 5 to 20 cm high, of wavelength between 2 and 10 m, that produce irregular wind pumping and therefore variable dry deposition of atmo-spheric species, whose snow concentrations are bound to be spatially very variable. The result of these conditions is that snow composition was found to be spatially heterogeneous, and triplicate samples often showed a large variability. The analytical procedure was essentially the same as at Alert, and
thus cannot be the cause of the moderate to poor analytical reproducibility. We attempted to minimize the effect of those spatial variations by taking triplicate samples as close as pos-sible to each other, and by doing subsequent sampling close to previous ones.
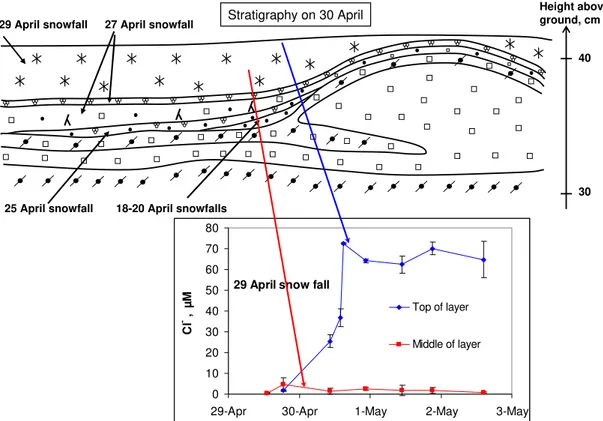
The 29 April snow layer was sampled at two levels: at the very surface (top 1 cm) and about 3 cm below the surface. Figure 8 shows that initially, the 29 April snowfall was very poor in Cl−
: 0.5µM for the snow sampled at 13:00, when accumulation was about 2 cm. Precipitating snow was also sampled at 18:30, when accumulation was about 4 cm, and had a very low Cl−content: 1.9µM. Subsequently, the Cl−
content of the middle part of the layer remained essentially stable around 2µM, with one exception on 29 April when contamination by the underlying layer may have taken place, as suggested by the large standard deviation. On the con-trary, the Cl−content of the top part of the layer, which was
developing a wind crust, increased to 70µM on 30 April and remained stable around that concentration.
On 30 April, wind was moderate, between 3 and 4.5 m/s for a large fraction of the day, and did not raise snow. Ac-cording to the aerosol measurements of Teinil¨a et al. (2003), the Cl−atmospheric concentration was 276 ng.m−3, and the Cl−concentration increased rapidly to 70µM in the top
sub-layer, suggesting that dry deposition by wind-pumping was operative. After that windy spell, conditions were calm, with wind speed staying essentially below 2 m/s until the last sam-pling on 2 May. The stability of the ionic concentrations in the top crust can be due to the low wind speed, or may also be attributed to the formation of the wind crust, with a much reduced permeability. The Cl−
/Na+
ratio stayed stable in the top part, around 1.0 with error bars around 0.3. For the mid-dle sublayers, error bars were around 1 or greater, and data are not meaningful. We then suggest that the increase in Cl−
29 April snow fall
0 10 20 30 40 50 60 70 80
29-Apr 30-Apr 1-May 2-May 3-May
Cl
- , µ
M
Top of layer
Middle of layer
29 April snowfall 27 April snowfall
25 April snowfall 18-20 April snowfalls
Stratigraphy on 30 April
30 40 Height above ground, cm
Fig. 8.Stratigraphy of the Ny- ˚Alesund snowpack on 30 April 2001, and time series of the Cl−concentration in two levels of the 29 April layer.
as suggested by the SO2−
4 content, around 7µM, with no de-tectable deposition of HCl.
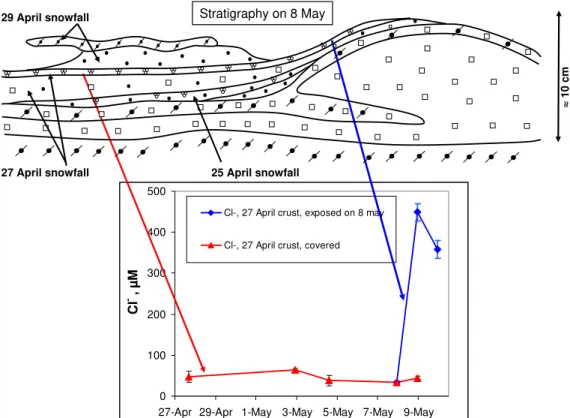
The 27 April layers offer another excellent opportunity to evaluate the effect of dry deposition due to wind pump-ing. The storm of 8 May lasted 15 h (Fig. 7) with wind speeds reaching 12.5 m/s that produced a strong erosion of the snow pack. Again according to Teinil¨a et al. (2003), the Cl−atmospheric concentration was 649 ng m−3. The top layer was the wind crust of the 29 April layer, that was partly eroded (Fig. 9). The unprotected soft snow from the 29 April layer became also quickly eroded, thus exposing the 27 April melt/freeze crust in many places, but not everywhere. Fig-ure 9 shows that before the storm, the Cl−
concentration of the 27 April crust remained essentially constant, around 40µM, while its Na+
content was around 35µM. On 8 May at 23:00, the 27 April crust was sampled, both in exposed parts and in parts where it was still sheltered by the 29 April layer. Figure 9 clearly shows that the ion concentrations of the unexposed portion were not affected by the wind storm. On the contrary, the exposed portion saw its chloride content jump to 450µM.
Analyses show that ionic ratios involving Cl−
, Br−
, Na+
, K+
, and Mg2+
are close to the sea water values, both in the exposed and sheltered parts. We thus conclude from this case study that (i) the Cl− and Na+ in the 27 April melt/freeze
crust were probably unfractionated sea salt, and not
scav-enged HCl. Likewise, after exposure on 8 May, Cl− and
Na+were again present as sea salt. (ii) Dry deposition,
en-hanced by wind pumping, can deposit enormous quantities of sea salt onto surface snow in just 15 h. (iii) A few cm of snow are sufficient to shield underlying layers from sea salt deposition by wind pumping, at least with the surface snow structure that was observed. The depth of penetration of wind-pumped sea salt into snow then appears to be here only about 2 cm. A similar depth can be derived from our study of the 29 April snow layer. Of course, we realize that this may vary with the physical properties of snow, and in particular with its permeability (Albert and Schultz, 2002).
4 Conclusions
The objective of this paper was to test the contribution of upward migration from the sea ice and deposition by wind to the ionic content of snow on sea ice. Wolff et al. (2003) and Rankin et al. (2002) hypothesized from Antarctic obser-vations that wind-deposited ions may come essentially from frost flowers.
We observed that upward migration affects the snowpack up to at least 17 cm from the ice surface, where a Cl−
0 100 200 300 400 500
27-Apr 29-Apr 1-May 3-May 5-May 7-May 9-May
Cl
- , µ
M
Cl-, 27 April crust, exposed on 8 may
Cl-, 27 April crust, covered
≈
1
0
c
m
25 April snowfall 27 April snowfall
29 April snowfall Stratigraphy on 8 May
Fig. 9. Stratigraphy of the Ny- ˚Alesund snowpack on 8 May 2001, and time series of the Cl−concentration in melt/freeze crust of the 27 April layer. On 8 May, a windstorm eroded the overlying 29 April layer, partially exposing the crust. The Cl−concentration of the exposed crust is also shown starting on 8 May.
were above−8◦C. Snow thickness on sea ice near Alert is very variable, between 0 and 50 cm (Domine et al., 2002). Eicken et al. (1994) observed variable snow thickness on the Weddell sea (Antarctica), with maximal frequencies around 5–25 cm. Migration of ions from sea ice then indeed has the potential to affect a significant fraction of the surface snow layers on sea ice. The sea salt reaching the surface of the snowpack can then be transported by wind and scattered over the entire marine snowpack, where it then may be involved in chemical reactions affecting the atmosphere.
We could never come to the conclusion that most of the ions in surface snow came from upward migration from sea ice. This is in part because our selection of sampling sites was biased towards thicker snow banks, subjectively viewed as more interesting. Furthermore, dry deposition of SO2−
4 and Ca2+
onto surface layers can rapidly obscure any sea salt chemical signature and make the detection of upward migra-tion in surface layers difficult. More case studies are needed, and we suggest that time series of vertical profiles on sea ice, over several weeks to months, would shed additional light on the actual impact of upward migration on surface snow composition.
The impact of wind deposition on snow composition was tested on land, to avoid interference from sea ice. We con-clude that wind can rapidly increase ionic concentrations in
snow, especially if the snow becomes airborne. Wind depo-sition was observed to lead to Cl−concentrations of 450µM
at Ny- ˚Alesund, similar to those produced by upward migra-tion on sea ice, 17 cm up the snow. This process was found to affect only the top 2 cm of the snowpack, but wind crusts or melt/freeze crusts were always present, and this may have limited the depth of penetration of wind-borne aerosols. In the Ny- ˚Alesund case, the deposited ions had clearly a sea salt signature without fractionation. Considering that the wind was coming from ice-free areas, this sea salt was certainly produced by sea spray, which can then significantly con-tribute to the sea salt content of snow. The highest [Br−
] that we measured, 0.62µM in the wind-exposed 27 April layer at Ny- ˚Alesund, was also caused by sea spray.
We now attempt a comparison between upward migration and frost flowers as possible sources of sea salt to the atmo-sphere. Based on Fig. 2, we assume that the marine snow-pack has a mean [Na+
] of 230µM over a depth of 20 cm, with a mean density of 0.3, and that such a snowpack cov-ers 99% of the sea ice. We then assume that frost flowcov-ers have a mean [Na+
] of 1.4 M, are 1 cm thick and have a mean density of 0.01, and cover 1% of the sea ice. Even though some of these numbers could be debated, we find that the marine snowpack contains about 10 times more Na+than the
fact that the average [Na+] of the snow is not well known,
both the marine snowpack and frost flowers appear to de-serve consideration as sources of sea salt. The scatterring of frost flowers by wind is easy, but snowpack erosion can also be fairly efficient on sea ice, as we have observed that several cm of windpack could be eroded in a day. The recent modeling results of Kaleschke et al. (2004) may suggest that frost flowers are more efficient to trigger ODEs, possibly be-cause they may be locally a more intense source of halogens to the atmosphere that marine snow. But we believe that the understanding of halogen exchange between the ocean and the atmosphere in Polar Regions requires the consideration of not only frost flowers, but also of upward migration from sea ice, and of transport from the open sea.
Our data from Alert and the northern Arctic Ocean also suggest that ozone depletion chemistry can significantly en-hance the Br−content of snow. This suggests a mechanism
to transport Br−
over continents, and propagate bromide-driven ozone destruction over land.
Acknowledgements. This work was funded by the French Polar
Institute (IPEV) through the MICHARC and POANA programs to FD, and by the European Commission through the NICE program to HJB. Field assistance by A. Gallant and campaign coordination by J. Bottenheim at Alert are gratefully acknowledged. FD thanks J. Morison (University of Washington) for offering transport to the Northern Arctic Ocean site. A. Felici, L. Ammiraglia and E. Colaiacomo (CNR-IIA) assisted with sampling and IC analyses at Ny- ˚Alesund. We thank K. Teinil¨a (Finnish Meteorological Service) for detailed aerosol data and T. Giorgiadis (CNR-IBIMET) for detailed meteorological data prior to publication. Stimulating discussions with W. R. Simpson and insightful comments on the paper by H. Eicken (both at GI-University of Alaska Fairbanks) are gratefully acknowledged. Anonymous reviewers also provided valuable comments.
Edited by: W. T. Sturges
References
Albert, M. R. and, Shultz, E.: Snow and firn properties and transport processes at Summit, Greenland, Atmos. Environ., 36, 2789– 2797, 2002.
Allegrini, I., Ianniello, A., Montagnoli, M., Sparapani, R., and Mazzioti Gomez de Teran, C.: Carbon coated annular denud-ers and ion chromatography chromatographic measurements for the measurement determination of nitrogen nitrogen-containing species (NO2and NOy) in remote atmospheres, J. Chromatogr. A, 846, 265–268, 1999.
Barrie, L. A., Bottenheim, J. W., Schnell, P. J., Crutzen, P. J., and Rasmussen, R. A.: Ozone destruction and photochemical reac-tions at polar sunrise in the lower Arctic atmosphere, Nature, 334, 138–141, 1988.
Beine, H. J., Domin´e, F., Ianniello, A., Nardino, M., Allegrini, I., Teinil¨a, K., Hillamo, R.: Fluxes of Nitrates Between Snow Sur-faces and the Atmosphere in the European High Arctic, Atmos. Chem. Phys., 3, 335–346, 2003,
SRef-ID: 1680-7324/acp/2003-3-335.
Bottenheim, J. W., Fuentes, J. D., Tarasick, D. W., and Anlauf, K. G.: Ozone in the Arctic lower troposphere during winter and spring 2000 (ALERT2000), Atmos. Environ., 36, 2535–2544, 2002a.
Bottenheim, J. W., Dibb, J. E., Honrath, R. E, and Shepson, P. B.: An introduction to the ALERT 2000 and SUMMIT 2000 Arctic research studies, Atmos. Environ., 36, 2467–2469, 2002b. Buat-M´enard, P., Morelli, J., and Chesselet, R.: Water-soluble
ele-ments in atmospheric particulate matter over tropical and equa-torial atlantic, J. Rech. Atmos., 8, 661–673, 1974.
Colbeck, S. C.: An overview of seasonal snow metamorphism, Rev. Geophys. Space Phys., 20, 45–61, 1982.
Colbeck, S., Akitaya, E., Armstong, R., Gubler, H., Lafeuille, J., Lied, K., McClung, D., and Morris, E.: The International Classi-fication for Seasonal Snow on the Ground, ICSI, IGS, 1990. Domin´e, F. and Shepson, P. B.: Air-snow interactions and
atmo-spheric chemistry, Science, 297, 1506–1510, 2002.
Domin´e, F., Cabanes, A., and Legagneux, L.: Structure, micro-physics, and surface area of the Arctic snowpack near Alert dur-ing ALERT 2000, Atmos. Environ., 36, 2753–2765, 2002. Eicken, H., Lange, M. A., Hubberten, H. W., and Wadhams, P.:
Characteristics and distribution patterns of snow and meteoric ice in the Weddell sea and their contribution to the mass balance of sea ice, Ann. Geophys., 13, 80–93, 1994.
Eicken, H., Krouse, H. R., Kadko, D., and Perovitch, D. K.: Tracer studies of pathways and rates of meltwater transport through Arctic summer sea ice, J. Geophys. Res., 107, 8046, doi:10.1029/2000JC000583, 2002.
Fan, S.-M. and Jacob, D. J.: Surface ozone depletion in Arctic spring sustained by bromine reactions on aerosols, Nature, 359, 522–524, 1992.
Foster, K., Plastridge, R., Bottenheim, J., Shepson, P., Finlayson-Pitts, B., and Spicer, C. W.: First Tropospheric Measurements of Br2and BrCl and Their Role in Surface Ozone Destruction at Polar Sunrise, Science, 291, 471–474, 2001.
Garrity, C.: Characterization of snow on floating ice and case stud-ies of brightness temperature changes during the onset of melt, in: Microwave remote sensing of sea ice, edited by: Carsey, F. D., Geophysical monograph 68, American Geophysical Union, 313–328, 1992.
Holland, H. D.: The chemistry of the atmosphere and oceans, Chap. 5, Wiley-Intersciences, New York, 1978.
Ianniello, A., Beine, H. J., Sparapani, R., Di Bari, F., Allegrini, I., Fuentes, J.: Denuder measurements of gas and aerosol species above Arctic snow surfaces at Alert 2000, Atmos. Environ., 36, 5299–5309, 2002.
Kaleschke, L., Richter, A., Burrows, J., Afe, O., Heygster, G., Notholt, J., Rankin, A. M., Roscoe, H. K., Hollwedel, J., Wag-ner, T., and Jacobi, H.-W.: Frost flowers on sea ice as a source of sea salt and their influence on tropospheric halogen chemistry, Geophys. Res. Lett., 31, L16114, 2004.
Legagneux, L., Cabanes, A., and Domin´e, F.: Measurement of the Specific Surface Area of 176 Snow Samples Using Methane Adsorption at 77 K, J. Geophys. Res., 107 (D17), 4335, doi:10.1029/2001JD001016, 2002.
Legrand, M. R. and Delmas, R. J.: Formation of HCl in the Antarc-tic atmosphere, J. Geophys. Res., 93, 7153–7168, 1988. Martin, S., Drucker, R., and Ford, M.: A laboratory study of frost
100, 7027–7036, 1995.
Massom, R. A., Eicken, H., Haas, C., Jeffries, M. O., Drinkwater, M. R., Sturm, M., Worby, A. P., Wu, X., Lytle, V. I., Ushio, S., Morris, K., Reid, P. A., Warren, S., and Allison, I.: Snow on Antarctic sea ice, Rev. Geophys., 39 (3), 413–445, 2001. Perovich, D. K. and Richter-Menge, J. A.: Surface characteristics
of lead ice, J. Geophys. Res., 99, 16 341–16 350, 1994.
Perrino, C., Ramirez, D., and Allegrini, I.: Monitoring acidic air pollutants near Rome by means of diffusion lines: development of a specific quality control procedure, Atmos. Environ., 35, 331–341, 2001.
Rankin, A. M., Auld, V., and Wolff, E. W.: Frost flowers as a source of fractionated sea salt aerosol in the polar regions, Geophys. Res. Lett., 27, 3469–3472, 2000.
Rankin, A. M., Wolff, E. W., and Martin, S.: Frost flowers: impli-cations for tropospheric chemistry and ice core interpretation, J. Geophys. Res., 107, 4683, doi:10.1029/2002JD002492, 2002. Solberg, S., Schmidtbauer, A., Semb, A., and Stordal, F.:
Boundary-layer ozone depletion as seen in the Norwegian Arctic in spring, J. Atmos. Chem., 23, 301–332, 1996.
Tang, T. and Mc Connell, J. C.: Autocatalytic release of bromine from arctic snow pack during polar sunrise, Geophys. Res. Lett., 23, 2633–2636, 1996.
Tarasick, D. W. and Bottenheim, J. W.: Surface ozone depletion episodes in the Arctic and Antarctic from historical ozonesonde records, Atmos. Chem. Phys., 2, 197–205, 2002,
SRef-ID: 1680-7324/acp/2002-2-197.
Teinal¨a, K., Hillamo, R., Kerminen, V.-M., and Beine, H. J.: Chem-istry and modal parameters of major ionic aerosol components during the NICE campaign at two altitudes, Atmos. Environ., 38, 1481–1490, 2004.
Toom-Sauntry, D. and Barrie, L. A.: Chemical Composition of Snowfall in the High Arctic 1990–1994, Atmos. Environ., 36, 2683–2693, 2002.
Wagenbach, D., Ducroz, F., Mulvaney, R., Keck, L., Minikin, A., Legrand, M., Hall, J. S., and Wolff, E. W.: Sea-salt aerosol in coastal Antarctic regions, J. Geophys. Res., 103, 10 961–10 974, 1998.