Integration of Acoustic Radiation Force and
Optical Imaging for Blood Plasma Clot
Stiffness Measurement
Caroline W. Wang1, Matthew J. Perez1, Brian P. Helmke1, Francesco Viola2, Michael B. Lawrence1*
1Department of Biomedical Engineering, School of Engineering and Applied Science and School of Medicine, University of Virginia Health System, Charlottesville, Virginia, United States of America, 2HemoSonics, LLC, Charlottesville, Virginia, United States of America
Abstract
Despite the life-preserving function blood clotting serves in the body, inadequate or exces-sive blood clot stiffness has been associated with life-threatening diseases such as stroke, hemorrhage, and heart attack. The relationship between blood clot stiffness and vascular diseases underscores the importance of quantifying the magnitude and kinetics of blood’s transformation from a fluid to a viscoelastic solid. To measure blood plasma clot stiffness, we have developed a method that uses ultrasound acoustic radiation force (ARF) to induce micron-scaled displacements (1-500μm) on microbeads suspended in blood plasma. The displacements were detected by optical microscopy and took place within a micro-liter sized clot region formed within a larger volume (2 mL sample) to minimize container surface ef-fects. Modulation of the ultrasound generated acoustic radiation force allowed stiffness measurements to be made in blood plasma from before its gel point to the stage where it was a fully developed viscoelastic solid. A 0.5 wt % agarose hydrogel was 9.8-fold stiffer than the plasma (platelet-rich) clot at 1 h post-kaolin stimulus. The acoustic radiation force microbead method was sensitive to the presence of platelets and strength of coagulation stimulus. Platelet depletion reduced clot stiffness 6.9 fold relative to platelet rich plasma. The sensitivity of acoustic radiation force based stiffness assessment may allow for study-ing platelet regulation of both incipient and mature clot mechanical properties.
Introduction
The formation of a blood clot through the interaction of platelets, fibrin polymers, and the ves-sel wall is the primary mechanism by which the body arrests blood loss after injury. Platelet ac-tivation, fibrinogen polymerization and fibrin fiber crosslinking alter the mechanical
properties of blood within minutes from those of a viscous fluid to that of a viscoelastic gel [1,2]. Effective blood clot formation therefore requires an increase in material stiffness, a char-acteristic that can be correlated with clinical coagulopathies [3,4].
OPEN ACCESS
Citation:Wang CW, Perez MJ, Helmke BP, Viola F, Lawrence MB (2015) Integration of Acoustic Radiation Force and Optical Imaging for Blood Plasma Clot Stiffness Measurement. PLoS ONE 10(6): e0128799. doi:10.1371/journal.pone.0128799
Academic Editor:Omolola Eniola-Adefeso, University of Michigan, UNITED STATES
Received:July 22, 2014
Accepted:April 30, 2015
Published:June 4, 2015
Copyright:© 2015 Wang et al. This is an open access article distributed under the terms of the Creative Commons Attribution License, which permits unrestricted use, distribution, and reproduction in any medium, provided the original author and source are credited.
Data Availability Statement:All relevant data are within the paper and its Supporting Information files.
Funding:The authors acknowledge grant support from the National Institutes of Health (1R01EB005433 (MBL), 4R44DK085844 (FV), and 5T32GM080186 (JB)). The funders had no role in study design, data collection and analysis, decision to publish, or preparation of the manuscript.
Ex vivoblood clot mechanical properties have been correlated with a number of disease states. Inadequate clot stiffness, manifested as a 'soft' clot, is characteristic of hemorrhagic dis-orders such as hemophilia and has been correlated with surgical bleeding in cardiopulmonary bypass [5,6]. 'Hard' clots, by contrast, have been linked to the formation of thrombi in stroke, myocardial infarction, and deep vein thrombosis [1,7–10].
The relationship between clot mechanics and vascular diseases underscores the importance of identifying the contributory roles of platelets and fibrin to hemostasis. Severalex vivo me-chanical tests of clot stiffness have successfully transitioned into the clinic, most notably the thromboelastogram (TEG) and rotational thromboelastometry (ROTEM). Measurement of bulk clot stiffness by either the TEG or ROTEM can be structured as a differential test to assess the relative contributions of platelets and plasma factors to overall clot stiffness [11–13].
There are a number of new technologies that are being developed based on diverse ap-proaches to look at the dynamics of blood clotting bothin vivoandex vivo. Dynamic light scat-tering analysis has been used to measurein vivothe clotting of blood by comparing motion of RBCs in flow or in stasis [14] and laser speckle rheology has been used to correlate changes in light scattering speckle intensity with viscoelastic property changesex vivo[15]. A novel ap-proach that combines laser detection of material motion and mechanical oscillation of the blood sample is RheoSpectris [16]. Ultrasound imaging has been used for detection of material strains in tissue following external application of force [17,18]. In addition there are multiple microelectromechanical systems (MEMS) technologies that incorporate microcantilever or pi-ezoelectric approaches to measure the changes in material properties of bloodex vivo[19,20]. Recently developed high resolution measurements of individual platelet contractility and fibrin fiber stiffness have given additional insight into the cellular and molecular basis of clot me-chanics, though single cell and molecule assessments have yet to be linked to global or bulk rhe-ological properties of clots [9,21]. The majority of viscometric assessments of clot rheology require removal of a blood sample from the subject for analysis and therefore may not capture fully the pathophysiology of an arterial or venous clot in situ. Within this admittedly severe limitation,ex vivoapproaches to studying blood clotting can give significant insight into de-tailed molecular and cellular mechanisms that regulate coagulation.
In contrast to approaches to assessex vivoblood clot stiffness based on either light scattering or mechanical testing, ultrasound can assess tissue stiffness by generation of acoustic radiation force (ARF), which transfers momentum from the ultrasound waves to the propagating medi-um and any embedded reflective or absorptive objects [22,23]. ARF has been previously used to characterize the viscoelastic properties of various biological tissues including the liver, tumor tissue, and the vitreous body of the eye [24–27]. In a more recent development to assess viscoelastic properties of blood, ultrasound ARF is coupled with echo time delay estimation of red blood cell displacement in a technique called sonorheometry [28–30]. Other technologies that employ ultrasound in their approach to detect material properties of blood include super-sonic shear imaging [31].
Here we describe the development of an optical ARF-based method of strain application to blood plasma clots such that the contributions of platelets and fibrin to its mechanical proper-ties can be individually assessed (Fig 1a). Acoustically reflective microbeads were embedded in the clot to act as force transducers and strain gauges. Ultrasound ARF was then used to induce bead displacement within a plasma sample that was then tracked by video microscopy to evalu-ate clot stiffness (Fig 1b). The focal point of the ultrasound transducer corresponded to a mi-croliter-sized region of a blood clot that was positioned away from container walls so that it acted on a relatively small numbers of platelet clusters within the 3D clot matrix. ARF was con-trolled to generate rapid and highly transient (subsecond) mechanical strains of a few 10s of microns to quantify local plasma clot stiffness. Because the method perturbed a small clot
region and applied small strains, it measured blood clot stiffness at an intermediate length scale between the milliliter volumes of conventional rheometric approaches and single molecule and cell approaches such as optical tweezers or atomic force microscopy (AFM). ARF-based assess-ment of clot stiffness may therefore be useful for investigating the cooperative role of platelet signaling and fibrin dynamics in the elastic transformation of a blood clot.
Methods
Ethics statement
All participants provided written signed informed consent after explanation of study proce-dures. Experiments and study protocol as described in IRB-HSR # 12600 were approved by the Institutional Review Board for Health Sciences Research of the University of Virginia.
Experimental setup
The experimental setup (Fig 1a) consisted of a platform, which positioned the ultrasound transducer relative to the microscope objective at the transducer focal distance. The sample was held in place over the objective and acoustically coupled to the transducer with ultrasound gel (Aquasonic, Parker Laboratories, Fairfield, NJ, USA). The sample container was slightly larger than the transducer diameter in order to minimize beam interference with the container walls. A 2.54 cm square polystyrene box (8.2 mL) (Ted Pella, Redding CA, USA) was used to hold the fluid or plasma sample. An acoustically absorbent V-shaped polydimethylsiloxane form (seeS1 Fig) was inserted into the box to minimize acoustic reflections and reduce the re-quired sample volume to 2 mL. A 10 MHz single-element focused transducer (model
IBMF103, NDT Systems, Huntington Beach, CA, USA) was coupled to the sample holder with ultrasound gel. The 10 MHz transducer had a diameter of 9.5 mm and a focal length of 19 mm. The transducer and sample holder were held in place by a custom stage mounted on an air table. The sample holder was mounted above a microscope (Diaphot 300, Nikon, Melville, NY, USA) with a 10 X microscope air objective, which permitted focusing into the sample at vary-ing depths. For optimal foci alignment of the ultrasound beam with the objective plane of focus, the optical focal plane was fixed at 1300μm above the sample holder surface for all stiff-ness measurements. The effect of different optical focal depths on bead displacement was in-vestigated and the analysis is included inS2 Fig. The motion of beads dispersed within the sample was acquired at 30 fps by a video camera (Canon Vixia HF S21, Canon, Melville, NY, Fig 1. Acoustic Radiation Force (ARF) based clot stiffness measurement.(a) The ARF based measurement setup used a 10 MHz ultrasound transducer to apply ARF to blood plasma in which beads were suspended. A microscope with 10 X objective and video camera had a mutual focus with the ultrasound transducer so application of ARF to the sample was imaged. (b) To assess blood plasma stiffness: 1) Video microscopy of the blood plasma sample was collected during application of ARF, 2) The bead motion due to applied ARF was tracked by an ImageJ program, 3) Displacements during the ARF pulse interval were determined, and 4) The displacement data was analyzed for the sample’s viscoelastic parameters.
USA) mounted to the microscope camera port. As beads experiencing ARF move more slowly than material shear waves due to their size relative to fundamental material components (e. g. molecules, fibers), standard frame rate (30 fps) video microscopy can be used to assess bead trajectories with a high degree of precision.
An acoustic beamforming model
The ultrasound beam intensity and pressure profiles were modeled using Field II ( http://field-ii.dk/), a well characterized ultrasound simulation tool [32]. The example code provided by the designer for producing intensity and pressure profiles, calc_int.m, was modified for the specific transducer specifications and settings used in this study: transducer center frequency (10 Mz), transducer radius (9.525 mm), focal length (19.05 mm), cycles per pulse (8), pulse repetition frequency (7.5 kHz), number of elements (1). The transducer aperture was modeled using the function xdc_concave. The intensity was set to 202 W/m2in order to match the peak pressure 2.5MPa to that which was measured with the hydrophone. The program then generated simu-lated beam intensity and pressure profiles.
Bead tracking and processing of displacement data
Two methods of single particle tracking implemented in the image processing software ImageJ (NIH, Bethesda, MD, USA) were used to quantify bead displacement due to incident ARF: a manual particle tracking protocol and an automated tracking algorithm [33]. Manual tracking was used when bead velocities were greater than 400μm/s and the automated algorithm was used in all other cases. At high velocities manual tracking was more effective due to edge detec-tion limitadetec-tions in the automated tracking algorithm. The automated tracking algorithm uti-lized a cross-correlation technique to measure sub-pixel and sub-micron displacements [34].
Manual tracking was performed using the point tool in ImageJ with the“auto-measure”and “auto-next slice”features turned on. Determination of the elastic and viscous parameters of the Kelvin-Voigt viscoelastic model from position data was performed using curve fitting with the built-in function lsqcurvefit in the computational software Matlab (Natick, MA, USA) where the lower and upper bounds for viscosity (μ) and elasticity (k) were set to 0.1 and 10pN·s·μm-1 and 0.1 and 10,000pN·μm-1, respectively.
Because beads like those used in optical ARF move much more slowly than material shear waves due to bead size relative to fundamental material components (e. g. molecules, fibers), standard frame rate (30 fps) video microscopy can be used to assess ARF induced bead motion.
Force calibration experiments
For determining stiffness and for modeling viscoelasticity, the magnitude of force applied must be known. The ARF was estimated by tracking beads and analyzing their trajectories and ter-minal velocities in known viscosity fluids. Stokes’law was applied to determine the force on an object moving through a fluid of known viscosity. We used 3 fluids with known viscosities, two NIST traceable viscosity standards (S3 and S6) (Cole Parmer, Court Vernon Hills, IL, USA) and blood plasma to calibrate ARF on the bead.
To estimate force, 15μm diameter latex polystyrene beads were suspended in the fluid sam-ples Polybead, Polysciences, Warrington, PA, USA). The S3 and S6 fluids have precisely known viscosities of 4.063 cP and 8.743 cP, respectively, at 25°C. At room temperature blood plasma has a viscosity of 1.6 ± 0.1 cP [35].
Cupertino, CA) running a Matlab/C++ program that controlled the ultrasound transducer fir-ing pattern. A 0.8μs pulse length (8 wave cycles) was applied. We define the rate of pulse gen-eration used to create an impulse sequence by a pulse repetition frequency (PRF). Pulses were generated at a PRF of 7.5 kHz over a pulse train interval of 0.5 s. Pulse train intervals were sepa-rated by 6 s of rest. In place of the custom amplifier circuit, a waveform generator and power amplifier were substituted to increase dynamic range in selected experiments.
To investigate the effect of changing the PRF on bead displacement the PRF was varied in the viscosity standards. PRFs of 15, 7.5, 3.75, and 1.875 kHz were used at a time interval of 0.5 s. The result was a total of 7500, 3750, 1875, and 937 pulses fired per burst for each
respective condition.
Measurement and analysis of ultrasound attenuation in viscosity
standards and in agarose gels
A 10 MHz ultrasound transducer for transmitting ultrasound signals and a signal receiver, ei-ther a bullet hydrophone (Onda Corporation, Sunnyvale, CA) or 10 MHz ultrasound transduc-er, were immersed in a degassed water bath. A two-axis micron precision stepper motor controlled the relative positions of the transmit transducer and the signal receiver (hydrophone or receive transducer). For measurement of ultrasound attenuation in the viscosity standards and in agarose, sample holders with varying acoustic path lengths were built (seeS3 Fig). An arbitrary waveform generator AFG 3022B (Tektronix, Beaverton, OR, USA) and 55dB amplifi-er ENI A-150 (E & I, Rochestamplifi-er, NY, USA) was used to drive the transducamplifi-er. A Lecroy 334A os-cilloscope (Lecroy, Chestnut Ridge, NY, USA) collected waveforms from each transducer or hydrophone that were transferred by GPIB to computer for analysis. The attenuation was de-termined by comparing ultrasound signal amplitudes at different path lengths of viscosity stan-dard and using analysis techniques described in a later section.
The total path length between the transmit and receive transducer or hydrophone was de-termined by the measurement of the time delay between the pulse transmission and the pulse receipt with the speed of sound in water (1497 m/s) [36]. Change in signal voltage due to signal path length within the material was determined by the average absolute value of the waveform. A trend of reduced signal voltage with material thickness was measured. The voltage attenua-tion data was used to form a system of equaattenua-tions specific for each thickness of material and solved for the attenuation coefficient of the material using the Matlab function lsqnonlin. The attenuation of water was 0.0022dB·cm-1·MHz-1[37].
Agarose gel formation
Agarose gel was made with UltraPure Agarose (Life Technologies, Grand Island, NY, USA). The agarose was added to Tris-Acetate-EDTA (TAE) buffer in proportions to generate a 0.5 wt % gel in an Erlenmeyer flask. The solution was heated for 30 s in the microwave and then poured into either a 2.54 cm or 10 cm square polystyrene box to a volume appropriate for the thickness of gel desired (8.2 mL or 500 mL, respectively). Agarose was allowed to cool for 1 h before removal from the mold and measurement of attenuation.
Agarose gel and blood plasma bead displacement measurement
way acoustic attenuation was minimized to increase force transmittal and permit analysis of the much stiffer agarose gel. A ziplock bag was used to enclose each sample in its appropriate buffer (TAE in the case of agarose or Dulbecco's Phosphate Buffered Saline (DPBS) in the case of plasma). The sample was then aligned at the mutual focus of the 10 MHz transducer and a 40 X water immersion microscope objective. The fluorescent beads allowed imaging in a turbid gel. For generation of ARF the transducer was driven by an arbitrary waveform gen-erator AFG 3022B (Tektronix, Beaverton, OR, USA) and 55dB amplifier ENI A-150 (E & I, Rochester, NY, USA).
Bead sedimentation velocity measurement
Bead sedimentation velocity was determined experimentally in citrated platelet rich plasma (PRP) by measuring bead time of flight over the thickness of a gasket in a flow chamber. The gasket thickness allowed for precise measurement of distance travelled due to gravity from one surface to the other.
Blood clotting experiments
Blood was collected from two healthy volunteers using the protocol described in IRB-HSR # 12600 in 2.7 mL citrated 3.2% Vacutainer tubes (BD, Franklin Lakes, NJ, USA). Blood drawn by venipuncture resulted in more variable levels of platelet activation, hence the use of Vacu-tainers for sample acquisition. The blood was centrifuged at 100 x G for 20 min to separate phases of PRP, buffy coat, and red blood cells. To obtain PRP, the supernatant of the centri-fuged samples was collected by pipette. An additional centrifugation step of 2000 x G for 40 min was used to obtain platelet poor plasma (PPP). Samples consisted of 2 mL of fluid volume mixed with 0.5 x 10⁶/ mL of 15μm diameter latex polystyrene beads (Polybead, Polysciences, Warrington, PA, USA). Plasma samples were pipetted into the experimental sample chamber. To initiate clotting, samples were recalcified with CaCl2(Sigma, St. Louis, MO, USA) to bring
the PRP to a concentration of 9.525 mM CaCl2. Kaolin (JT Baker, VWR, Radnor, PA, USA)
was added to a final concentration of 5μg/mL, except where otherwise noted. Clotting and the ARF pulsing sequence were initiated within 15 s of kaolin addition. Particle motion within the sample was recorded for 30 s intervals every 3 minutes throughout the initial 30 min of clotting for each sample.
Results
Spatial distribution of acoustic radiation force
Region of bead displacement
The bead displacements during application of a 7.5 kHz ARF impulse were tracked by video microscopy (Fig 1b). Bead displacements were measured by recording trajectories in a S6 vis-cosity standard (8.743 cP at room temperature). Maximum bead displacement (Dm) induced
by an ARF impulse relative to position in the pressure field is shown inFig 2c. Since the ultra-sound beam has an approximately Gaussian power distribution with respect to its axis, we an-ticipated that there would be a gradient in the bead displacements across the microscope's 10 X objective field of view. As expected bead displacements were largest at the center of the trans-ducer focus and smallest near the edges (Fig 2c). The average of the maximum bead displace-ment due to application of an ARF impulse (Dmavg) was 206.2 +/- 62.6μm (n = 60). The distribution of Dmacross the field of view (1 x 2 mm) was approximately Gaussian (Fig 2d).
Average bead displacement during the pulse approached a terminal velocity within 0.1 s of pulse initiation (Fig 2e).
Bead sedimentation
To control for bead sedimentation effects in clotting plasma prior to reaching the gel-point, we measured bead sedimentation velocity in citrated plasma. Bead sedimentation velocity was de-termined experimentally in anti-coagulated platelet rich plasma (PRP) by measuring settling time. The 15μm polystyrene beads settled at an average velocity of 3.84 +/- 0.15μm/s (n = 250). The distance a bead fell during a 0.5 s pulse train was approximately 1.92μm. The bead sedimentation distance constituted a 0.5% change in bead position within the -6 dB lateral beam depth (400μm). Because bead sedimentation was small relative to the beam diameter, and sedimentation would be abolished once the clot was past the gel-point, it was assumed to negligibly influence observed bead trajectories.
Fig 2. Ultrasound transducer pressure field and bead displacement in a viscous fluid.(a) The pressure field of the 10 MHz focused ultrasound transducer at the focal length (19mm) was simulated in Field II software. (b) Hydrophone measurements of the acoustic pressure produced by the ultrasound transducer were used to determine the -6 dB lateral beam width (400μm) and the -6 dB axial beam length (5 mm) at the focus. The microscope field of view is shown. Inb&c, the y-axis is expanded in the interest of clarity. (c—e)
The microscope field of view was positioned on the beam focus by centering over the largest bead displacements. The ARF induced displacement of 15μm beads was analyzed in the S6 viscosity standard (8.743 cP). Bead displacement was measured during the 0.6 s ARF pulse interval,Δt = tf-tiwhere maximum
displacement Dmwas determined at tf.
Magnitude of force application
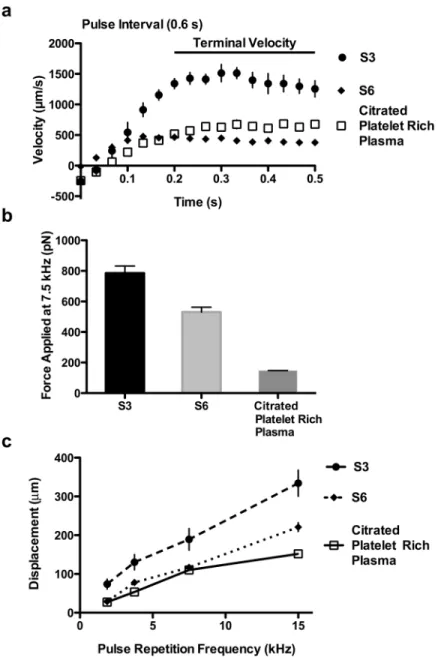
The magnitude of ARF applied to beads in clotting blood plasma was estimated by measuring displacements in citrated PRP and correlating motion to force using Stokes’law (Eq 1). Bead motion in citrate anticoagulated PRP was compared to that in viscous standards. Terminal bead velocities during ARF application were measured (Fig 3a) and Stokes’law for drag force Fig 3. The effects of attenuation and pulse repetition frequency (PRF) on bead velocities and force magnitude.(a) Bead terminal velocities under applied ARF at 7.5 kHz PRF in the viscosity standards S6 (8.743 cP) and S3 (4.063 cP), and in citrated platelet rich plasma were measured. Standard error is shown with n = 10 beads. (b) Applied ARF magnitude at 7.5 kHz was determined using Stokes’law and terminal bead velocities. Distinct acoustic attenuations between the fluids account for much of the difference in the applied force in the fluids. At 7.5 kHz the force applied in citrated blood plasma was estimated to be 147 pN. Standard error is shown with n = 10 beads. (c) Bead displacement after 0.3 s of pulsing due to applied ARF increased linearly with increasing PRF in the three fluids. Standard error is shown with n = 9 beads.
was used to calculate the force applied to the beads (Fig 3b) [38]. Stokes' law is:
F¼6p mRv ð1Þ
whereFis the force applied to the beads,μis thefluid viscosity,Ris the bead radius, andvis the bead terminal velocity [39]. The bead terminal velocities in the viscosity standards S6 (8.743 cP at room temperature) and S3 (4.063 cP at room temperature) and citrated PRP (1.6 cP at room temperature) [35] were 429.4 +/- 57.2μm/s, 1367.4 +/- 256.4μm/s, and 646.5 +/-120.4μm/s respectively. From Stokes' law (Eq 1) it was determined that the force magnitude applied at 7.5 kHz pulse repetition frequency on the beads in S6, S3, and citrated PRP was 530.7 +/- 70.7 pN, 785.4 +/- 147.3 pN, and 147.0 +/- 27.2 pN respectively (Fig 3b). The differ-ences in the applied force on the beads may reflect differences in the degree of ultrasound at-tenuation between the threefluids, so attenuation of the viscosity standards was measured.
The relationship between attenuation and force magnitude
All materials attenuate acoustic waves [22]. The attenuation in S6 and S3 viscosity standards and in the agarose elastic standard was measured to determine the influence of attenuation on force experienced by the beads. Acoustic signal amplitudes in the viscous and elastic standards were measured to determine attenuation and force applied to the beads for each material.
The attenuation coefficient of a material is described by the equation
Vf Vi
¼10 alf=10
ð2Þ
where Viis the voltage of the signal before entering the material, Vfis the voltage of the signal
after traveling a distance (l) through the material,fis the frequency of the signal, andαis the attenuation coefficient. The transducer frequency (f) was 10 MHz and the acoustic path length (l) in the sample was 1.9 cm.
Change in signal voltage due to signal path length and material attenuation was determined by the average absolute value of the waveform. In all samples signal voltage decreased linearly with thickness. With the voltage attenuation data, a version ofEq 2specific for each thickness of material was established. The system of equations was solved for the attenuation coefficient of the material using the Matlab function lsqnonlin. The attenuation of water was set to a previous-ly reported value (0.0022dB·cm-1·MHz-1) [37]. The attenuation coefficient of 0.5% agarose was found to be 0.0109dB·cm-1·MHz-1. The attenuation coefficients of the S3 and S6 viscosity stan-dards were determined to be 0.0764dB·cm-1·MHz-1and 0.1056dB·cm-1·MHz-1, respectively.
Eq 2, which describes attenuation of ultrasound signal voltage, can be extended to reflect a proportional change in applied force with the change in voltage across a signal path length within the material, such that
Ff Fi
¼Vf
Vi
¼10 alf=10
ð3Þ
whereαis the material attenuation,Fiis the ideal (non-attenuated) force delivered by the trans-ducer,Ffis the force calculated on beads in the material from Stokes’law (Eq 1) [40], Viis the
voltage of the signal before entering the material, Vfis the voltage of the signal after traveling a
distance (l) through the material, andfis the transducer frequency. The lower ultrasound at-tenuation of S3 compared to S6 was consistent with the greater force experienced by beads in the S3fluid than in the S6fluid.
in each material are equal
Fmaterial1
Fi
Fmaterial2
Fi
¼Fmaterial1 Fmaterial2
¼10 a1lf=10=10 a2lf=10 ð
4Þ
whereFmaterial 1is the force on beads in a material,Fmaterial 2is the force on beads in a second material,α1andα2are the attenuation coefficients for the respective materials,f isthe trans-ducer frequency andlis the acoustic path length.
The expected force differential between S6 and S3 viscosity standards was determined from the attenuation coefficients measured previously usingEq 4such that
FS6 FS3
¼10
aS6lf 10
10
aS3lf 10
¼0:630
0:715¼0:881 ð5Þ
The statistically bounded range of the FS6to FS3ratio using bead displacement analysis by
Stokes’law was
FS6 FS3
¼ 530:770:7pN 785:4147:3pN¼
0:493 0:942 ð6Þ
Since the ratio predicted by thefluid attenuations was within the Stokes analysis range, the agreement of the force and attenuation measurements suggested thatfluid attenuation ac-counted for the difference in force (Ff) experienced by the beads in their respectivefluids.
The lower force experienced by beads in citrated PRP relative to S3 or S6 standards predicts that blood plasma has a greater attenuation than S3 and S6 viscous standards, or even a 0.5% agarose gel. Previously reported attenuation coefficients (α) for unclotted and clotted blood plasma are 0.104dB·cm-1·MHz-1and 0.126dB·cm-1·MHz-1respectively [41]. The expected force differential between clotted and unclotted plasma was determined from the attenuation coefficients measured previously usingEq 4such that
Fclotted Funclotted
¼ 10
aclotted lf 10
10
aunclotted lf 10
¼0:575
0:634¼0:907 ð7Þ
As the relative difference between the estimated force acting on a bead in clotted and unclotted plasma differs by less than 10% based on the relationship between force and attenua-tion described inEq 4, we chose to use the average of the two coefficients for all plasma condi-tions. Therefore, given the assumption of constant attenuation coefficient 0.115dB·cm-1·MHz-1, a constant force of 147 pN at 7.5 kHz PRF was assumed for all blood plasma material property measurements with the optical ARF technique.
The relationship between pulse repetition frequency (PRF) and force
magnitude
Based on previous ARF theory [29], we hypothesized that varying the PRF (the number of ul-trasound impulses applied within one second) would adjust the force applied to the beads and lead to a corresponding modulation of bead displacements. To test our hypothesis the PRF was varied in the S3 and S6 viscosity standards and in citrated PRP (Fig 3c). Material stiffness was correlated with PRF and bead displacement by the equation
Dm/
PRF
whereDmwas the maximum displacement of the bead after the ARF impulse,Swas material stiffness, andPRFwas the pulse repetition frequency of the material [28]. Reducing thePRF re-sulted in a linear reduction in the bead displacements, consistent with theory (Eq 8).
Viscoelastic measurement of platelet poor plasma (PPP) clotting
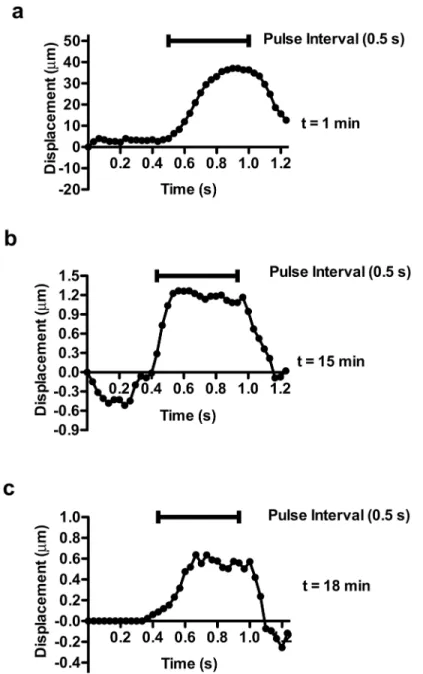
Fibrin contributions to stiffness were assessed by removing platelets from plasma through cen-trifugation to generate PPP. Bead displacement due to ARF pulsing decreased over the course of 17 min (Fig4a–4c). Signs of increasing elasticity developed early after clot initiation; within 1 min of kaolin activation beads recoiled after removal of an ARF impulse (Fig 4a). Based on bead velocities, the PPP sample at 1 min had aRe~ 0.07 [39], suggesting that the sample was experiencing significant viscous damping of the developing elastic response, characteristics of a viscoelastic fluid. At later time points, the Reynolds number reduced further (Re<0.002) as the viscosity increased and the velocity of the beads was reduced (Fig4band4c). At 15 (Fig 4b) and 18 (Fig 4c) min the beads reached a plateau of maximum displacement during the ARF im-pulse, recoiling 100% after force application stopped, indicative of a high degree of
material elasticity.
Viscoelastic model fitting of platelet poor plasma
Clot stiffness in PPP was determined by the equation:
S¼ Fplasma
Dm
ð9Þ
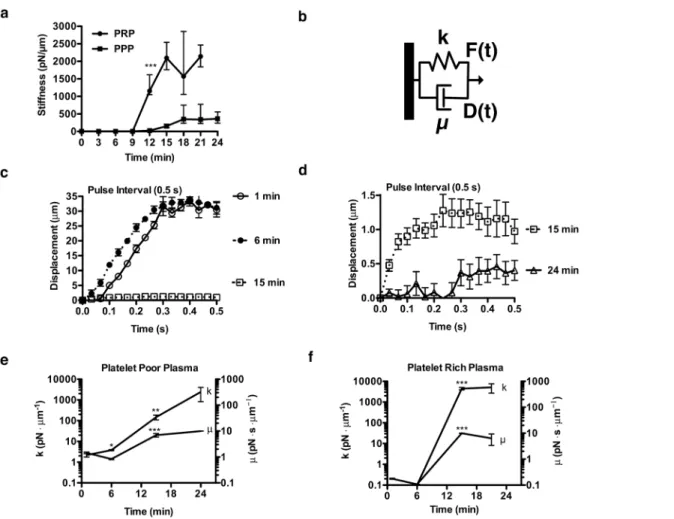
whereSis the clot stiffness,Fplasmais the ARF applied to beads in plasma, andDmis the average of bead maximum displacements after application of 0.5 s of an ARF pulse (Fig 5a). As a form of Hooke’s law, the inverse relationship between applied force and resultant displacement
de-fines stiffness (S) (Eq 9) [42]. Acoustic radiation force has been used in defining material stiff-ness in previous work [29]. The clot appeared to have near constant stiffness from 0–9 min and then stiffness increased 78-fold between 9 and 18 min. In order to quantify the changes in vis-cous and elastic components of the plasma during clotting the displacement data wasfitted with the Kelvin-Voigt model.
The Kelvin-Voigt model consists of a spring and a dashpot in parallel (Fig 5b). The spring constant, viscous dashpot constant, and the equation that defines the system together describe the displacement of the point of interest due to a given force. To evaluate the viscoelastic prop-erties the characteristic equation for the Kelvin-Voigt model was fit to the displacement data during the application of a pulse train (see the Methods bead tracking section). The Kelvin-Voigt model captures the coupled effects of viscosity and material elasticity on force-induced material displacements and has been widely used in biological materials modeling [43].
Assumptions of the Kelvin-Voigt model include application of constant force, which is ap-propriate if the analysis is limited to the displacements measured during the pulse train inter-val. The force applied on the blood plasma sample can be considered constant during a pulse train interval because the ratio of the time constant of blood plasma viscoelastic response (~0.01 s) [44–46] to the pulse repetition period (~10-4s/cycle) is so large. Tissue (or blood clot) movement is negligible between each impulse, and therefore during the microsecond pulse train application the force is effectively constant on the tissue. Momentum of the bead, because of low Reynolds number, is assumed negligible and therefore not accounted for in the model.
(Fig5cand5d). In contrast, viscous fluid-like behavior (constant velocity during impulse) was observed with bead motion in the S6 viscosity standard at all time points measured. The elastic parameter k of S6 fluid, as expected, was near zero (S4 Fig). Viscous (μ) and elastic (k) parame-ters of PPP determined by the model at 24 min were 9.999 +/- 0.001pN·s·μm-1and 2430 +/-1600pN·μm-1respectively (Fig 5e). This is an increase in viscous and elastic parameters of 6.9 fold and 1107 fold respectively from unclotted PPP. The clot properties changed most signifi-cantly between 6 and 15 min, when elasticity (k) rapidly increased.
Fig 4. Characteristic bead displacement due to applied ARF at 7.5 kHz in clotting platelet poor plasma. (a) At t = 1 min the bead displaced 40μm during a 0.5 s pulse interval and recoiled after the pulse stopped. (b) At t = 15 min the bead displaced 0.9μm during the pulse interval and recoiled after the pulse stopped. (c) At t = 18 min the bead displaced 0.5μm during the pulse interval and recoiled after the pulse stopped. Optical noise was reduced by smoothing with a 3 data point moving average filter.
Platelet depletion and clot stiffness
Stiffness of PPP samples was compared to that of PRP to assess platelet contributions to clot stiffness (Fig 5a). PRP increased clot stiffness 6.9 fold relative to PPP. Where significant elastic-ity developed, beads in both PPP and PRP recoiled after ARF induced displacement (Fig 4), a hallmark of reversible elastic deformation. Viscous (μ) and elastic (k) parameters determined by the model at 21 min in PRP are 6.364 +/- 2.988pN·s·μm-1and 5127 +/- 2440pN·μm-1 re-spectively (Fig 5f). To assess the clot properties of PRP after initial hemostasis, the average fold difference of viscous (μ) and elastic (k) parameters of the clot as compared to PPP between 15 and 21 min were 1.3 fold and 11 fold larger, respectively. In PRP, elasticity and viscosity both developed most significantly between 9 and 15 min, paralleling the kinetics of viscosity and elasticity changes in clotting PPP. Video of PRP clotting is available inS1 Video.
Fig 5. Characteristic mechanical properties of clotting platelet rich (PRP) and platelet poor plasma (PPP) as assessed by application of ARF at 7.5 kHz.(a) Clot stiffness (S), S(t) = Fplasma/Dmavg, of clotting PRP and PPP was determined. Bead displacements (n = 5) were averaged to compute stiffness,
which is displayed with 60% quartiles (***, p<0.0005 between PPP and PRP from t>12 min). (b) In the Kelvin-Voigt model, which predicts the displacement D(t) response of viscoelastic materials to applied force F(t), a viscous element (dashpot) is in parallel with an elastic element (spring). The parameters k andμ describe the elastic and viscous properties respectively. (c-e) The Kelvin-Voigt model was fit to bead displacement data in clotting PPP (c) where
displacement decreased abruptly between 6–15 min. (d) From 15–24 min the model was fit to bead displacement data and displacement continued to decrease. At all time points, in contrast to measurements in the viscous fluids, the displacement approached a maximum. Standard error is shown with n = 5 beads per time point. (e-f)Kelvin-Voigt viscous (μ) and elastic (k) parameters of PPP and PRP were determined. Standard error is shown with n = 5 beads per time point (*, p<0.05)(**, p<0.006)(***,p<0.0005). (e) During clotting in the PPP sample the Kelvin-Voigt viscous (μ) and elastic (k) parameters increased 1107 fold and 6.9 fold respectively. (f) During clotting in the PRP sample the average fold difference of viscous (μ) and elastic (k) parameters of the clot as compared to PPP between 15 and 21 min were 1.3 fold and 11 fold larger, respectively.
Measuring stiffness ratio of agarose elastic standard to blood plasma
For interpretation of the measurements made by the optical ARF method relative to standard material property testing techniques, the stiffness of PRP was related to that of a 0.5 wt % aga-rose elastic standard. Both PRP and agaaga-rose have been measured by standard material property testing techniques such as the parallel plate rheometer. Stiffness comparison required the previ-ously determined attenuation coefficients for plasma and agarose. The range of reported shear modulus of 0.5 wt% agarose is 1400–4530 Pa [49–52]. Previously reported shear moduli of PRP range from 406–600 Pa [11,53,54]. The ratio of the shear moduli of 0.5 wt% agarose to PRP as previously reported ranges from 2.3–11.2.
The ratio of stiffness of 0.5 wt% agarose and PRP measured by our optical ARF technique was compared directly to the ratio of previously reported shear moduli in order to validate the material property measurement capabilities of the optical ARF technique.
The expected force differential between PRP and agarose was determined from the attenua-tion coefficients measured previously usingEq 4such that
Fplasma Fagarose
¼10
aplasma lf 10
10
aagaroself
10
¼0:588 0:953¼
0:617 ð10Þ
With the difference in force application between PRP and agarose determined, the displace-ments of beads in each material were measured. The beads in PRP were displaced 8.25 +/-0.91μm and those in agarose were displaced 1.369 +/- 0.13μm. In order to compare the stiff-ness of the plasma to that of agarose the following equation was used
Sagarose Splasma
¼Fagarose
Fplasma
dplasma
dagarose
ð11Þ
where Sagaroseis the stiffness of agarose, Splasmais the stiffness of plasma, dagaroseis the bead
dis-placement in agarose, and dplasmais the bead displacement in plasma. UsingEq 11the 0.5 wt %
agarose gel was approximately 9.8 fold more stiff than a clotted PRP sample. This was within the ratio range (2.3–11.2) of the shear moduli reported previously for 0.5 wt% agarose and clot-ted PRP in independent determinations.
Measurement technique sensitivity to strength of clotting stimulus
Clotting of PRP was stimulated over a range of kaolin concentrations to assess the sensitivity of the optical ARF based clot stiffness assessment technique to strength of clotting stimulus (Fig 6). The measurements showed the capability of the ARF based bead-tracking technique to detect differences in kinetics of stiffness development that occur with variation in coagulation stimulus.
Discussion
rheometric techniques. Optical measurement of ARF-induced bead displacement (optical ARF) to assess blood plasma viscoelasticity was sensitive to biologically relevant characteristics of blood clotting such as strength of activation stimulus and platelet stiffness contributions.
ARF generation requires ultrasound scatterers in the material to reflect and absorb energy. While the material itself experiences force, additional scatterers, such as embedded beads, sig-nificantly increase force application. ARF results from the millisecond integration of thousands of individual acoustic pressure waves into what is effectively a sustained impulse. Pressure wave integration occurs because the pulse repetition period (~10-4s/cycle) is much smaller than the time required for tissues to relax between acoustic pulses (~1 ms) [44–46]. Key to the utility of beads as force transducers are their greater attenuation of acoustic energy compared to the suspending medium, a difference of approximately 6-fold for polystyrene beads relative to plasma [55]. The bead radius is another significant determinant of optical ARF, as surface area is directly proportional to the resultant force [56]. A related application of ARF to blood clot stiffness estimation, sonorheometry, relies on the red blood cells at the beam focal point to reflect ultrasound and act as force transducers [28–30].
While material attenuation and bead radius influence the transmittal of ARF, ultrasound wave characteristics also affect the resultant force. Variation of pulse repetition frequency (PRF) was shown to proportionally modulate the force on the bead. By varying the PRF, the force per bead could be varied from 10–294 pN. These forces are on the order of those required Fig 6. Sensitivity of optical ARF clot stiffness assessment to strength of kaolin clotting stimulus.Clot stiffness of PRP stimulated with 0.5, 5, and 50μg/mL kaolin was measured by optical ARF. Optical ARF detected kaolin concentration dependent kinetics of clot stiffness. Standard error is shown with at least n = 5 beads per time point.
for rupture of a fibrin fiber bond (200 pN) or to stretch a monomer in a fibrin fiber to 100% strain (140 pN) [57,58]. Since rupture of fibrin fibers in a network requires greater force than that needed to rupture a single fibrin bond, we assume the forces applied by ARF in this study to be largely non-destructive to the fibrin network, allowing evaluation of its viscoelasticity.
The assessment of plasma clot viscoelasticity by optical ARF was further validated by com-parison with an elastic standard, agarose. Stiffness measurements of PRP, PPP and agarose were compared shear moduli determined in conventional rotational rheometers. In our case, agarose was determined by optical ARF to be 9.8-fold stiffer than PRP. This stiffness ratio was used to estimate a shear modulus ratio of agarose to PRP. Assuming the relationship was ap-proximately proportional, the known shear modulus of 0.5% agarose ranging from 1400–4530 Pa would predict a shear modulus range of 143–462 Pa for PRP [49–52,59]. The estimate of the shear modulus for PRP was on the order of the 406–600 Pa range estimated in previous reports at equivalent times [11,53,54]. The 6.9 fold stiffness ratio of PRP to PPP measured by optical ARF was also of similar proportion to the reported stiffness ratio of 8.6 measured with the par-allel plate rheometer [11]. Optical ARF estimates of stiffness therefore scales closely to a classic rheologic test and therefore can be extrapolated, within appropriate limitations, to a wider range of biologic testing of plasma blood clotting mechanics.
With the use of optical ARF there are several considerations that may confound the interpre-tation of the results. For instance, Brownian motion of the embedded bead could conceivably in-fluence the estimation of the ARF-induced viscoelastic response. However, the diffusion coefficient of a 15μm diameter bead in blood plasma was estimated to be 2.6 × 10⁻¹⁴m2/s, and therefore the average bead would move only 0.33μm/s [39,60,61]. Brownian motion was there-fore considered to contribute negligibly in unclotted blood plasma relative to ARF induced bead displacement (>100μm). Once a fibrin network has formed the bead diffusivity would drop even further. A related factor that could influence the interpretation of bead motion is the relative size of the beads compared to the fibrin network pore size and potential molecular interactions between bead and fibrin. However, polystyrene beads have been shown to non-specifically adhere to fibrin fibers [21] and the bead size (15μm) is more than an order of magnitude larger than es-timates of the fibrin mesh pore size (0.6μm) [62], suggesting that the beads are likely trapped in the gel by adhesion and physical entanglement. Another potential concern is that bead motion under the influence of shear waves would be too fast to be captured at standard video rates. How-ever, the maximum velocity at which beads moved when unconstrained in plasma was 600μm/s, thus their frame to frame displacement was ~ 20μm—a distance easily resolvable by microscopy. A final point of consideration is the potential effect of the beads on the coagulation process. Embedding beads in a blood sample reduced time to clot and increased clot stiffness in a sonor-heometry measurement (seeS5 Fig), However, in our study, the presence of the beads was a con-stant and thus all samples experienced the same level of contact-pathway stimulation.
The detection of viscoelastic material properties by ARF-induced bead motion has several experimental limitations. For one, a microscope-based bead tracking approach has an inherent stiffness detection limit defined by video resolution and the optical signal to noise ratio; i.e, once the gel becomes very stiff relative to the force on the bead, motion stops. Further increases in gel stiffness are undetectable. However, improved signal detection can be achieved by in-creasing transducer power to increase bead displacement or by raising microscope magnifica-tion to increase spatial resolumagnifica-tion. Increases in plasma clot turbidity, which becomes a
significant optical limitation after 45 minutes, can also reduce bead displacement measurement accuracy. In this study, we used fluorescent beads to allow optical ARF analysis at advanced stages of PRP clot development (~1 h).
of large strains (>10–100%) [58,63–65]. A component of the strain hardening is thought to be a consequence of network deformation such that the slack is essentially taken out of the fibrin fibers. In platelet-rich plasma clots strain hardening does not occur [63], possibly by platelets pre-tensioning the network. Consequently, at low strains a PRP clot will have a larger elastic modulus than a PPP clot. But at progressively higher strains the difference between the two de-creases as the PPP clot strain hardens, eventually becoming almost equivalent to PRP at strains of 20% and greater. Rotational rheometers such as thromboelastography (TEG) and rotational thromboelastometry (ROTEM), which introduce strain at levels of 8–16%, could therefore po-tentially strain-harden of blood clots as they assess viscoelasticity. Under conditions where strain-hardening occurs, platelet contributions to clot stiffness may be less evident [53,66,67].
When PRP and PPP clots have been compared in the TEG assay, it has been observed that the stiffness ratio varies from 1.2–4 fold using TEG maximum amplitude (MA) assessment, de-pending on laboratory [68–71]. In contrast, the optical ARF method described here indicated the presence of platelets increased the clot stiffness by 6.9 fold, which was consistent with a pre-vious study using ARF in whole blood [30]. The relative softness of the ARF probe described here, where induced strains were 2% or less, may therefore be useful in the analysis of platelet contributions to fibrin network stiffness, as sub-optimal platelet function would conceivably be more evident in the absence of fibrin network strain hardening.
Ex vivomeasurements of clotting, such as the optical ARF method described in this study,
almost all suffer a potential limitation in accuracy with regard to inferences of coagulopathies
in vivodue to the fact that the blood sample is clotted under quiescent conditions. Since blood
clot formation under stasis may increase fibrin and decrease platelet concentration as com-pared toin vivoarterial clots [72,73], it is important to qualify interpretations of clot mechanics depending on whether the test is based on quiescent or shear conditions, and additionally how the specific magnitude of shear might influence clotting; i.e., is the shear arterial or venous? With that consideration in mind, static condition measurement techniques, such as optical ARF, may be more appropriate when assessing coagulopathies characterized by venous flows, trauma, or surgical bleeding.
Optical ARF viscoelasticity measurements as described in this study appeared to be sensitive to both the contribution of platelets to clot stiffness and the level of clotting stimulus. Conse-quently, the approach could potentially be employed for studies on early stages of clot forma-tion, which likely involves activation of the platelet contractile apparatus in addition to contributions of fibrin polymerization [74]. In addition, ARF measured platelet contributions to stiffness in a 3D clot matrix rather than on a surface, differentiating it from direct measures of platelet contractility such as micropost and AFM assays that typically require testing of iso-lated platelets on a substrate [75,76]. During clot formation, platelet contractile activity is translated to larger length scales through fibrin filaments and concurrent platelet aggregation. The ARF method we've described here may be useful in characterizing how single platelet force generation ultimately leads to the generation of tensioned fibrin networks and clot stiffness.
Supporting Information
S1 Fig. The sample holder.The field of view for the 10 X objective is 2000μm x 1200μm. The shape of the PDMS mold works to reduce volume requirements for the blood sample, while the PDMS material properties allow it to act as an ultrasonic absorber reducing
container reflections. (TIFF)
focal planes within the sample. The plane at which measurements were made in the sample was chosen at 1.3 mm above the bottom of the sample holder. At 1.3 mm backflow, bead dis-placement opposite to the direction of ultrasound beam application, likely due to convection, was not present.
(TIFF)
S3 Fig. Schematic of setup for attenuation measurement in fluids.In a water bath, a signal transmitting transducer was fired into the fluid sample at 3 path lengths of fluid. The signal re-ceiver recorded the resulting waveform. For agarose gel samples, slabs of gel were placed be-tween the transmitter and receiver in the place of the flask, with 3 thicknesses. The change in amplitude of the waveform between the path lengths of fluid or gel were used to calculate the attenuation of each material.
(TIFF)
S4 Fig. Viscoelastic measurement of viscous fluid S6.(a) The stiffness (S) of the material was determined with the force applied on beads in S6 (FS6) and the bead displacement during a 0.6
s pulse interval (Dmavg) by the equation S = FS6/Dmavg. (b-c) The Kelvin-Voigt model was fit
to the displacement during the pulse interval from which (b) viscous parameterμand (c) elas-tic parameter k were calculated, which showed, as expected, a viscous-dominated
mechanical response. (TIFF)
S5 Fig. Influence of polystyrene beads on clot stiffness.The addition of beads to whole blood samples as measured by sonorheometry resulted in increased kinetics of clot stiffness and max-imum clot stiffness as compared to whole blood samples without beads.
(TIFF)
S1 Video. Plasma clotting in optical acoustic radiation force clot stiffness assessment. Poly-styrene microbeads (15μm) in platelet rich plasma were displaced due to application of the acoustic radiation force. Bead displacement was reduced with increasing plasma clot viscoelas-ticity over the course of minutes. Clotting of platelet rich plasma was initiated with 5μg/ mL kaolin.
(MOV)
Author Contributions
Conceived and designed the experiments: CWW MJP MBL BPH. Performed the experiments: CWW MJP. Analyzed the data: FV BHP CWW MJP. Contributed reagents/materials/analysis tools: FV CWW MJP. Wrote the paper: CWW MJP MBL.
References
1. Weisel JW (2008) Enigmas of blood clot elasticity. Science 320: 456–457. doi:10.1126/science. 1154210PMID:18436761
2. Ryan EA, Mockros LF, Weisel JW, Lorand L (1999) Structural origins of fibrin clot rheology. Biophys J 77: 2813–2826. doi:10.1016/S0006-3495(99)77113-4PMID:10545379
3. Tran R, Myers DR, Ciciliano J, Trybus Hardy EL, Sakurai Y, Ahn B, et al. (2013) Biomechanics of hae-mostasis and thrombosis in health and disease: from the macro- to molecular scale. J Cell Mol Med 20: 1–18. doi:10.1111/jcmm.12041
4. Weisel J (2010) Biomechanics in hemostasis and thrombosis. J Thromb Haemost 8: 1027–1029. doi: 10.1111/j.1538-7836.2010.03808.xPMID:20149079
6. Essell JH, Martin TJ, Salinas J, Thompson JM, Smith VC (1993) Comparison of thromboelastography to bleeding time and standard coagulation tests in patients after cardiopulmonary bypass. J Cardi-othorac Vasc Anesth 7: 410–415. doi:10.1016/1053-0770(93)90161-DPMID:8400095
7. Elliott A, Wetzel J, Roper T, Pivalizza E, McCarthy J, Wallace C, et al. (2015) Thromboelastography in patients with acute ischemic stroke. Int J Stroke 10: 194–201. doi:10.1111/j.1747-4949.2012.00919.x PMID:23017088
8. Collet JP, Allali Y, Lesty C, Tanguy ML, Silvain J, Ankri A, et al. (2006) Altered fibrin architecture is as-sociated with hypofibrinolysis and premature coronary atherothrombosis. Arterioscler Thromb Vasc Biol 26: 2567–2573. doi:10.1161/01.ATV.0000241589.52950.4cPMID:16917107
9. Lam WA, Chaudhuri O, Crow A, Webster KD, Li T-D, Kita A, et al. (2010) Mechanics and contraction dy-namics of single platelets and implications for clot stiffening. Nat Mater 10: 61–66. doi:10.1038/ nmat2903PMID:21131961
10. Kashuk JL, Moore EE, Sabel A, Barnett C, Haenel J, Le T, et al. (2009) Rapid thrombelastography (r-TEG) identifies hypercoagulability and predicts thromboembolic events in surgical patients. Surgery 146: 764–774. doi:10.1016/j.surg.2009.06.054PMID:19789037
11. Jen CJ, McIntire LV (1982) The structural properties and contractile force of a clot. Cell Motil 2: 445– 455. doi:10.1002/cm.970020504PMID:6891618
12. Carr ME (2003) Development of platelet contractile force as a research and clinical measure of platelet function. Cell Biochem Biophys 38: 55–78. doi:10.1385/CBB:38:1:55PMID:12663942
13. Evans P, Hawkins K, Williams P (2006) Rheometry for blood coagulation studies. Rheology Reviews: 255–291.
14. Fine I, Kaminsky A, Kuznik B, Shenkman L (2011) A non-invasive method for the assessment of hemo-stasis in vivo by using dynamic light scattering. Laser Phys 22: 469–475. doi:10.1134/
S1054660X12020090
15. Tripathi MM, Hajjarian Z, Van Cott EM, Nadkarni SK (2014) Assessing blood coagulation status with laser speckle rheology. Biomed Opt Express 5: 817–831. doi:10.1364/BOE.5.000817PMID: 24688816
16. Schmitt C, Montagnon E, Henni AH, Qi S, Cloutier G (2013) Shear wave induced resonance elastogra-phy of venous thrombi: a proof-of-concept. IEEE Trans Med Imaging 32: 565–577. doi:10.1109/TMI. 2012.2231093PMID:23232414
17. Parker KJ, Huang SR, Musulin RA, Lerner RM (1990) Tissue response to mechanical vibrations for “sonoelasticity imaging.”Ultrasound Med Biol 16: 241–246. doi:10.1016/0301-5629(90)90003-U PMID:2194336
18. Greenleaf JF, Fatemi M, Insana M (2003) Selected methods for imaging elastic properties of biological tissues. Annu Rev Biomed Eng 5: 57–78. doi:10.1146/annurev.bioeng.5.040202.121623PMID: 12704084
19. Xu W, Appel J, Chae J (2012) Real-Time Monitoring of Whole Blood Coagulation Using a Microfabri-cated Contour-Mode Film Bulk Acoustic Resonator. J Microelectromech Syst 21: 302–307. doi:10. 1109/JMEMS.2011.2179011
20. Cakmak O, Elbuken C, Ermek E, Mostafazadeh A, Baris I, Kavakli H, et al. (2013) Microcantilever based disposable viscosity sensor for serum and blood plasma measurements. Methods. doi:10.1016/ j.ymeth.2013.07.009
21. Collet J-P, Shuman H, Ledger RE, Lee S, Weisel JW (2005) The elasticity of an individual fibrin fiber in a clot. P Natl Acad Sci USA 102: 9133–9137. doi:10.1073/pnas.0504120102PMID:15967976 22. Torr GR (1984) The acoustic radiation force. Am J Phys 52: 402–408. doi:10.1119/1.13625 23. Nightingale K, Soo MS, Nightingale R, Trahey G (2002) Acoustic radiation force impulse imaging: in
vivo demonstration of clinical feasibility. Ultrasound Med Biol 28: 227–235. doi:10.1016/S0301-5629 (01)00499-9PMID:11937286
24. Nightingale K, McAleavey S, Trahey G (2003) Shear-wave generation using acoustic radiation force: in vivo and ex vivo results. Ultrasound Med Biol 29: 1715–1723. doi:10.1016/j.ultrasmedbio.2003.08.008 PMID:14698339
25. Palmeri ML, Wang MH, Dahl JJ, Frinkley KD, Nightingale KR (2008) Quantifying hepatic shear modulus in vivo using acoustic radiation force. Ultrasound Med Biol 34: 546–558. doi:10.1016/j.ultrasmedbio. 2007.10.009PMID:18222031
26. Negron LA, Viola F, Black EP, Toth CA, Walker WF (2002) Development and characterization of a vitre-ous mimicking material for radiation force imaging. IEEE Trans Ultrason Ferroelectr Freq Control 49: 1543–1551. doi:10.1109/TUFFC.2002.1049736PMID:12484477
28. Viola F, Kramer M, Lawrence M, Oberhauser J, Walker W (2004) Sonorheometry: A noncontact method for the dynamic assessment of thrombosis. Ann Biomed Eng 32: 696–705. doi:10.1023/B:ABME. 0000030235.72255.dfPMID:15171624
29. Mauldin FW, Viola F, Hamer TC, Ahmed EM, Crawford SB, Haverstick DM, et al. (2010) Adaptive force sonorheometry for assessment of whole blood coagulation. Clin Chim Acta 411: 638–644. doi:10. 1016/j.cca.2010.01.018PMID:20096680
30. Viola F, Mauldin FW, Lin-Schmidt X, Haverstick DM, Lawrence MB, Walker WF (2010) A novel ultra-sound-based method to evaluate hemostatic function of whole blood. Clin Chim Acta 411: 106–113. doi:10.1016/j.cca.2009.10.017PMID:19861121
31. Bercoff J, Tanter M, Fink M (2004) Supersonic shear imaging: a new technique for soft tissue elasticity mapping. IEEE Trans Ultrason Ferroelectr Freq Control 51: 396–409. doi:10.1109/TUFFC.2004. 1295425PMID:15139541
32. Jensen JA, Svendsen NB (1992) Calculation of pressure fields from arbitrarily shaped, apodized, and excited ultrasound transducers. IEEE Trans Ultrason Ferroelectr Freq Control 39: 262–267. doi:10. 1109/58.139123PMID:18263145
33. Schneider CA, Rasband WS, Eliceiri KW (2012) NIH Image to ImageJ: 25 years of image analysis. Nat Methods 9: 671–675. doi:10.1038/nmeth.2089PMID:22930834
34. Cheezum MK, Walker W, Guilford WH (2001) Quantitative comparison of algorithms for tracking single fluorescent particles. Biophys J 81: 2378–2388. doi:10.1016/S0006-3495(01)75884-5PMID: 11566807
35. Shinton NK (2010) Desk Reference for Hematology. 2nd ed. Boca Raton: CRC Press.
36. Del Grosso VA, Mader CW (1972) Speed of Sound in Pure Water. J Acoust Soc Am 52: 1442–1446. doi:10.1121/1.1913258
37. Culjat MO, Goldenberg D, Tewari P, Singh RS (2010) A Review of Tissue Substitutes for Ultrasound Imaging. Ultrasound Med Biol 36: 861–873. doi:10.1016/j.ultrasmedbio.2010.02.012PMID:20510184 38. Dayton PA, Allen JS, Ferrara KW (2002) The magnitude of radiation force on ultrasound contrast
agents. J Acoust Soc Am 112: 2183–2192. doi:10.1121/1.1509428PMID:12430830 39. Deen WM (1998) Analysis of Transport Phenomena. New York: Oxford University Press. 40. Leighton T (2007) What is ultrasound? Prog Biophys Mol Biol 93: 3–83. doi:10.1016/j.pbiomolbio.
2006.07.026PMID:17045633
41. Calor-Filho MM, Machado JC (2006) Measurement of the ultrasonic attenuation coefficient of human blood plasma during clotting in the frequency range of 8 to 22 MHz. Ultrasound Med Biol 32: 1055– 1064. doi:10.1016/j.ultrasmedbio.2006.04.002PMID:16829319
42. Hooke R (1678) Lectures de potentia restitutiva, or, Of spring: explaining the power of springing bodies: to which are added some collections. Printed for J. Martyn.
43. Park J, Lakes RS (2007) Biomaterials. 3rd ed. New York: Springer.
44. Nightingale K, Soo MS, Nightingale R, Bentley R, Stutz D, Palmeri M, et al. (2002) Acoustic radiation force impulse imaging: remote palpation of the mechanical properties of tissue. Proc IEEE Ultrason Symp: 1821–1830. doi:10.1109/ULTSYM.2002.1192652
45. Long JA, Ündar A, Manning KB, Deutsch S (2005) Viscoelasticity of Pediatric Blood and its Implications for the Testing of a Pulsatile Pediatric Blood Pump. ASAIO Journal 51: 563. doi:10.1097/01.mat. 0000180353.12963.f2PMID:16322719
46. Viola F, Walker WF (2003) Radiation force imaging of viscoelastic properties with reduced artifacts. IEEE Trans Ultrason Ferroelectr Freq Control 50: 736–742. doi:10.1109/TUFFC.2003.1209564PMID: 12839188
47. Schmitt C, Hadj Henni A, Cloutier G (2011) Characterization of blood clot viscoelasticity by dynamic ul-trasound elastography and modeling of the rheological behavior. J Biomech 44: 622–629. doi:10. 1016/j.jbiomech.2010.11.015PMID:21122863
48. Gennisson J-L, Lerouge S, Cloutier G (2006) Assessment by transient elastography of the viscoelastic properties of blood during clotting. Ultrasound Med Biol 32: 1529–1537. doi:10.1016/j.ultrasmedbio. 2006.06.008PMID:17045874
49. Barrangou LM, Daubert CR, Allen Foegeding E (2006) Textural properties of agarose gels. I. Rheologi-cal and fracture properties. Food Hydrocolloids 20: 184–195. doi:10.1016/j.foodhyd.2005.02.019 50. Adams S, Frith WJ, Stokes JR (2004) Influence of particle modulus on the rheological properties of
agar microgel suspensions. J Rheol 48: 1195. doi:10.1122/1.1795193
52. Hamhaber U, Grieshaber FA, Nagel JH, Klose U (2002) Comparison of quantitative shear wave MR-elastography with mechanical compression tests. Magn Reson Med 49: 71–77. doi:10.1002/mrm. 10343
53. Riha P, Wang X, Liao R, Stoltz JF (1999) Elasticity and fracture strain of whole blood clots. Clin Hemor-heol Microcirc 21: 45–49. PMID:10517487
54. Huang C-C, Shih C-C, Liu T-Y, Lee P-Y (2011) Assessing the Viscoelastic Properties of Thrombus Using a Solid-Sphere-Based Instantaneous Force Approach. Ultrasound Med Biol 37: 1722–1733. doi: 10.1016/j.ultrasmedbio.2011.06.026PMID:21821355
55. Kopechek JA, Haworth KJ, Raymond JL, Douglas Mast T, Perrin SR, Klegerman ME, et al. (2011) Acoustic characterization of echogenic liposomes: Frequency-dependent attenuation and backscatter. J Acoust Soc Am 130: 3472–3481. doi:10.1121/1.3626124PMID:22088022
56. Bouchard RR, Palmeri ML, Pinton GF, Trahey GE, Streeter JE, Dayton PA (2009) Optical tracking of acoustic radiation force impulse-induced dynamics in a tissue-mimicking phantom. J Acoust Soc Am 126: 2733–2745. doi:10.1121/1.3238235PMID:19894849
57. Averett LE, Schoenfisch MH, Akhremitchev BB, Gorkun OV (2009) Kinetics of the multistep rupture of fibrin“A-a”polymerization interactions measured using atomic force microscopy. Biophys J 97: 2820– 2828. doi:10.1016/j.bpj.2009.08.042PMID:19917237
58. Liu W, Carlisle CR, Sparks EA, Guthold M (2010) The mechanical properties of single fibrin fibers. J Thromb Haemost 8: 1030–1036. doi:10.1111/j.1538-7836.2010.03745.xPMID:20088938 59. Ilinskii YA, Meegan GD, Zabolotskaya EA, Emelianov SY (2005) Gas bubble and solid sphere motion
in elastic media in response to acoustic radiation force. J Acoust Soc Am 117: 2338. doi:10.1121/1. 1863672PMID:15898674
60. Cicuta P, Donald AM (2007) Microrheology: a review of the method and applications. Soft Matter 3: 1449–1455. doi:10.1039/b706004c
61. Weihs D, Mason TG, Teitell MA (2006) Bio-Microrheology: A Frontier in Microrheology. Biophys J 91: 4296–4305. doi:10.1529/biophysj.106.081109PMID:16963507
62. Scott DJA, Prasad P, Philippou H, Rashid ST, Sohrabi S, Whalley D, et al. (2011) Clot Architecture Is Altered in Abdominal Aortic Aneurysms and Correlates With Aneurysm Size. Arterioscler Thromb Vasc Biol 31: 3004–3010. doi:10.1161/ATVBAHA.111.236786PMID:21921257
63. Shah JV, Janmey PA (1997) Strain hardening of fibrin gels and plasma clots. Rheola Acta 36: 262– 268. doi:10.1007/BF00366667
64. Averett RD, Menn B, Lee EH, Helms CC, Barker T, Guthold M (2012) A Modular Fibrinogen Model that Captures the Stress-Strain Behavior of Fibrin Fibers. Biophys J 103: 1537–1544. doi:10.1016/j.bpj. 2012.08.038PMID:23062346
65. Guthold M, Liu W, Sparks E, Jawerth L, Peng L, Falvo M, et al. (2007) A comparison of the mechanical and structural properties of fibrin fibers with other protein fibers. Cell Biochem Biophys.
66. Burghardt WR, Goldstick TK, Leneschmidt J, Kempka K (1995) Nonlinear viscoelasticity and the throm-belastograph: 1. Studies on bovine plasma clots. Biorheology 32: 621–630. doi:10.1016/0006-355X (95)00041-7PMID:8857352
67. Evans PA, Hawkins K, Lawrence M, Williams RL, Barrow MS, Thirumalai N, et al. (2008) Rheometry and associated techniques for blood coagulation studies. Med Eng Phys 30: 671–679. doi:10.1016/j. medengphy.2007.08.005PMID:17900965
68. Katori N, Tanaka KA, Szlam F, Levy JH (2005) The effects of platelet count on clot retraction and tissue plasminogen activator-induced fibrinolysis on thrombelastography. Anesth Analg 100: 1781–1785. doi:10.1213/01.ANE.0000149902.73689.64PMID:15920213
69. Lang T, Toller W, Gutl M, Mahla E, Metzler H, Rehak P et al. (2004) Different effects of abciximab and cytochalasin D on clot strength in thrombelastography. J Thromb Haemost 2: 147–153. doi:10.1111/j. 1538-7836.2004.00555.xPMID:14717978
70. Nielsen VG, Geary BT, Baird MS (2000) Evaluation of the contribution of platelets to clot strength by thromboelastography in rabbits: The role of tissue factor and cytochalasin D. Anesth Analg 91: 35–39. doi:10.1213/00000539-200007000-00007PMID:10866883
71. Khurana S, Mattson JC, Westley S, O'Neill WW, Timmis GC, Safian RD (1997) Monitoring platelet gly-coprotein IIb/IIIa—fibrin interaction with tissue factor—activated thromboelastography. J Lab Clin Med 130: 401–411. doi:10.1016/S0022-2143(97)90040-8PMID:9358079
72. Jerjes-Sanchez C (2004) Venous and arterial thrombosis: a continuous spectrum of the same disease? Eur Heart J 26: 3–4. doi:10.1093/eurheartj/ehi041PMID:15615791
74. Huveneers S, Danen EHJ (2009) Adhesion signaling—crosstalk between integrins, Src and Rho. J Cell Sci 122: 1059–1069. doi:10.1242/jcs.039446PMID:19339545
75. Liang XM, Han SJ, Reems J-A, Gao D, Sniadecki NJ (2010) Platelet retraction force measurements using flexible post force sensors. Lab Chip 10: 991–998. doi:10.1039/b918719gPMID:20358105 76. Chaudhuri O, Parekh SH, Lam WA, Fletcher DA (2009) Combined atomic force microscopy and