SAGE Open
January-March 2016: 1 –15 © The Author(s) 2016 DOI: 10.1177/2158244016630031 sgo.sagepub.com
Creative Commons CC-BY: This article is distributed under the terms of the Creative Commons Attribution 3.0 License (http://www.creativecommons.org/licenses/by/3.0/) which permits any use, reproduction and distribution of
the work without further permission provided the original work is attributed as specified on the SAGE and Open Access pages (https://us.sagepub.com/en-us/nam/open-access-at-sage).
Article
The global financial crisis at the time of this writing is going on for 4 years. Although there have been positive signs that the “Great Recession” may be coming to an end, high unem-ployment, the continued slow progress in the mortgage cri-sis, and sovereign debt exposure point to continued difficulty in keeping banking institutions well capitalized. Capitalization allows banks and credit unions to withstand minor setbacks and helps keep defenses stronger in case of systemic shocks. Given the attempts to redress the financial institutions taken by a number of governments and organiza-tions, threats to bank solvency that were often passed over have recently garnered greater attention (e.g., Congressional Oversight Panel, 2010, 2011; McKillop, Ward, & Wilson, 2010; Walter, 2010). Why is it that credit unions received much less public support than other institutions in the United States? Is this lack of support due to less need, unlike that found by Allen Berger, Bouwman, Kick, and Schaeck (2012) when considering recent developments in Germany, less political power, or being considered small enough to fail? Some have cited declining ethical standards (Volcker, 2011) or internal factors such as excessive compensation for the collapse of so many institutions. The threat of out of control compensation practices to a healthy financial system is severe enough that new guidelines are in the process of being formulated by a number of regulatory bodies including the Federal Reserve in the United States (2011) and the Bank for International Settlements in Basel, Switzerland (2011). Some
have pointed to the level of pay, and others have focused on the incentive schemes that are offered. Financial institutions typically have had the highest pay among industries, and at least top-level executives have, in many cases, incentive compensation based on firm performance. These schemes have often been shown to have positive impacts on perfor-mance in a number of industries. The problem with some of these compensation schemes is that they have not been adjusted for the risk imposed on the institution. Corporate governance issues have been brought to the fore by these compensation issues as well. Have the board of directors and management given enough attention to the risk that these practices place on the institution, or have they been aware of the probable consequences and their own personal incentives are so short term that future institutional collapse is not a consideration? Shareholders as well as taxpayers in a number of countries believe that compensation has gone too far and have been openly challenging executives at companies like Citigroup, Barclays, and Credit Suisse (Schafer, 2012). This article will answer some of these questions concerning the dangers of mismanaging compensation. Data collected from 630031SGOXXX10.1177/2158244016630031SAGE OpenKlinedinst
research-article2016
1
University of Southern Mississippi, Hattiesburg, USA
Corresponding Author:
Mark A. Klinedinst, Professor of Economics, University of Southern Mississippi, 118 College Drive #5108, Hattiesburg, MS 39406, USA. Email: [email protected]
Bank Decapitalization and Credit Union
Capitalization: The Impact of Excessive
Compensation
Mark A. Klinedinst
1Abstract
This article looks at the theory and empirical findings of excessive compensation on the recent financial implosion across institutional forms in banking. Compensation levels have gone up dramatically over the last 30 years as deregulation and concentration have grown. Some banks and quite a few credit unions avoided closure by prudent portfolio selection and keeping reserves up by maintaining compensation levels closer to the median level. Empirical findings here are based on a unique panel data set on U.S. commercial banks, thrifts, and credit unions from 1994 through 2010 (more than 300,000 observations) that provide evidence that the firms with the highest net worth typically are smaller institutions, are credit unions, have smaller insider loans as a percentage of assets, and have lower average pay levels. The favorable results here for credit unions, financial cooperatives, should help guide policy when deciding which type of financial institutions should be encouraged.
Keywords
2 SAGE Open
1994 to 2010 on U.S. credit unions, banks, and thrifts pro-vide a rich resource to analyze the changes in capitalization. The next section will discuss the theory of capitalization and compensation as it relates to financial institutions. The third section of the article will address the data used and the empirical strategy. The results of the statistical analysis will be considered in the fourth section followed by the policy implications.
Theory of Capitalization and
Compensation
Capital acts not only to provide financial institutions the liquidity necessary to take advantage of opportunities but also as an important buffer in case of distressed asset values. Historically capital levels were much higher when there was no clear lender of last resort. Bank capital in the 1800s typi-cally ranged from 20% to 50% of assets, much higher than the approximately 10% that is seen recently (Dwyer, 2011). The higher leverage ratio seen before this recession makes institutions more susceptible to even moderate fluctuations in assets. The lender of last resort function and the deposit insurance programs of the last 100 years also come with cap-italization standards that are often perceived as burdensome, even though well below what existed in the period of “free market” banking in earlier years. The different stakeholders of institutions often have divergent goals in regard to capital. Shareholders interested in maximizing income typically want less than the credit rating agencies due to the opportu-nity costs of maintaining high liquidity than do depositors and regulators who want to be protected from loss (Allen, 2006; Doyran, 2011). Credit unions, unlike commercial banks, are financial cooperatives and have depositors who are also the claimants on the residual income as well as being able to determine the composition of the board of directors (Jones, Kalmi, & Kauhanen, 2012). All institutions wishing to avoid “prompt corrective action” (PCA) by regulatory authorities will attempt to meet the minimum capital stan-dards for being “well capitalized” set by the relevant regula-tor (Elizalde & Repullo, 2006).
Compensation practices at financial institutions have been controversial especially lately due to the relatively high levels of pay and the risks that are thought to have been mag-nified by incentive compensation schemes. The banking industry has one of the highest levels of pay of any industry in the United States especially investment banking and even after accounting for differences in human capital (Cai & Milbourn, 2010; Philippon & Reshef, 2012). Given the recent crisis with substantial taxpayer bailouts since 2007 (Gilbert, Kliesen, Meyer, & Wheelock, 2012), with compen-sation still quite high, has a number of shareholders and tax-payers feeling that their money has been misspent and that the high pay actually makes default risk higher (Thanassoulis, 2012). In 2010, compensation at publicly traded banks reached a record US$135 billion (Lucchetti & Grocer, 2011).
Even in the midst of the recession in 2009, these same com-panies paid US$128 billion in pay. Many argue that many of these companies would have been bankrupt and closed if not for the infusions from the Fed and the government (Aubuchon & Wheelock, 2010; Taibbi, 2011). One of the more discussed cases is that of the investment bank of Goldman Sachs (2011), which recently paid approximately US$500,000 in average compensation. A high percentage of compensation among banks, especially among senior management, comes from incentive schemes such as bonuses and stock options (Rosen, 2002). Incentive schemes such as these are often thought to bring increased firm productivity in a wide variety of industries (FitzRoy et al., 1998; Klinedinst, 2003; Kruse & Blasi, 1997). Although these variable pay schemes are often associated with greater efficiency in many industries, it is clear in banking that they may also contribute to greater risk (Federal Reserve, Board of Governors, 2011). This greater risk is a problem that derives not only from senior-level executives’ compensation but also from employees in areas where the desire to earn bonuses in the short run is not adequately matched to the long-run implications of their decisions (Financial Stability Board, 2012). This agency problem of improper incentives runs through institutions all the way to the board of directors (Brown, 2009; Group of 30, 2012). Compensation being at odds with the interests of stakeholders was brought to the attention of the mainstream economics profession by Berle and Means (1932) in their book The Modern Corporation and Private Property,
we are dealing not only with distinct but often opposing groups, ownership on the one side, control on the other—a control which tends to move further and further away from ownership and ultimately to lie in the hands of management itself, a management capable of perpetuating its own position. (p. 124)
Robert Hoel (2011) recently pointed out a similar problem in credit unions as well,
Owner power evolves as the organization grows in size and complexity. Management becomes the most powerful actor in governance. (p. 21)
The degree to which this increased power translates into more firm earnings ending up in executive compensation rather than capital to protect shareholders, customers, and regulators is what this article hopes to empirically investigate.
Data and Empirical Strategy
Klinedinst 3
“Great Recession.” Sources for these online data are the National Credit Union Administration (NCUA; 2012) and Federal Deposit Insurance Corporation (FDIC; 2012). Statistical methods utilizing not only summary statistics but also regression techniques with numerous controls will be used to analyze these data. Given that we analyzed data from different financial institutional forms that often have similar goals and regulatory constraints but are also distinct, we allow flexible forms and compare both within and across institutions. Operationalizing the relations discussed in the previous section gives a general form such as
Y
it= +α βXit+εit. (1) The performance indicator, Y
it, used here is the firm’s net
worth as a percentage of assets. The intercept, α
i, captures
firm specific factors which may be otherwise unseen, while the X matrix contains policy variables, state dummies, and regional and time dummies to capture exogenous contempo-raneous shocks and policy changes. The use of firm specific intercepts helps to eliminate bias due to firm heterogeneity from unmeasured factors (e.g., managerial talent, technol-ogy, market share, etc.). Time invariance of a number of policy variables, however, would mean that when using fixed effects, these variables’ estimates would be lost. Random effects estimation allows these parameters to be recovered. Endogeneity of some of the policy variables in the X matrix would allow nonspherical error terms; hence, instrumental estimates are also calculated (Hausman & Taylor, 1981; Im, Kyung, Seung, Schmidt, & Wooldridge, 1999).
The policy variables include dummies for institutional type (credit union, thrift, or commercial bank), a dummy for large size (“giant” more than US$50 billion in assets), and an inter-action term for giant firms with average salary per employee, national unemployment figures, and the Case–Shiller housing index.
Results
All institutional forms have seen a dramatic decline over the period from 1994 to 2010. Table 1 shows that credit unions, savings banks, and commercial banks dropped from a total of almost 25,000 in 1994 to just over 15,000 by 2010, with savings bank numbers cut almost in half. This decline in numbers, in many cases caused by mergers, is reflected in the
fact that large institutions (“giants” in the tables), those with more than US$50 billion in assets, grew 164% (e.g., Goddard, McKillop, & Wilson, 2008; U.S. Senate, 2011; Wilcox & Dopico, 2011). This pace quickened from the end of 2007 until the end of 2010, especially for commercial banks.1 Capital grew substantially for all institutions over the time period, 344% for all institutions as indicated in Table 2. The largest growth occurred in commercial banks, second in credit unions, and savings banks the least. Large institutions also reported strong growth of 270%. As a percentage of assets, the growth of capital was less remarkable, but still positive over the whole period. Credit union’s net worth ratio was relatively stable at around 10%, whereas all other insti-tutions showed stronger growth at the end of the period to get to roughly the level the credit unions had over the entire sample. This higher capital ratio2 for credit unions is in part a purposeful strategy after the difficult times experienced in the 1980s (Dywer, Gould, & Lopez, 1999). The largest insti-tutions, starting with 6.55% (a result at odds with Daniel Bergstresser’s, 2004, work on earlier data), had the farthest to go and hence recorded the greatest growth at almost 70%. Figure 1 shows that credit unions had a higher median net worth over the whole period except for the last year when the large banks received substantial government assistance. The growth at the giant institutions is not too surprising given the largesse of the Federal Reserve to institutions that were “too big to fail” (Barofsky, 2012; Blinder & Zandi, 2010; Special Inspector General for the Troubled Asset Relief Program, 2012; Taibbi, 2013). Insider loans dropped over the period for credit unions and commercial banks, but went up by more than 200% for savings banks. Credit unions started the period with salaries about half those of the largest firms, closing the gap partly to about 67% by 2010. Average real salaries grew by similar amounts for all institutions over the period, except for the giants, which had much higher salaries than the others initially. Figure 2 shows that the ranking of median salaries over the whole period remains steady with the giants having the highest median salaries followed by savings banks, com-mercial banks, and finally the credit unions. It is interesting to note that the firms with more than a billion dollars of assets not only had typically higher salaries in 1994 than the firms with less than US$50 million in assets, but these large firms had a larger growth rates in salaries from 1994 to 2010. If the commercial and savings bank employees in 2010
Table 1. Institutional Form Over Time.
Institution Number in 1994 Number in 2000 Number in 2007 Number in 2010 Percentage change 1994-2010 Percentage change 2007-2010
Total 24,761 20,324 16,798 15,144 −39 −9.9
Credit unions 12,199 10,439 8,267 7,488 −39 −9.4
Savings banks 2,145 1,587 1,250 1,127 −48 −9.8
Commercial banks 10,411 8,298 7,281 6,529 −37 −10.3
Giants (assets above US$50 billion)a 14 28 37 37 164 0
a
4 SAGE Open
(2,083,246 employees) had been paid at the average rate of credit union employees, the annual savings from even this limited measure of compensation would be more than US$40 billion. Alternatively, if the compensation in commercial and savings banks had been used to hire people at the mean sal-ary of credit unions, there could have been more than 740,000 jobs in the industry.
The top and bottom quintiles of all observations ranked according to net worth as a percentage of assets are reported in Table 3. This table shows that credit unions overall and through-out the period are more than 70% of the top quintile observa-tions. The top firms are also typically smaller, averaging 182
million in assets and only 36 employees versus 1,230 million and 225 employees for the bottom quintile. There are about 3 times as many giant institutions in the bottom than in the top. Insider loans are also smaller in the top quintile, and average salaries are also lower. It is interesting to note that after trillions of dollars were injected into the system after 2007 (Blinder & Zandi, 2010), the percentage of commercial banks, savings banks, and giants dropped quickly as a percentage of the bot-tom quintile and the average salary in this quintile continued to increase. This finding of those institutions with the highest salaries levels continuing to pay well matches the Federal Reserve’s finding that “Over the recent three-year period,
Table 2. Means and Changes Over Time.
Variable
M 1994
M 2000
M 2010
Percentage change
1994-2010 Number in 2010
Capital (2010 dollars) US$23.4 m US$42.0 m US$104.0 m 344 15,153
Credit unions US$3.2 m US$6.1 m US$12.4 m 288 7,488
Savings banks US$51.1 m US$80.1 m US$131.0 m 156 1,127 Commercial banks US$41.3 m US$79.7 m US$205.0 m 396 6,529 Giants (assets above US$50 billion) US$7.4 b US$11.9 b US$27.4 b 270 37 Assets (2010 dollars) US$297 m US$486 m US$942 m 217 15,153
Credit unions US$33 m US$53 m US$124 m 276 7,488
Savings banks US$649 m US$958 m US$1,100 m 70 1,127
Commercial banks US$532 m US$939 m US$1,850 m 248 6,529 Giants (assets above US$50 billion) US$112 b US$154 b US$246 b 120 37 Net worth ratio (capital/assets) 7.90% 8.65% 11.10% 40.41 15,132
Credit unions 9.57% 11.44% 10.03% 4.83 7,484
Savings banks 7.39% 8.45% 11.75% 47.98 1,126
Commercial banks 7.76% 8.49% 11.10% 43.00 6,522
Giants (assets above US$50 billion) 6.55% 7.70% 11.13% 69.97 37 Insider loans percentage of assets (2010 dollars) 0.74% 0.48% 0.30% −60 15,153
Credit unions 0.57% 0.48% 0.37% −35 7,488
Savings banks 0.13% 0.21% 0.42% 223 1,127
Commercial banks 0.91% 0.53% 0.28% −69 6,529
Giants (assets above US$50 billion) 0.20% 0.26% 0.08% −60 37 Average salarya (2010 dollars) US$54,549 US$63,955 US$78,922 44.68 14,804 Credit unions US$41,367 US$48,248 US$59,651 44.20 7,173 Savings banks US$51,729 US$60,352 US$76,438 47.77 1,123 Commercial banks US$56,349 US$66,213 US$81,523 44.67 6,508 Giants (assets above US$50 billion) US$80,358 US$78,200 US$89,283 11.11 37
Firms with more than a billion dollars in assets
Average salary (2010 dollars) US$59,882 US$68,887 US$84,263 40.72 832 Credit unions US$45,325 US$54,523 US$67,103 48.05 169 Savings banks US$52,571 US$60,771 US$81,630 55.28 156 Commercial banks US$61,239 US$70,266 US$85,296 39.29 507
Firms with less than US$50 million in assets
Average salary (2010 dollars) US$40,949 US$45,471 US$51,250 25.15 6,045 Credit unions US$37,235 US$41,539 US$47,581 27.79 4,966 Savings banks US$53,415 US$69,148 US$80,982 51.61 136 Commercial banks US$43,983 US$49,753 US$57,212 30.08 943
Note. m = million; b = billion. a
Klinedinst 5
median net worth decreased for all income groups except the top decile, for which it was basically unchanged . . .” (Bricker et al., 2012, p. 6).
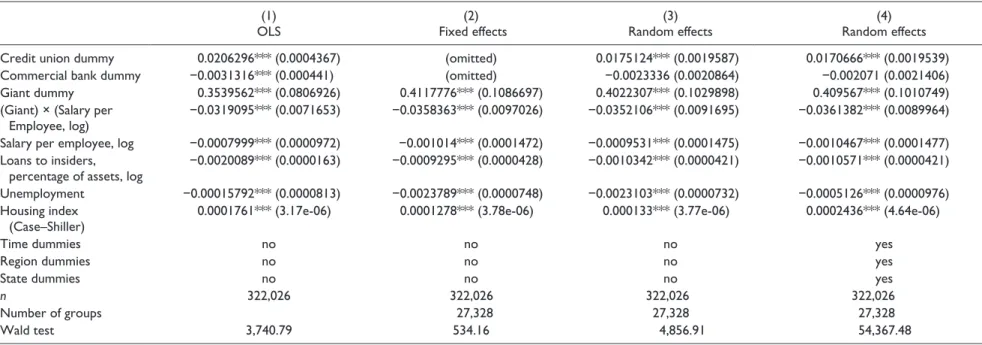
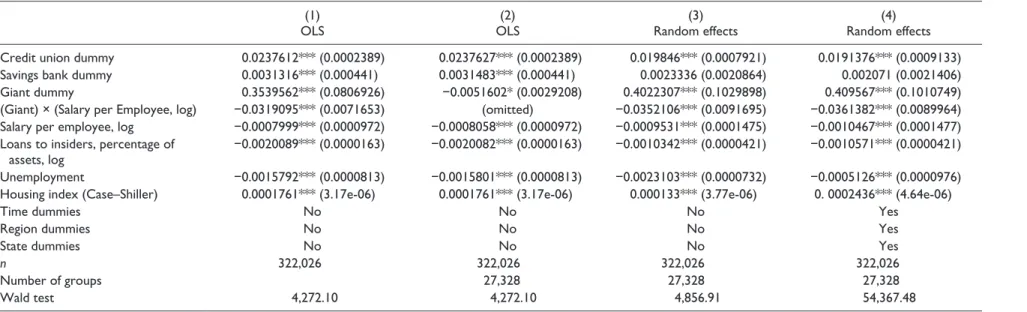
Tables 4 and 5 give results based on either the savings banks as the control dummy or the commercial bank dummy and with increasing numbers of control variables included. Regressions with the most controls in these two tables, col-umn 4, were found to be the best fit.3 In both tables, credit unions are estimated to have a positive and significant impact on net worth. The difference between savings banks and commercial banks is often insignificant with savings banks in the ordinary least squares (OLS) estimates showing a posi-tive and significant impact. Given the power and size of large institutions, a “giant” dummy, which includes a number of
institutions that are typically considered too big to fail and often hard to measure precise effects (Berger et al., 2012), shows a positive and significant effect on net worth. It is interesting to note that if the giant dummy is included with-out the interaction term for salaries, it becomes negative and significant (see column 2 of Table 5). This interaction term is significant and negative indicating high salaries at these giant institutions detract from the positive scale effect and may be above efficiency wage norms.4
The negative and significant coefficient on salaries gives some credence to the hypothesis that insiders, executives, may be paid at such a rate that shareholders suffer. Loans to insiders are also measured to have an important negative impact on net worth in both Tables 4 and 5. It might be
Figure 1. Net worth, 1994-2010 (median).
6 SAGE Open
argued that average pay may vary over the business cycle; hence, regressions with employment held constant were per-formed, not reported here, and show similar results. The national unemployment rate is also measured, as might be expected, as having a negative and significant impact on net worth. The Case–Shiller housing index throughout these two tables is seen as being positively correlated with net worth. The unemployment and housing index capture in part the impact on bank balance sheets of the recently reported drop of almost 40% in the median net worth of American house-holds of the last few years of this sample (Bricker et al., 2012).
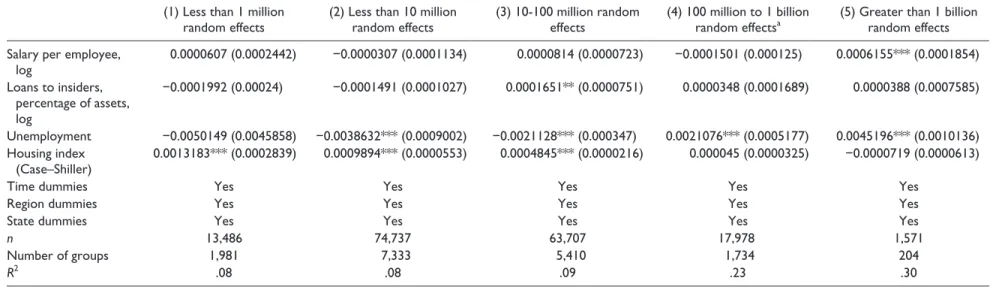
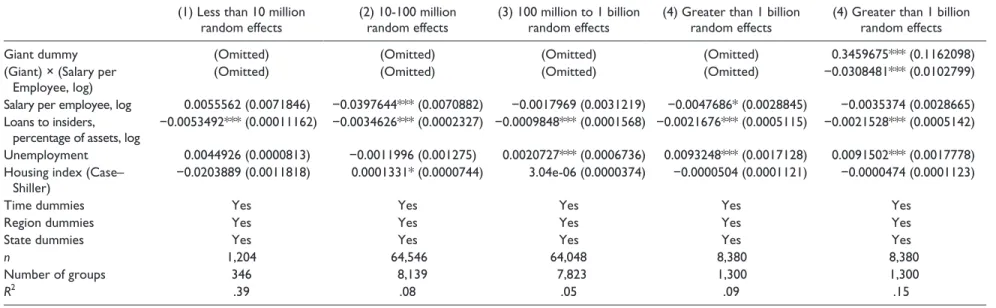
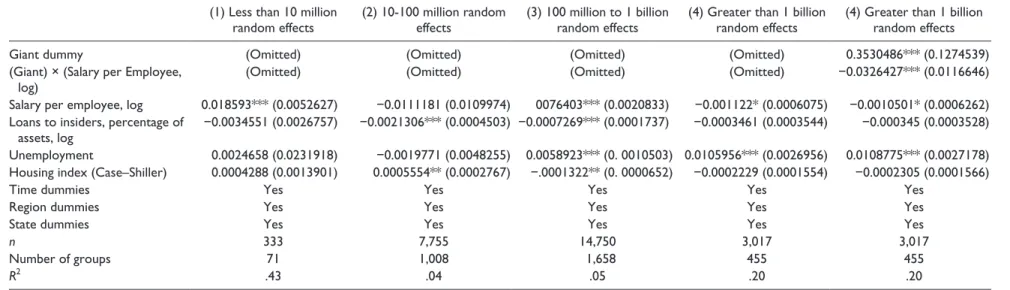
Tables 6 to 8 allow the effects to be institutional specific and broken down into different asset sizes. Estimating the impact on credit unions alone in Table 6 shows that the impact of salaries and insider loans to typically be not sig-nificant. Commercial banks estimated in Table 7 again shows the positive scale effects of the “giants” but their high sala-ries have a negative influence on net worth. Even among the large firms, there are differences across institutional forms, for example, Navy Federal Credit Union, the largest credit union with assets of more than US$44 billion in 2010, had
16% higher net worth ratio than the large commercial bank Goldman Sachs ([.09744 − .08357] / .08357 = .16596), and Goldman paid on average about 26% more in average sala-ries ([97,158.97 − 76,787.951] / 76,787.951 = .2653). Note that this calculation is for 2010 after Goldman received sub-stantial funds from the government and this does not include incentive payments that were not reported as salaries by Goldman to the FDIC.5 Although salaries are more often car-rying the expected negative sign, they are only significant in two asset groups. Loans to insiders in all asset groups for commercial banks are estimated to be negative and signifi-cant. The savings bank results in Table 8 mirror more closely the commercial banks than the credit unions, for example, the “giants” impact is similar and the loans to insiders all have the expected negative sign.
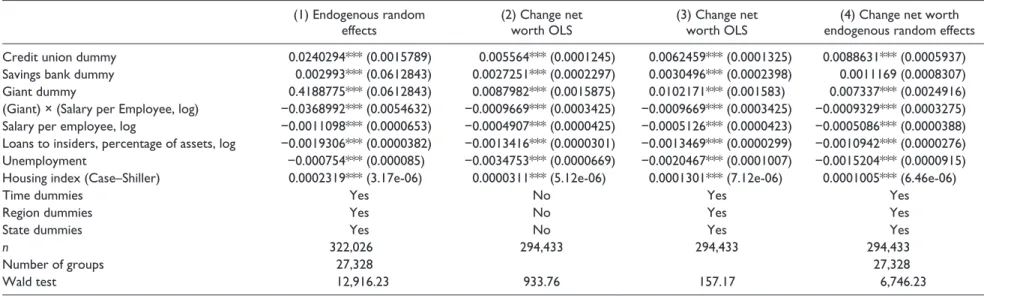
The decision of what to pay and whether to make a loan to an insider could be considered contemporaneous choice vari-ables of the firm, hence simultaneously determined with the dependent variable. Table 9 shows the Hausman–Taylor model in column 1 which accounts for this potential endog-eniety, which is indicated by the Durbin–Wu–Hausman test, and allows for time-invariant variables.6 Columns 2 to 4 in
Table 3. Means in Top and Bottom Quintiles According to Net Worth.
All years 1994 2000 2007 2010
Top quintile (66,163 observations)
Net worth ratio (capital/assets) 21.7% 20.0% 20.2% 24.4% 18.8% Credit unions, percentage of observations in top
quintile
72.6% 72.9% 74.6% 70.2% 72.9%
Savings banks, percentage of observations in top quintile
6.2% 6.2% 5.7% 6.5% 7.3%
Commercial banks, percentage of observations in top quintile
21.2% 20.9% 19.7% 23.4% 19.8%
Giants (assets above US$50 billion) 0.1% 0.0% 0.0% 0.1% 0.3% Capital (2010 dollars) US$39.5 m US$8.9 m US$14.5 m US$59.7 m US$94.6 m Assets (2010 dollars) US$182 m US$44.3 m US$71.9 m US$245 m US$504 m Insider loans, percentage of assets 0.3% 0.4% 0.5% 0.3% 0.1% Average salary (2010 dollars) US$66,097 US$51,232 US$61,385 US$63,919 US$81,285
Employees 36 14 22 44 65
National unemployment 5.4% 6.1% 3.9% 4.6% 9.6%
Case–Shiller housing index 125.4 78.2 108.1 170.8 130.9 Bottom quintile (66,163 observations)
Net worth ratio (capital/assets) 7.1% 6.7% 6.8% 7.7% 7.4% Credit unions, percentage of observations in top quintile 31.7% 39.8% 24.3% 20.6% 46.3% Savings banks, percentage of observations in top quintile 11.0% 11.0% 11.5% 11.7% 7.6% Commercial, percentage of observations in top quintile 57.3% 49.2% 64.2% 67.7% 46.1% Giants (assets above US$50 billion) 0.3% 0.2% 0.4% 0.7% 0.2% Capital (2010 dollars) US$86.8 m US$42.3 m US$86.7 m US$261.0 m US$77.7 m Assets (2010 dollars) US$1,230 m US$632.0 m US$1,280 m US$3,390 m US$1,060 m Insider loans, percentage of assets 0.4% 0.7% 0.5% 0.2% 0.3% Average salary (2010 dollars) US$70,426 US$57,929 US$67,451 US$84,623 US$87,989
Employees 225 153 239 452 155
National unemployment 5.5% 6.1% 3.9% 4.6% 9.6%
Case–Shiller housing index 113.1 78.2 108.1 170.8 130.9
7
Table 4. Net Worth as Percentage of Assets, U.S. Data 1994-2010.
(1) OLS
(2) Fixed effects
(3) Random effects
(4) Random effects
Credit union dummy 0.0206296*** (0.0004367) (omitted) 0.0175124*** (0.0019587) 0.0170666*** (0.0019539)
Commercial bank dummy −0.0031316*** (0.000441) (omitted) −0.0023336 (0.0020864) −0.002071 (0.0021406)
Giant dummy 0.3539562*** (0.0806926) 0.4117776*** (0.1086697) 0.4022307*** (0.1029898) 0.409567*** (0.1010749)
(Giant) × (Salary per Employee, log)
−0.0319095*** (0.0071653) −0.0358363*** (0.0097026) −0.0352106*** (0.0091695) −0.0361382*** (0.0089964)
Salary per employee, log −0.0007999*** (0.0000972) −0.001014*** (0.0001472) −0.0009531*** (0.0001475) −0.0010467*** (0.0001477)
Loans to insiders, percentage of assets, log
−0.0020089*** (0.0000163) −0.0009295*** (0.0000428) −0.0010342*** (0.0000421) −0.0010571*** (0.0000421)
Unemployment −0.00015792*** (0.0000813) −0.0023789*** (0.0000748) −0.0023103*** (0.0000732) −0.0005126*** (0.0000976)
Housing index (Case–Shiller)
0.0001761*** (3.17e-06) 0.0001278*** (3.78e-06) 0.000133*** (3.77e-06) 0.0002436*** (4.64e-06)
Time dummies no no no yes
Region dummies no no no yes
State dummies no no no yes
n 322,026 322,026 322,026 322,026
Number of groups 27,328 27,328 27,328
Wald test 3,740.79 534.16 4,856.91 54,367.48
8
Table 5. Net Worth as Percentage of Assets, U.S. Data 1994-2010.
(1) OLS
(2) OLS
(3) Random effects
(4) Random effects
Credit union dummy 0.0237612*** (0.0002389) 0.0237627*** (0.0002389) 0.019846*** (0.0007921) 0.0191376*** (0.0009133)
Savings bank dummy 0.0031316*** (0.000441) 0.0031483*** (0.000441) 0.0023336 (0.0020864) 0.002071 (0.0021406)
Giant dummy 0.3539562*** (0.0806926) −0.0051602* (0.0029208) 0.4022307*** (0.1029898) 0.409567*** (0.1010749)
(Giant) × (Salary per Employee, log) −0.0319095*** (0.0071653) (omitted) −0.0352106*** (0.0091695) −0.0361382*** (0.0089964)
Salary per employee, log −0.0007999*** (0.0000972) −0.0008058*** (0.0000972) −0.0009531*** (0.0001475) −0.0010467*** (0.0001477)
Loans to insiders, percentage of assets, log
−0.0020089*** (0.0000163) −0.0020082*** (0.0000163) −0.0010342*** (0.0000421) −0.0010571*** (0.0000421)
Unemployment −0.0015792*** (0.0000813) −0.0015801*** (0.0000813) −0.0023103*** (0.0000732) −0.0005126*** (0.0000976)
Housing index (Case–Shiller) 0.0001761*** (3.17e-06) 0.0001761*** (3.17e-06) 0.000133*** (3.77e-06) 0. 0002436*** (4.64e-06)
Time dummies No No No Yes
Region dummies No No No Yes
State dummies No No No Yes
n 322,026 322,026 322,026 322,026
Number of groups 27,328 27,328 27,328
Wald test 4,272.10 4,272.10 4,856.91 54,367.48
9
Table 6. Net Worth as Percentage of Assets, U.S. Data, 1994-2010.
(1) Less than 1 million random effects
(2) Less than 10 million random effects
(3) 10-100 million random effects
(4) 100 million to 1 billion
random effectsa
(5) Greater than 1 billion random effects
Salary per employee, log
0.0000607 (0.0002442) −0.0000307 (0.0001134) 0.0000814 (0.0000723) −0.0001501 (0.000125) 0.0006155*** (0.0001854)
Loans to insiders, percentage of assets, log
−0.0001992 (0.00024) −0.0001491 (0.0001027) 0.0001651** (0.0000751) 0.0000348 (0.0001689) 0.0000388 (0.0007585)
Unemployment −0.0050149 (0.0045858) −0.0038632*** (0.0009002) −0.0021128*** (0.000347) 0.0021076*** (0.0005177) 0.0045196*** (0.0010136)
Housing index (Case–Shiller)
0.0013183*** (0.0002839) 0.0009894*** (0.0000553) 0.0004845*** (0.0000216) 0.000045 (0.0000325) −0.0000719 (0.0000613)
Time dummies Yes Yes Yes Yes Yes
Region dummies Yes Yes Yes Yes Yes
State dummies Yes Yes Yes Yes Yes
n 13,486 74,737 63,707 17,978 1,571
Number of groups 1,981 7,333 5,410 1,734 204
R2 .08 .08 .09 .23 .30
Note. Credit unions only in different asset groups. Robust standard errors are in parentheses.
a
10
Table 7. Net Worth as Percentage of Assets, U.S. Data, 1994-2010.
(1) Less than 10 million random effects
(2) 10-100 million random effects
(3) 100 million to 1 billion random effects
(4) Greater than 1 billion random effects
(4) Greater than 1 billion random effects
Giant dummy (Omitted) (Omitted) (Omitted) (Omitted) 0.3459675*** (0.1162098)
(Giant) × (Salary per Employee, log)
(Omitted) (Omitted) (Omitted) (Omitted) −0.0308481*** (0.0102799)
Salary per employee, log 0.0055562 (0.0071846) −0.0397644*** (0.0070882) −0.0017969 (0.0031219) −0.0047686* (0.0028845) −0.0035374 (0.0028665)
Loans to insiders, percentage of assets, log
−0.0053492*** (0.00011162) −0.0034626*** (0.0002327) −0.0009848*** (0.0001568) −0.0021676*** (0.0005115) −0.0021528*** (0.0005142)
Unemployment 0.0044926 (0.0000813) −0.0011996 (0.001275) 0.0020727*** (0.0006736) 0.0093248*** (0.0017128) 0.0091502*** (0.0017778)
Housing index (Case– Shiller)
−0.0203889 (0.0011818) 0.0001331* (0.0000744) 3.04e-06 (0.0000374) −0.0000504 (0.0001121) −0.0000474 (0.0001123)
Time dummies Yes Yes Yes Yes Yes
Region dummies Yes Yes Yes Yes Yes
State dummies Yes Yes Yes Yes Yes
n 1,204 64,546 64,048 8,380 8,380
Number of groups 346 8,139 7,823 1,300 1,300
R2 .39 .08 .05 .09 .15
11
Table 8. Net Worth as Percentage of Assets, U.S. Data, 1994-2010.
(1) Less than 10 million random effects
(2) 10-100 million random effects
(3) 100 million to 1 billion random effects
(4) Greater than 1 billion random effects
(4) Greater than 1 billion random effects
Giant dummy (Omitted) (Omitted) (Omitted) (Omitted) 0.3530486*** (0.1274539)
(Giant) × (Salary per Employee, log)
(Omitted) (Omitted) (Omitted) (Omitted) −0.0326427*** (0.0116646)
Salary per employee, log 0.018593*** (0.0052627) −0.0111181 (0.0109974) 0076403*** (0.0020833) −0.001122* (0.0006075) −0.0010501* (0.0006262)
Loans to insiders, percentage of assets, log
−0.0034551 (0.0026757) −0.0021306*** (0.0004503) −0.0007269*** (0.0001737) −0.0003461 (0.0003544) −0.000345 (0.0003528)
Unemployment 0.0024658 (0.0231918) −0.0019771 (0.0048255) 0.0058923*** (0. 0010503) 0.0105956*** (0.0026956) 0.0108775*** (0.0027178)
Housing index (Case–Shiller) 0.0004288 (0.0013901) 0.0005554** (0.0002767) −.0001322** (0. 0000652) −0.0002229 (0.0001554) −0.0002305 (0.0001566)
Time dummies Yes Yes Yes Yes Yes
Region dummies Yes Yes Yes Yes Yes
State dummies Yes Yes Yes Yes Yes
n 333 7,755 14,750 3,017 3,017
Number of groups 71 1,008 1,658 455 455
R2 .43 .04 .05 .20 .20
12
Table 9. Net Worth as Percentage of Assets, U.S. Data 1994-2010.
(1) Endogenous random effects
(2) Change net worth OLS
(3) Change net worth OLS
(4) Change net worth endogenous random effects
Credit union dummy 0.0240294*** (0.0015789) 0.005564*** (0.0001245) 0.0062459*** (0.0001325) 0.0088631*** (0.0005937)
Savings bank dummy 0.002993*** (0.0612843) 0.0027251*** (0.0002297) 0.0030496*** (0.0002398) 0.0011169 (0.0008307)
Giant dummy 0.4188775*** (0.0612843) 0.0087982*** (0.0015875) 0.0102171*** (0.001583) 0.007337*** (0.0024916)
(Giant) × (Salary per Employee, log) −0.0368992*** (0.0054632) −0.0009669*** (0.0003425) −0.0009669*** (0.0003425) −0.0009329*** (0.0003275)
Salary per employee, log −0.0011098*** (0.0000653) −0.0004907*** (0.0000425) −0.0005126*** (0.0000423) −0.0005086*** (0.0000388)
Loans to insiders, percentage of assets, log −0.0019306*** (0.0000382) −0.0013416*** (0.0000301) −0.0013469*** (0.0000299) −0.0010942*** (0.0000276)
Unemployment −0.000754*** (0.000085) −0.0034753*** (0.0000669) −0.0020467*** (0.0001007) −0.0015204*** (0.0000915)
Housing index (Case–Shiller) 0.0002319*** (3.17e-06) 0.0000311*** (5.12e-06) 0.0001301*** (7.12e-06) 0.0001005*** (6.46e-06)
Time dummies Yes No Yes Yes
Region dummies Yes No Yes Yes
State dummies Yes No Yes Yes
n 322,026 294,433 294,433 294,433
Number of groups 27,328 27,328
Wald test 12,916.23 933.76 157.17 6,746.23
Note. Columns 2 through 4 use first differences of the dependent and right-hand side variables. Commercial bank is the excluded dummy. Robust standard errors are in parentheses. OLS = ordinary least squares.
Klinedinst 13
Table 9 are estimated in first differences to show robustness of the results in the presence of possible unit roots, which was found not to be the case with augmented Dickey–Fuller tests.7 The results in Table 9 show similar levels and signifi-cance to those found in Tables 4 and 5.
Policy Implications
The results here point to pay levels at large institutions being high enough to have a negative impact on firm capital levels. These calculations are made even though the data here prob-ably capture a fraction of the real expenditures that might be considered part of internal compensation, especially for executives at larger firms.8 It is interesting to note that the institutions that received the smallest amount of assistance from the government, credit unions, also have had consis-tently high levels of net worth and also pay employees the least. The high levels of pay seen in the largest institutions not only are correlated over the whole period with lower net worth but continued once the “Great Recession” forced tax-payers to help recapitalize what otherwise probably would have been bankrupt firms. Section 956 of the Dodd–Frank Act that addresses excessive and misaligned compensation has been codified by the Federal Reserve and the FDIC, but their oversight may not always be sufficient without public and congressional pressure. A number of studies have shown high wages in many industries are related to firm size, educa-tion, and union militancy among other factors. Although we were not able to control for all of these factors within this industry, we did control for a number of elements, including, for example, size, region, insider loans, year, and institu-tional form, and find that credit unions with all else held con-stant kept higher reserves to handle a possible downturn rather than distributing earnings to highly paid executives. The results reported here also are a reflection of the senti-ment of large numbers of U.S. consumers who are transfer-ring their savings to credit unions (Cole, 2012; Gelles, 2011; Worth, Hampel, & Schenk, 2012). Nevertheless, even these limited data show a negative correlation with pay, net worth, and insider loans. Large firms not only pay more, in line with the hypothesis from Berle and Means (1932), but their pay has risen at a faster pace than the smaller institutions. Over the time period of this study, this excess pay relative to the institutions that did not get bailed out at taxpayer expense adds up to hundreds of billions of dollars. These billions could have been given to shareholders or helped prevent pos-sibly the bailouts given by the general public. Recapitalization of financial institutions is a major concern across the globe, and the attempt to maintain solvency by requiring sensible compensation seems to be one of the tools that may help.
Acknowledgment
The author thanks the participants of the conferences of the Western Economic Association International, San Francisco, June 2012, and the International Association for the Economics of Participation,
Rutgers University, July 2012, for insightful comments, and also to the staff at the Federal Reserve, FDIC, and the National Credit Union Administration.
Declaration of Conflicting Interests
The author(s) declared no potential conflicts of interest with respect to the research, authorship, and/or publication of this article.
Funding
The author(s) received no financial support for the research and/or authorship of this article.
Notes
1. This could be partly attributable to the numerous “bailout” programs of the Federal Reserve, which committed close to US$12 trillion (Blinder & Zandi, 2010).
2. Also called the net worth ratio is the institution’s assets minus liabilities over total assets.
3. For example, in Table 4, χ2 of 15,549 with 49 df and a p value of .00.
4. It is interesting that when interacting credit unions with aver-age salaries, the term is positive and significant.
5. In 2007, before the bailouts, Navy Federal Credit Union’s net worth ratio was 22% higher than Goldman’s, and Goldman Sachs also paid average salaries that were 37% higher than Navy’s.
6. χ2 of 987.97 with 3 df and a p value of .00.
7. Asymptotic χ2 from a Fisher-type unit-root test of 266.97 and a p value of .00.
8. The items not captured by the publicly available data used here include such expenses as executive office spaces, planes, deferred compensation, hidden expenses in “research,” and so on. The salary reported by Goldman Sachs to the Fed for 2010 was US$220 million versus the US$15,376 million reported in the 2010 Annual Report (220 / 153760 = 0.014). A similar result holds for Bank of America in 2010, that is, US$18.1 bil-lion reported to the Fed and the annual report lists US$35.1 billion (18066 / 35149 = 0.51).
References
Allen, B. (2006). Internal affairs. Risk, 19, 45-49.
Aubuchon, C. P., & Wheelock, D. C. (2010). The geographic distri-bution and characteristics of U.S. bank failures, 2007-2010: Do bank failures still reflect local economic conditions? Federal Reserve Bank of St. Louis Review, 92, 395-415. Retrieved from http://web.a.ebscohost.com.lynx.lib.usm.edu/ehost/detail/ detail?sid=d8ddcf49-70f1-4e4d-9c2b887c48cca54c%40sessio nmgr4005&vid=0&hid=4101&bdata=JnNpdGU9ZWhvc3Qtb Gl2ZQ%3d%3d#AN=54526861&db=bth
Bank for International Settlements. (2011). Retrieved from https:// www.bis.org/publ/bcbs183/bbva.pdf
Barofsky, N. (2012). An inside account of how Washington aban-doned main street while rescuing wall street. New York, NY: Free Press.
14 SAGE Open
Bergstresser, D. (2004). Market concentration and commercial bank loan portfolios. SSRN Electronic Journal. doi:10.2139/ ssrn.1291356
Berle, A. A., & Means, G. C. (1932). The modern corporation and private property. New York, NY: Macmillan.
Blinder, A. S., & Zandi, M. (2010). How the great recession was brought to an end (PDF version). Retrieved from http:// www.economy.com/mark-zandi/documents/End-of-Great-Recession.pdf
Bricker, J., Kennickell, A. B., Moore, K. B., Sabelhaus, J., Ackerman, S., Argento, R., . . . Windle, R. A. (2012). Changes in U.S.family finances from 2007 to 2010: Evidence from the survey of consumer finances. Federal Reserve Bulletin, 98(2), 42-80. Retrieved from http://web.a.ebscohost.com.lynx.lib. usm.edu/ehost/detail/detail?sid=282942d0-8f38-46df-843c-a918eae0a4b6%40sessionmgr4003&vid=0&hid=4101&bdata =JnNpdGU9ZWhvc3QtbGl2ZQ%3d%3d#AN=98555779&db =bth
Brown, R. J. (2009). Returning fairness to executive compensa-tion. North Dakota Law Review, 84, 1141-1159. Retrieved from http://www.lexisnexis.com.lynx.lib.usm.edu/hottop-ics/lnacademic/?shr=t&csi=138916&sr=(RETURNING%20 FAIRNESS%20TO%20EXECUTIVE%20COMPENSATION.) +AND+DATE+IS+2008
Cai, J., & Milbourn, T. (2010, July 30). Bank executive pay. Retrieved from https://www.clevelandfed.org/en/newsroom-and-events/ publications/economic-trends/economic-trends-archives/2010-economic-trends/et-20100730-bank-executive-pay.aspx Cole, L. (2012). Credit unions report the highest loan
origi-nations for any first quarter on record for the indus-try. Retrieved from http://www.creditunions.com/news/ searchnewcopy/?search=1Q%202012
Congressional Oversight Panel. (2010). The AIG rescue, its impact on markets, and the government’s exit strategy. Retrieved from http://cybercemetery.unt.edu/archive/cop/20110402010341/ http:/cop.senate.gov/documents/cop-061010-report.pdf Congressional Oversight Panel. (2011). The final report of the
con-gressional oversight panel. Retrieved from http://cybercem-etery.unt.edu/archive/cop/20110401232213/http://cop.senate. gov/documents/cop-031611-report.pdf
Doyran, M. A. (2011). A time-series analysis of US savings and loan performance: Major trends and policy issues after the housing crisis. Proceedings of New York Conference, 611, 1-35. Retrieved from http://www.wbiconpro.com/611-Mine.pdf Dwyer, G. P. (2011). Capital at banks. Retrieved from https://www. frbatlanta.org/cenfis/publications/notesfromthevault/1104.aspx Dywer, H. J., Gould, J. S., & Lopez, R. H. (1999). Optimum capital/ asset ratios in the credit union industry: A managerial perspec-tive (Faculty Working Paper No. 31). Retrieved from http:// digitalcommons.pace.edu/cgi/viewcontent.cgi?article=1010& context=lubinfaculty_workingpapers
Elizalde, A., & Repullo, R. (2006). Economic and regulatory capi-tal in banking: What is the difference? International Journal of Central Banking, G21-G28, 1-29.
Federal Deposit Insurance Corporation. (2012). Available from https://www.fdic.gov
Federal Reserve, Board of Governors. (2011). Incentive compensa-tion practices: A report on the horizontal review of practices at large banking organizations. Retrieved from http://www.
federalreserve.gov/publications/other-reports/files/incentive-compensation-practices-report-201110.pdf
Financial Stability Board. (2012). Implementing the FSB principles for sound compensation practices and their implementation standards. Retrieved from http://www.fsb.org/wp-content/ uploads/r_120613.pdf?page_moved=1
FitzRoy, F., Jones, D., Vaughen-Whitehead, D., Klinedinst, M., Lajtai, G., Mygind, N., . . . Uvalic, M. (1998). Experts’ pol-icy report: Employee ownership in privatization. Budapest, Hungary: International Labor Organization.
Gelles, J. (2011, November). Bank transfer day a boon to credit unions, small banks. philly.com. Retrieved from http://articles. philly.com/2011-11-06/news/30366643_1_banks-report-debit-banking-industry
Gilbert, A. R., Kliesen, K. L., Meyer, A. P., & Wheelock, D. C. (2012). Federal reserve lending to troubled banks dur-ing the financial Crisis, 2007-10 (Working Paper Series No. 2012-006 A). Retrieved from https://research.stlouisfed.org/ wp/2012/2012-006.pdf
Goddard, J., McKillop, D., & Wilson, J. (2008). Consolidation in the US credit union sector: Determinants of failure and acqui-sition (PDF version). Retrieved from www.fdic.gov/bank/ana-lytical/cfr/Goddard_McKillop_Wilson.pdf
Goldman Sachs. (2011). 2010 annual report (PDF version). Retrieved from http://www.goldmansachs.com/investor-rela-tions/financials/fulfillment/reports/2010-annual-report.pdf Group of 30. (2012). Toward effective governance of financial
institutions. Retrieved from http://newsite.group30.org/publi-cations/detail/155
Hausman, J. A., & Taylor, W. E. (1981). Panel data and unob-servable individual effects. Econometrica, 49, 1377-1398. doi:10.2307/1911406
Hoel, R. F. (2011). Power and governance: Who really owns credit unions? (PDF version). Retrieved from https://filene.org/ assets/pdf-reports/244_Hoel_Power_Governance.pdf
Im, S., Kyung, A., Seung, C., Schmidt, P., & Wooldridge, J. M. (1999). Efficient estimation of panel data models with strictly exogenous explanatory variables. Econometrics, 93, 177-201. doi:10.1016/S0304-4076(99)00008-1
Jones, D. C., Kalmi, P., & Kauhanen, A. (2012). The effects of general and firm-specific training on wages and perfor-mance: Evidence from banking. Oxford Economic Papers,
64, 151-175. Retrieved from http://www.econstor.eu/bit-stream/10419/44581/1/598760857.pdf
Klinedinst, M. A. (2003). The new economy and forms of com-pensation. In D. C. Jones (Ed.), New economy handbook (pp. 627-641). San Diego, CA: Academic Press.
Kruse, D. L., & Blasi, J. R. (1997). Employee ownership, employee attitudes, and firm performance: A review of the evidence. In D. Lewin, D. J. B. Mitchell, & M. A. Zadi (Eds.), The human resource management handbook (pp. 113-151). Greenwich, CT: JAI Press.
Lucchetti, A., & Grocer, S. (2011, February 2). On street, pay vaults to record altitude. Wall Street Journal. Retrieved from http:// www.wsj.com/articles/SB10001424052748704124504576118 421859347048
Klinedinst 15
https://www.icas.com/__data/assets/pdf_file/0014/10553/121-The-Good-The-Bad-and-the-Ugly-SATER-ICAS.pdf
National Credit Union Administration. (2012). Credit union online. Retrieved from https://www.ncua.gov/analysis/Pages/call-report-data.aspx
Philippon, T., & Reshef, A. (2012). Wages and human capital in the U.S. financial industry. The Quarterly Journal of Economics,
127, 1551-1609. doi:10.1093/qje/qjs030
Rosen, C. (2002). The employee ownership update. Retrieved from http://www.nceo.org/columns/cr118.html
Schafer, D. (2012, June). Battles over astronomic pay may bring it down to earth. Financial Times. Retrieved from http://www. ft.com/cms/s/0/31698424-a5ac-11e1-a3b4-00144feabdc0. html#axzz3y05y54VV
Special Inspector General for the Troubled Asset Relief Program. (2012). Quarterly report to Congress, October 25, 2012
(PDF version). Retrieved from https://www.sigtarp.gov/ Quarterly%20Reports/October_25_2012_Report_to_ Congress.pdf
Taibbi, M. (2011). Wall street isn’t winning—It’s cheating.
Rolling Stone. Retrieved from http://www.rollingstone.com/ politics/news/owss-beef-wall-street-isnt-winning-its-cheat-ing-20111025
Taibbi, M. (2013). Secrets and lies of the bailout. Rolling Stone. Retrieved from http://www.rollingstone.com/politics/news/ secret-and-lies-of-the-bailout-20130104
Thanassoulis, J. (2012). The case for intervening in bankers’ pay.
Journal of Finance, 67, 849-895. Retrieved from http://www. jstor.org.lynx.lib.usm.edu/stable/23261328
U.S. Senate. (2011). Wall street and the financial crisis: Anatomy of a financial collapse (PDF version). Retrieved from http:// www.hsgac.senate.gov//imo/media/doc/Financial_Crisis/ FinancialCrisisReport.pdf?attempt=2
Volcker, P. (2011). Three years later: Unfinished business in finan-cial reform. Retrieved from http://graphics8.nytimes.com/ packages/pdf/business/23gret.pdf
Walter, S. (2010). Basel III and financial stability. Retrieved from http://www.bis.org/speeches/sp101109a.htm
Wilcox, J. A., & Dopico, L. G. (2011). Credit union mergers: Efficiencies and benefits. Retrieved from http://www.frbsf.org/ economic-research/publications/economic-letter/2011/septem-ber/credit-union-mergers-efficiencies-benefits/
Worth, J., Hampel, B., & Schenk, M. (2012). The 2012 economy: “Good, not great.” Retrieved from http://news.cuna.org/
articles/37617-the-2012-economy—good–not-great-Author Biography
Mark A. Klinedinst is an Emeritus professor of economics at the