www.atmos-meas-tech.net/9/1871/2016/ doi:10.5194/amt-9-1871-2016
© Author(s) 2016. CC Attribution 3.0 License.
Retrieval of aerosol optical depth in the visible range with a Brewer
spectrophotometer in Athens
Henri Diémoz1,2, Kostas Eleftheratos3,4, Stelios Kazadzis5, Vassilis Amiridis6, and Christos S. Zerefos4,7
1ARPA Valle d’Aosta, Saint-Christophe, Italy
2Institute of Atmospheric Science and Climate, CNR, Rome, Italy
3Faculty of Geology and Geoenvironment, University of Athens, Athens, Greece 4Biomedical Research Foundation, Academy of Athens, Athens, Greece
5PMOD/WRC, Davos Dorf, Switzerland
6National Observatory of Athens, Athens, Greece 7Navarino Environmental Observatory, Messinia, Greece
Correspondence to:Henri Diémoz ([email protected])
Received: 26 October 2015 – Published in Atmos. Meas. Tech. Discuss.: 18 January 2016 Revised: 11 April 2016 – Accepted: 12 April 2016 – Published: 28 April 2016
Abstract.A MkIV Brewer spectrophotometer has been op-erating in Athens since 2004. Direct-sun measurements orig-inally scheduled for nitrogen dioxide retrievals were re-processed to provide aerosol optical depths (AODs) at a wavelength of about 440 nm. A novel retrieval algorithm was specifically developed and the resulting AODs were compared to those obtained from a collocated Cimel fil-ter radiomefil-ter belonging to the Aerosol Robotic Network (AERONET). The series are perfectly correlated, with Pear-son’s correlation coefficients being as large as 0.996 and with 90 % of AOD deviations between the two instruments being within the World Meteorological Organisation (WMO) trace-ability limits. In order to reach such a high agreement, sev-eral instrumental factors impacting the quality of the Brewer retrievals must be taken into account, including sensitivity to the internal temperature, and the state of the external op-tics and pointing accuracy must be carefully checked. Fur-thermore, the long-term radiometric stability of the Brewer was investigated and the performances of in situ Langley extrapolations as a way to track the absolute calibration of the Brewer were assessed. Other sources of error, such as slight shifts of the wavelength scale, are discussed and some recommendations to Brewer operators are drawn. Although MkIV Brewers are rarely employed to retrieve AODs in the visible range, they represent a key source of information about aerosol changes in the past three decades and a po-tential worldwide network for present and future coordinated
AOD measurements. Moreover, a better understanding of the AOD retrieval at visible wavelengths will also contribute in improving similar techniques in the more challenging UV range.
1 Introduction
Aerosol particles emitted in the atmosphere from anthro-pogenic and natural sources have been recognised as one of the main drivers of climate change and the largest contribu-tors to its uncertainty (IPCC, 2014, and references therein). Indeed, through their ability to absorb and scatter solar ra-diation (direct effect) and to act as cloud condensation nu-clei (indirect effect), they impact the Earth’s radiative bud-get and the hydrological cycle (e.g. Lohmann and Feichter, 2005; Levy et al., 2013). Moreover, since aerosols adversely affect human health (WHO, 2006), their concentration in the lower atmosphere represents a key factor in air-quality man-agement, influencing decisions of policy makers especially in large cities and polluted areas.
representative-ness of the analysed series. In this regard, space-borne ra-diometers have been deployed to assess a global aerosol cli-matology (Torres et al., 2002; Mishchenko et al., 2007; Li et al., 2009) and ground-based networks of sun photometers, such as the Aerosol Robotic Network (AERONET; Holben et al., 1998), the Sky Radiometer Network (SKYNET; Taka-mura et al., 2004) and the Global Atmosphere Watch Preci-sion Filter Radiometer network (GAW-PFR; Wehrli, 2005), have been developed. The most advanced techniques allow for deriving a great variety of aerosol products (e.g. sin-gle scattering albedo, refractive index, phase function, size distribution), which are needed to study the microphysical– chemical properties of the particles and their interaction with radiation, but all networks provide, at least, information about the aerosol optical depth (AOD). The latter serves as a concise index of the atmospheric turbidity, and thus of the aerosol burden, and can be simply determined by estimating the attenuation of the direct solar beam throughout the atmo-sphere compared to the exoatmospheric irradiance (Langley, 1903).
Although conceived for column ozone concentration mea-surements, the Brewer spectrophotometer (Kerr et al., 1985) (hereinafter simply referred to as “the Brewer”) has been used for almost two decades to estimate the AOD (e.g. Bais, 1997; Marenco et al., 1997; Carvalho and Henriques, 2000) in both the ultraviolet (UV) range (all models) and the visible part of the solar spectrum (MkIV and MkV models only). At least two hundred Brewer spectrophotometers are operating all over the world (Kumharn et al., 2012), thus constituting a dense network that can be profitably exploited to gain valu-able past and present information about aerosols. To this end, the efforts in the framework of a recently started COST Ac-tion (EUBREWNET, http://www.eubrewnet.org/cost1207/) are focusing, among other topics, on standardising the AOD retrieval algorithm and developing the necessary quality as-surance/quality control protocols. For instance, at the mo-ment no standard algorithm or reliable travelling reference (as available for ozone calibration) are ready to calculate the AOD and check the calibration of the Brewers worldwide. As a consequence, every user has to adopt their own AOD retrieval technique and the procedures to track the radiomet-ric stability of his instrument.
Whilst extensive literature about AOD estimates with the Brewer in the UV band is available (e.g. Gröbner et al., 2001; Kerr, 2002; Marenco et al., 2002; Cheymol and De Backer, 2003; Arola and Koskela, 2004; Kazadzis et al., 2005; Chey-mol et al., 2006, 2009; De Bock et al., 2010, 2014), only one work exists to our knowledge which employs measure-ments of visible radiation (Gröbner and Meleti, 2004). Al-though this imbalance is likely to be ascribed to the predom-inant interest in the aerosol properties in the UV region, sev-eral factors could justify further investigation of AODs de-rived at visible wavelengths. First, about 80 MkIV Brewer spectrophotometers, operating in the 425–453 nm waveband, have been used worldwide (Kipp&Zonen, personal
commu-nication, 2015) and long-term records have been collected at their stations. Furthermore, the measuring spectral range of MkIV Brewers nicely overlaps with the operating wave-lengths of other sun photometers, thus avoiding the need of extrapolations in order to compare different kind of instru-ments. Finally, measuring AOD in the blue band is, in prin-ciple, simpler than in the UV, since several instrumental is-sues, such as the effects of spectral stray light, finite band-width (Slusser et al., 2000) and diffuse radiation entering the field of view (FOV) due to the aerosol forward scattering peak (Russell et al., 2004), are reduced at larger wavelengths. Therefore, a better understanding of AOD retrieval in the vis-ible range may be a first step and a useful test bench towards improving AOD estimates at smaller (and more demanding) wavelengths.
The present paper concerns AOD measurements in the blue region obtained with a MkIV Brewer in Athens since 2004. Several reasons make this location optimal for the study. First, both the concentration and the aerosol types in Athens are of great variety (Sect. 2.1) and interesting corlations have been recently found between the economic re-cession (from 2008 onward) and the concentration of pollu-tant trace gases in Athens (Vrekoussis et al., 2013). Second, the Brewer is installed beside a Cimel photometer, operating since 2008 in the framework of AERONET. Hence, not only can this Brewer be effectively compared for the first time and for a long period to a well-maintained reference photometer, but it can also be used as a backup instrument to fill the gaps in the Cimel data set (e.g. when the Cimel was not working or was uninstalled for regular calibration) and to extend the AOD series by four years prior to the Cimel installation (e.g. before the period of the economic recession).
retriev-ing AOD usretriev-ing the Brewers; thus it is also useful for MkIV Brewer operators who want to estimate the AOD at their sites in cases where they do not apply their own AOD retrieval technique. The exploitation of the capability of MkIV Brew-ers to retrieve AOD based on the AERONET direct-sun pro-cessing scheme and the detailed description of the potentials, limitations and uncertainties of MkIV Brewers in retrieving AOD in the visible range distinguish this work from previous ones.
The paper is structured as follows. Section 2 introduces the measurement location, instruments and data sets employed in the study; Sect. 3 describes the updated algorithm; factors affecting the retrieval are examined in detail in Sect. 4; the overall performance of the Brewers is then summarised and some recommendations for Brewer operators are formulated in Sect. 5. Finally, conclusions are drawn in Sect. 6.
2 Instruments and data 2.1 Experimental site
The instruments described in this study are operated on the roof of the Biomedical Research Foundation of the Academy of Athens in Greece (38.0◦N, 23.8◦E, 130 m a.s.l). The cam-pus is located in a green area at a distance of about 4 km from the centre of the city and is thus partly influenced by urban emissions. Due to the distance to the department of-fices, the operator in charge of the Brewer can access the station only once or twice a week, e.g. to clean the external optics and check the instrument for proper operation. Aerosol conditions in Athens have been addressed in previous stud-ies and have been found to range from relatively clean mar-itime conditions to long-range desert dust transport episodes, smoke advection from forest fires and small particles typical of an urban and industrialised environment (e.g. Pissimanis et al., 1994; Eleftheriadis et al., 1998; Colbeck et al., 2002; Adamopoulos et al., 2007; Tsaknakis et al., 2011; Kaskaoutis et al., 2007; Kosmopoulos et al., 2008; Liu et al., 2009; Gera-sopoulos et al., 2011; Amiridis et al., 2012).
2.2 Brewer spectrophotometer
A MkIV Brewer spectrophotometer (serial number #001) has been operating at the measurement site since 2004. The in-strument, being a dual Brewer, is able to retrieve the col-umn concentrations of both ozone, from measurements of UV irradiance (306–320 nm, o3 mode), and nitrogen dioxide in the visible band (425–453 nm, n2 mode) (Diémoz et al., 2014). When performing direct-sun (DS) measurements, as the ones used in the present study, the tracker turns the spec-trometer towards the sun and the solar beam penetrates the instrument through a flat quartz window. Direct-sun mea-surements are restricted to solar zenith angles (SZAs) lower than 78◦due to possible shadows by the border of the win-dow. Light is then attenuated by a set of filters installed in
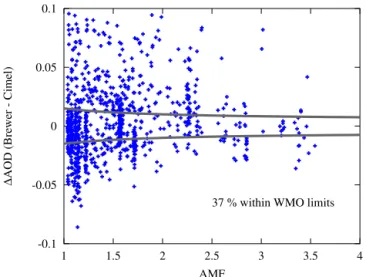
Table 1.Measuring wavelengths and resolutions, expressed in terms
of full width at half maximum (FWHM), of Brewer #001 corre-sponding to the default grating position in n2 mode.
Slit Wavelength (nm) FWHM (nm) 1 425.03 0.61 2 431.40 0.86 3 437.36 0.85 4 442.86 0.86 5 448.12 0.86 6 453.26 0.85
the fore-optics, which have a thickness that is selected to maintain the detector in a linear working regime. Although often assumed to be neutral (as in the standard ozone and nitrogen dioxide retrievals), these filters are actually known to introduce a slight spectral absorption which must be con-sidered (Sect. 3). The light beam enters a single monochro-mator and is then projected onto a holographic plane diffrac-tion grating, which acts as the dispersing element. The grat-ing, rotated by a high-precision stepper motor, is used at the third order in the UV and at the second order in the vis-ible spectrum. The polychromatic light emerging from the grating leaves the monochromator through a set of slits, al-ternately opened by a rotating slitmask, which ensures near-simultaneous (i.e. within about 1.6 s) measurements at up to six different wavelengths with a resolution ranging from 0.6 to 0.9 nm. A dispersion test with an accurate fitting function (Gröbner et al., 1998) was performed to determine the oper-ating wavelengths and resolutions at the default groper-ating posi-tion when the Brewer is in n2 mode (Table 1). The results of the dispersion test were also taken into account to correctly downscale the cross sections of the atmospheric absorbers used within the AOD calculation to the instrumental resolu-tion. A photomultiplier tube (PMT) is employed to provide photon counts, which are proportional to the irradiance en-tering the instrument at each wavelength. A DS sequence consists of 5 sets of 20 cycles of measurements, which are then averaged to increase the signal-to-noise ratio (SNR). In the present work, however, the five sets have been analysed as separate measurements to allow a better cloud screening, since the SNR was already considered satisfactory before av-eraging due to the fact that more photons are available at vis-ible wavelengths compared to the UV.
2.3 Cimel sun-sky photometers
Table 2.Measuring wavelengths of Cimel #395. The nominal
reso-lution is 10 nm (FWHM) for each filter.
Filter Wavelength (nm)
1 340.4
2 379.7
3 439.3
4 500.4
5 675.4
6 870.1
7 936.5
8 1020.3 9 1639.6
filter is 10 nm (FWHM). The instrument is able to mea-sure AOD and various other aerosol optical properties. Mea-surements of sun and sky radiances at a number of fixed wavelengths within the visible and near-infrared spectrum are performed and advanced retrieval inversion algorithms for retrieving microphysical aerosol properties have been de-veloped (Dubovik and King, 2000) and assessed (Dubovik et al., 2000) in the framework of AERONET. Further de-tails concerning AERONET data and uncertainties, for AOD retrievals can be found at http://aeronet.gsfc.nasa.gov/new_ web/data_description_AOD_V2.html and those related to inversion products at http://aeronet.gsfc.nasa.gov/new_web/ Documents/Inversion_products_V2.pdf. Only AOD data from AERONET level 2.0 (cloud screened and quality-assured; Holben et al., 2006) have been used in the study.
2.4 Data sets
The present work mainly focuses on two subsets of the full series recorded by Brewer #001 since 2004. The most recent subset includes an intensive campaign (13–25 May 2014, i.e. Julian days 133–145) specifically arranged for the pur-pose of comparing the Brewer and the Cimel on a short-term basis and quantifying some instrumental effects (e.g. sensitivity dependence on temperature) with maximum ac-curacy. For example, the Brewer optics were cleaned every day of the campaign to ensure maximum accuracy. Further-more, the Brewer was often checked to correctly point to the sun and an ad-hoc schedule was designed to provide as many DS measurements in n2 mode as possible, resulting in more than 8000 samples, among which 170 were nearly simultaneous (i.e. within ±1 min) with the Cimel. During
the intensive campaign, the sky conditions were generally favourable with only few clouds. The AOD at 440 nm from AERONET ranged from 0.04 to 0.39 and the Ångström co-efficient obtained in the range 380–500 nm varied from 0.3 to 1.8. Those values reflect the different origin of air masses, including three episodes of advection of mineral dust from the Sahara desert (i.e. days 134, 139–140 and 144–145), as
demonstrated by the study of the backward trajectories (not shown here).
The second subset encompasses all measurements since 2008, i.e. the period when the series by both instruments overlap. This allowed us, for example, to study the radio-metric stability of the Brewer and the limitations of the Lan-gley calibrations performed on site. The full series collected by Brewer #001 since 2004 will be the focus of a follow-up paper dealing with the long-term analysis of AOD measure-ments in Athens, e.g. before and after the economic recession in Greece.
3 Algorithm
A novel AOD retrieval algorithm was specifically developed to reprocess the Brewer data. Special attention has been given to adopt a processing scheme similar to the one used within AERONET, since any slight discrepancy between both procedures can trigger unexplained biases between the measurement series. The AOD (τaer) calculation is based
on the following adaptation of the Beer–Lambert–Bouguer law (Bouguer, 1729), which includes the atmospheric fac-tors contributing to the solar beam extinction (absorption and scattering) and all Brewer instrumental issues known at present.
lnI (λ)+TC(T )+PC(θ )+lnAFp(λ)=
lnI0(λ)−2 lndE−S−µRayβRay(λ) P Pstd
−µNO2σNO2(λ) XNO2(t )−µaerτaer(λ) (1)
1. I represents the count rates proportional to the
direct-sun irradiance at the ground, at the wavelengthλ
cor-responding to each Brewer slit. The traditional data re-duction (e.g. Kipp&Zone, 2007) – consisting of the sub-traction of the dark counts, the conversion from photon counts to count rates and the dead time compensation – is applied.
2. I0is the extraterrestrial constant (ETC), i.e. the count
rate value at wavelengthλthat would be measured by
the Brewer outside the Earth’s atmosphere.
3. No correction for the variation in the temperature inside the instrument is usually applied for Brewer measure-ments in the visible. However, a temperature effect has been noticed during this study (Sect. 4.1) and a compen-sation (TC) will be accordingly adopted later in the text as a function of the temperature,T, measured inside the
Brewer.
a polarisation correction, PC, is introduced, which de-pends on the angle between the normal to the quartz window plane and the solar zenith angle θ. The
com-pensation is based on the theoretical formula (method 1) described by Cede et al. (2006), since no experimen-tal characterisation of such an effect for Brewer #001 is available. More details are provided in Sect. 5.1.
5. AF is the linear attenuation of filter p at wavelength λ. The spectral attenuations have been characterised in
Brewer #001 using the internal standard lamp, as ex-plained by Diémoz et al. (2013).
6. The factor 2 lndE−S takes into account the change of the extraterrestrial irradiance due to the variation of the Earth–Sun distance, dE−S (in astronomical units), throughout the year.
7. βRay(λ) indicates the Rayleigh scattering coefficient,
taken from Bodhaine et al. (1999).βRay(λ)is then
ad-justed for the current pressure,P, relative to a standard
pressure,Pstd. For the period when both the Brewer and
the Cimel were working, the same pressure considered by the Cimel is used for both instruments. Alternatively, the pressure measured at the National Observatory of Athens at the same altitude is considered.
8. The air mass factors (AMFs),µ, used in the above
equa-tion for the Rayleigh scattering, nitrogen dioxide ab-sorption and aerosol extinction, are taken from Kasten and Young (1989). The calculation of the solar zenith angle (Michalsky, 1988) includes a correction for the atmospheric refraction. All computations relative to the sun’s position (SZA and AMFs) as a function of time have been carefully checked against the information provided by the AERONET output, showing perfect agreement.
9. σNO2 represents the nitrogen dioxide (NO2) absorption
cross section at wavelength λ. The spectroscopic data
set by Burrows et al. (1998) at 273 K is selected as it is the one used by AERONET (A. Smirnov, per-sonal communication, 2015) and a convolution to the Brewer bandpass is operated for each different slit as explained by Diémoz et al. (2014). Finally, the nitro-gen dioxide column densities,XNO2, extracted from the
AERONET monthly climatology for Athens and based on the SCIAMACHY data set (http://aeronet.gsfc.nasa. gov/version2_table.pdf and references therein), are em-ployed to process the Brewer data and remove the NO2
contribution from the AOD. More details are given in Sect. 5.1.
4 Results
4.1 Instrument temperature dependence
As a first step in the study, the Brewer sensitivity changes owing to temperature variations inside the instrument have been quantified. The respective correction has been calcu-lated and has then been applied to the full series. In order to reach maximum accuracy and to exclude interfering effects acting on a longer term, we used the data collected during the intensive campaign (Sect. 2.4). Moreover, to be as close as possible to the Cimel, we opted to transfer the calibration from the Cimel to the Brewer. Therefore, in this first analysis, the Brewer was not considered as a stand-alone instrument, but as if an independent reference instrument (such as a trav-elling standard) existed to calibrate it. To transfer the cali-bration, Eq. (1) was inverted to provide lnI0(λ)givenτaer(λ)
from the Cimel. The AOD obtained by the Cimel at about 440 nm was extrapolated to the Brewer wavelengths using the Ångström law (Eq. 2).
τaer(λ)=β λ−α, (2)
where the wavelengthλis expressed in µm andαandβ are
the Ångström exponents retrieved by the Cimel. The method is expected to introduce negligible uncertainty owing to the short wavelength range of the extrapolation and the smooth-ness of the AOD spectral dependence. For every pair of near-simultaneous measurements obtained by both instruments, a series of lnI0was calculated and its average at every slit was
defined as the best ETC estimate. The corresponding stan-dard deviations during the intensive campaign were as low as 0.01, which demonstrates the high accuracy of the trans-fer. Since only near-simultaneous observations were consid-ered, and the AERONET data are already filtered for clouds (Smirnov et al., 2000), no cloud screening method is used at this point.
This preliminary comparison between AODs measured by the Cimel and the Brewer reveals high correlation, with a Pearson’s coefficientρ=0.993 (R2=0.986; only statistics
relative to wavelength 437 nm, i.e. the third slit of the Brewer, will be reported hereafter for the sake of simplicity). The lin-ear regression between both series (not shown) obeys the re-lationτaerBrewer= −0.01+1.09τaerCimel. The mean deviation is
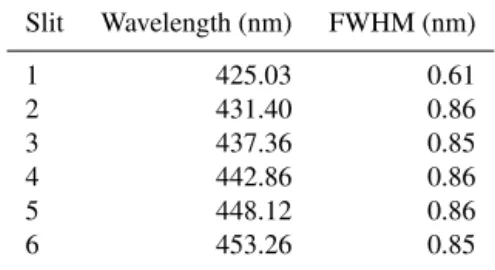
null, as a consequence of the ETC transfer from the Cimel to the Brewer using the same data set. A better way of rep-resenting the deviations between the series is to plot1AOD
against the air mass. Figure 1a shows that about 60 % of the AOD differences fall within the limits±(0.005+0.010/µaer)
defined in WMO-GAW report number 162 (WMO, 2004), whereas a minimum of 95 % would be requested to formally establish an intercomparison traceability (e.g. Kazadzis et al., 2014).
Figure 1a seems to suggest that1AOD varies as a
mea--0.02 -0.015 -0.01 -0.005 0 0.005 0.01 0.015 0.02
1 1.5 2 2.5 3 3.5 4
∆
AOD (Brewer - Cimel)
(a)
-0.02 -0.015 -0.01 -0.005 0 0.005 0.01 0.015 0.02
1 1.5 2 2.5 3 3.5 4
∆
AOD (Brewer - Cimel)
AMF (b)
Figure 1.Differences of AODs measured at 437 nm by both instru-ments as a function of the air mass during the campaign period. The curved lines represent the acceptance limits fixed by WMO (2004). The upper figure is obtained without correcting for the Brewer tem-perature, whereas the lower shows the temperatucompensated re-sults as explained in Sect. 4.1.
sured inside of the Brewer (which approximately covaries with air mass). Figure 2 displays the ETCs transferred from the Cimel to the Brewer as a function of the Brewer in-ternal temperature. Assuming that the transferred ETC esti-mates are insensitive to changes of the Cimel temperature, the results indicate that the Brewer radiometric sensitivity decreases by about 0.3 % K−1. This value is fully compati-ble with previous assessments of the PMT temperature de-pendence (Meltzer et al., 2000; Weatherhead et al., 2001; Taylor and Kimlin, 2002). It is worth noticing that a well-known Brewer component triggering large temperature de-pendences in o3 mode, i.e. the NiSO4 filter, is not inserted
when measuring visible radiation. When the temperature ef-fect is taken into account, the differences between the Brewer and the Cimel almost vanish (Fig. 3). The new Pearson’s
co-17.02 17.04 17.06 17.08 17.1 17.12 17.14
20 25 30 35 40
ln(I
0
)
T (°C)
Figure 2.Relation between the transferred ETCs and the Brewer
internal temperature. The dashed line represents a linear regres-sion and indicates a decrease of the Brewer sensitivity of about 0.3 % K−1.
0 0.1 0.2 0.3 0.4 0.5
134 136 138 140 142 144
AOD
Day of year (2014)
Brewer Cimel
Figure 3.AOD at 437 nm (slit 3 of the Brewer) measured by the
Brewer (crosses) and the Cimel (dots). Only near-simultaneous measurements are plotted. The Brewer estimates are corrected for the effect of the instrument temperature as explained in Sect. 4.1.
efficient isρ=0.996 (R2=0.992) and the equation for the
regression between both series isτaerBrewer=0.00+0.99τaerCimel
(Fig. 4). Figure 1b shows that about 90 % of the AOD differ-ences now fall within the WMO traceability limits.
4.2 Radiometric stability
trans-0 0.05 0.1 0.15 0.2 0.25 0.3 0.35 0.4
0 0.05 0.1 0.15 0.2 0.25 0.3 0.35 0.4
AOD Brewer
AOD Cimel y=x
Fit
y=0.00+0.99x
Figure 4.Scatterplot between AOD estimates by the Cimel and the Brewer during the intensive campaign.
16.95 17 17.05 17.1 17.15 17.2 17.25
2008 2009 2010 2011 2012 2013 2014
ln(I
0
)
Year All data Monthly averages
Figure 5.ETCs retrieved by transfer from the Cimel to the Brewer
at slit 3. Dots identify estimates from near-simultaneous pairs of measurements, squares represent monthly averaged values.
ferred from the Cimel to the Brewer, this time using the multi-year series. For every pair of near-simultaneous mea-surements from both series (nearly 1000 points), the ETC that produced the best agreement was found (Fig. 5). Some gaps are visible in the figure, corresponding to the periods when the Cimel was uninstalled for the regular calibration or when the Brewer schedule did not include DS visible mea-surements. Then, the average ETC (for every slit) was taken as the best estimate for the whole period. The resulting ETCs differ by only 0.01 compared to the calibration constants ob-tained during the intensive campaign (Sect. 4.1). However, the standard deviation of the series is 0.05 and differences larger than this value occur. Since the reported ETCs are log-arithmic, their scatter is directly related to the AOD uncer-tainty at AMF=1. Moreover, a seasonal cycle, with maxima
in summer and minima in winter, seems to emerge from the
0 0.1 0.2 0.3 0.4 0.5 0.6 0.7
2008 2009 2010 2011 2012 2013 2014
AOD
Year
Figure 6. AODs measured by the Brewer at the wavelength of
437 nm in the overlapping period 2008–2014.
0 0.2 0.4 0.6 0.8 1
0 0.2 0.4 0.6 0.8 1
AOD Brewer
AOD Cimel y=x
Fit
y=0.01+0.97x
Figure 7.Scatterplot between AOD estimates by the Cimel and the
Brewer for the period 2008–2014.
figure. This systematic behaviour, which is not fully under-stood at present, could be marginally due to a slight over-correction for the polarisation or for the Brewer temperature (Sect. 5.1). Finally, there does not seem to be a trend in the ETCs, however a modest drop after 2011 can be noticed. Al-though this variation occurs just after a calibration period of the Cimel, the strict quality controls by AERONET would rather favour the hypothesis of a change in the sensitivity of the Brewer instrument. The effect is of the order of 0.05 at air mass 1 and therefore lower at larger air masses (cf. later in this section).
Chey--0.1 -0.05 0 0.05 0.1
1 1.5 2 2.5 3 3.5 4
∆
AOD (Brewer - Cimel)
AMF
37 % within WMO limits
Figure 8.Differences of AODs measured at 437 nm by both
instru-ments in the period 2008–2014 as a function of the air mass and acceptance limits fixed by WMO (2004).
mol and De Backer, 2003). The average trend of the dif-ferences between the AODs measured by the Brewer and the Cimel in the period 2008–2013 is 0.003 year−1. Even though the trend is small, it appears to be statistically sig-nificant. Trials with the Student’st test (Student, 1908) and
the nonparametric Mann–Kendall trend test (Mann, 1945; Kendall, 1938) all gave statistically significant results (Stu-dent’sttest:tvalue=4.31471,pvalue<0.0001,N=924;
Mann–Kendall test:τ statistics=0.124, 2-sidedp value<
2.22×10⁻¹⁶). The trend is likely to be the consequence of
the Brewer radiometric instability which has already been de-scribed previously in this section.
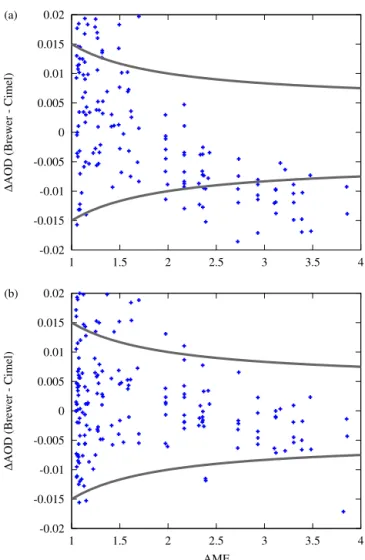
The Pearson’s correlation coefficient between the Brewer and Cimel multi-year series isρ=0.97 (R2=0.93) and the
equation for the regression between both series isτaerBrewer=
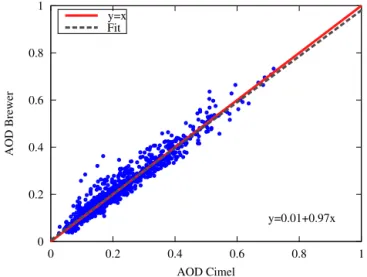
0.01+0.97τaerCimel(Fig. 7). Figure 8 shows that about 40 % of
the AOD differences fall within the WMO traceability limits. The root mean square deviation (RMSD) between the series is 0.03 for all slits except for the data recorded through the second Brewer slit (wavelength 431 nm). At this wavelength, all statistical indicators are worse (e.g. RMSD =0.05;ρ=
0.90; points inside WMO limits=20 %), and the reason will
become clear in Sect. 4.4.
4.3 In situ Langley ETC extrapolation
A truly independent comparison between the Cimel and the Brewer would require separate calibrations for both instru-ments, whereas in the previous calculations, the ETC was simply transferred from the former to the latter. An indepen-dent calibration of the Brewer would also allow us to check and track its stability for the periods when the Cimel was not installed. We therefore explore the possibility of retriev-ing the Brewer ETCs by applyretriev-ing a Langley extrapolation
technique at the Athens station. Since Brewer #001 has never been moved to a high-altitude and pristine site, which would satisfy the hypothesis of constant AOD during the day actu-ally needed for a Langley plot, a long-term analysis of the data recorded on site was preferred, as often done in the lit-erature (e.g. Cheymol and De Backer, 2003; Cheymol et al., 2006, 2009; De Bock et al., 2010, 2014; Gröbner and Meleti, 2004). Also, since only a few AOD measurements per day were scheduled for the Brewer during this period, we can-not perform the Langley plot with such a small number of clear-sky days.
When no a priori information about AOD stability or pres-ence of clouds is available, we can only rely on the irradiance data to select the most suitable days for a Langley extrapola-tion. We have established the following criteria.
1. First, a homogeneity test is performed on every quin-tuplet of samples rapidly recorded in a DS sequence (Sect. 2.2) to remove the influence of moving clouds in front of the sun. A linear fit of the logarithm of the intensities vs. air mass is performed and the range of the residuals is compared to a threshold proportional to the air mass (0.036µ). This value, which is directly
related to the range of the AOD during the short time of a sequence, was chosen to provide the best agree-ment (98 %) with the cloud screening performed by AERONET (Smirnov et al., 2000).
2. A basic quality control is performed to avoid point-ing errors and thick clouds. The raw counts recorded through the slits must be 10 times larger than those recorded with the shutter (dark counts) and the differ-ence between the counts through the slits and the dark counts must be larger than a fixed threshold of 250. 3. The attenuation of the neutral density filters must be at
least 101 (filter wheel position≥2). This criterion
re-moves measurements under thick clouds (that may pass the homogeneity test) and at very high air masses (when clouds are more likely on the horizon).
4. For every day, the morning and afternoon data are anal-ysed together to provide better statistics, since, due to the Brewer schedule, not many points per day are avail-able. Data with large AOD gradients during the day are screened by the next criteria, especially if the variation is not centred around noon.
5. A robust (least absolute deviations), linear fit is per-formed through the points of the entire day. Contrary to what was done at point 1, a different parameterisa-tion was chosen due to the larger range of air masses.
µ−1logI is now plotted againstµ−1, so that the
resid-uals from the fit (on they axis) are directly traceable
to the variations of τaer. In case the absolute value of
16.4 16.6 16.8 17 17.2 17.4
2004 2006 2008 2010 2012 2014
ln(I
0
)
Year
Figure 9.Extraterrestrial constants for calibration of measurements
through slit 3 (squares) derived using Langley extrapolations in se-lected days. The horizontal dashed line represents the average of all points.
point is removed and the fit performed again. The re-gression also provides a first estimate of the average AOD during the day, which must be positive and lower than 0.4. This upper limit was chosen to exclude days with very high aerosol loads or contaminated by clouds from the Langley extrapolation. The value of 0.4 cor-responds to the 90th percentile of the AERONET AOD series at 440 nm.
6. After previous criteria have been applied, the total num-ber of samples in the day must be no less than 50 (cor-responding to 10 full cycles) (Cheymol and De Backer, 2003) and the minimum range of AMFs must be at least 1.3 (Gröbner and Meleti, 2004).
One hundred and sixty cases successfully passed the previ-ous criteria for the Langley calibrations (Fig. 9). The average of the resulting ETCs at 437 nm is 17.09, only 0.03 lower than the average of the ETCs retrieved by transfer. However, the scatter is very high, with a standard deviation of 0.10. Therefore, a deeper analysis was carried out to determine whether the spread is random or due to any physical reason. For example, temporal changes of the AOD during the day, typical of the urban environment, would invalidate the as-sumption at the basis of the Langley technique and impair the results of the calibration. Indeed, if the variations were symmetric about the solar noon, they could easily mislead any acceptance criteria solely based on the Langley regres-sion (Marenco, 2007). To quantitatively test this hypothesis, we fit the daily evolution of the AOD from AERONET using two simple functions of the AMF symmetric around the local
16.4 16.6 16.8 17 17.2 17.4
-0.2 -0.1 0 0.1 0.2 0.3 0.4 0.5
ln(I
0
) from Langley
k1
16.4 16.6 16.8 17 17.2 17.4
-0.08 -0.06 -0.04 -0.02 0 0.02 0.04
ln(I
0
) from Langley
k2
Figure 10.Influence of the AOD daily cycle on extraterrestrial
cal-ibration constants retrieved by Langley plots (slit 3).k1andk2
rep-resent the magnitude of the curvature of the daily variation as pa-rameterised in Eqs. (3) and (4). The dashed lines show the fit to the points. The correlation indexes of the retrieved ETC tok1andk2
are−0.75 and 0.76.
noon:
τaer=τ0+ k1
µaer (3)
τaer=τ0+k2µaer. (4)
It is easy to prove that, if the daily evolution were fectly described by Eq. (3), all Langley events would per-fectly fall into a straight line, but the error in estimating the ETC would be−k1. As noticeable in Fig. 10, a good
correla-tion can be found between the ETCs retrieved by the Langley technique and the daily curvature of the AOD measured by the Cimel instrument and parameterised by the two variables
k1 andk2. The correlation indexes are −0.75 and 0.76
-0.015 -0.01 -0.005 0 0.005
0 10 20 30 40 50 60 70 80
∆
AOD
SZA
Slit 1 Slit 2 Slit 3 Slit 4 Slit 5 Slit 6
Figure 11. Effect of slight wavelength misalignments in Brewer
measurements. 1AOD represents the difference of the AOD
re-trieved at shifted wavelengths (+0.02 nm) compared to the results
using an unperturbed wavelength scale, as a function of the solar zenith angle.
4.4 Wavelength shifts
In a Brewer spectrophotometer, the wavelength scale is ad-justed with reference to the emission spectrum of an inter-nal mercury lamp. Although the precision of the method can reach 0.1 steps, some factors, among which temperature changes inside the monochromator (to an extent of about 0.3 steps K−1), may degrade the alignment. We therefore investi-gated the effect of small wavelength shifts on AOD retrieved by the Brewer using both theoretical considerations based on a radiative transfer model (RTM) and a statistical analysis of the overlapping period. It has to be mentioned that other instruments equipped with a monochromator, not only the Brewer, could be affected by the same issue as well. More-over, the sensitivity to wavelength misalignments could also affect nitrogen dioxide measurements by MkIV Brewers.
First, the libRadtran v1.7 model (Mayer and Kylling, 2005) was set to simulate ground-based solar spectra with a known aerosol load. A standard US atmosphere (NASA and USAF, 1976), including vertically distributed aerosols based on the model by Shettle (1989) and 0.5 DU of nitrogen diox-ide, was selected. Surface albedo was set to 0.03, pressure to 1000 hPa and altitude to 130 m a.s.l. The extraterrestrial con-stant, needed for the AOD inversion, was found by means of a Langley extrapolation applied to the spectra simulated at different air masses. The Ångström parameters were set to α=1.5 andβ=0.07, which represent the average
val-ues in Athens extracted from the AERONET series. The re-trievals were then repeated by simulating a slight wavelength misalignment in the Brewer measurements. Figure 11 illus-trates the AOD error induced by a wavelength misalignment of 0.02 nm (corresponding to a shift of 2 microsteps by the
0.5 0.6 0.7 0.8 0.9 1
428 430 432 434 436
W/(m
2 nm)
nm
Figure 12.Simulated direct-sun spectrum convoluted to the Brewer
bandwidth (slit 2). The dark-grey vertical line shows the central wavelength of Brewer measurements through the second slit, which is on the edge of a deep Fraunhofer line. The light-grey dashed lines represent the Brewer resolution at the second slit.
grating motor), which is not uncommon in Brewer #001, as a function of the SZA. Surprisingly, measurements through slit 2 are considerably affected by shifts in the wavelength scale and the error in AOD due to this effect can be larger than 0.01. The behaviour is to be ascribed to the proxim-ity of the measuring wavelength to a deep Fraunhofer line (Fig. 12). Therefore, due to the high gradient of the irradi-ance in this spectral region, small changes in the wavelength scale can trigger large variations in the extraterrestrial con-stant and thus, in the resulting AOD. As a consequence, mea-surements at slit 2 are expected to be of lower quality than at other wavelengths.
re--1 -0.5 0 0.5 1
430 435 440 445 450
Arbitrary units
Wavelength (nm)
Mode 2 dlnI(λ)/dλ
-0.1 -0.05 0 0.05 0.1
2008 2009 2010 2011 2012 2013 2014
Scores
Year
Figure 13.Second component (carrying about 5 % of the variance)
from the PCA. The wavelength derivative of the solar spectrum is plotted together with the mode of variation in the upper figure. In the lower panel, the corresponding scores (points) are drawn to-gether with the events (dashed lines) that could potentially affect the wavelength alignment of the Brewer.
ported by the user on the instrument logbook (dashed lines in lower panel) that may have affected the wavelength scale of the Brewer. For example, the user manually repositioned the diffraction grating micrometer after a power failure. It must be noticed that a well-working Brewer should not present this behaviour and that the effect could reveal some micrometer fault. The wavelength scale of the Brewer can additionally change when the internal mercury lamp, serving as the wave-length reference, is replaced or simply moved, since the di-rection of the light beam from the lamp inside the monochro-mator slightly depends on the position of the source. For this reason, the user should regularly check the Brewer wave-length alignment (especially, before and after the mercury lamp has been replaced) by a sun-scan test using the well-known structure of the Fraunhofer lines of the solar spec-trum. Finally, the wavelength alignment can also gradually change in between the events listed above, e.g. as a result of temperature variations inside the instrument that are not fully accounted by the mercury lamp test (hg test).
4.5 Other effects
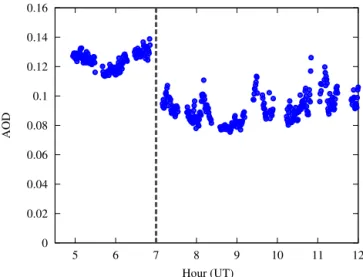
Other instrumental issues can affect the Brewer AOD esti-mates. First, the effect of some dust accumulating on the Brewer quartz window, likely as a consequence of a Saha-ran dust advection accompanied by precipitation, was studied before the beginning of the intensive campaign. On day 127, continuous AOD measurements were taken before and after cleaning the dirty window, evidencing an apparent decrease of about 0.04 of the measured AOD (Fig. 14) – a drop of about 30 % in the considered day. The effect would not prob-ably manifest itself in ozone or nitrogen dioxide retrievals,
0 0.02 0.04 0.06 0.08 0.1 0.12 0.14 0.16
5 6 7 8 9 10 11 12
AOD
Hour (UT)
Figure 14.Effect of cleaning the Brewer quartz window from dust
(day 127). The vertical line shows the time when the window was cleaned.
0 0.1 0.2 0.3 0.4 0.5 0.6 0.7 0.8
6 8 10 12 14
AOD
Hour (UT)
Figure 15.Effect of pointing inaccuracies on Brewer AOD
esti-mates (day 128). The vertical line represents the time when the iris border starts cutting the sun image.
since those calculations are based on irradiance ratios and not on absolute intensities, but it is prominent for AOD esti-mates (about three times out of the specifications by WMO at the selected AMF).
Both examples underline the importance of carefully maintaining and cleaning the Brewer, especially when accu-rate AOD measurements are planned.
5 Discussion
A quantitative assessment of the uncertainty budget, not sim-ply based on a statistical approach, is beyond the scope of this paper. Nevertheless, we discuss the most important fac-tors contributing to the uncertainty of Brewer AOD estimates in the visible range and we present some recommendations for Brewer operators. The discussion is split in two different sections, i.e. the factors which are mostly specific of MkIV Brewers and the ones common to other networks, including AERONET.
5.1 MkIV Brewer-specific contributors to uncertainty
1. The effect of temperature dependence discovered dur-ing this study and described in Sect. 4.1 is influen-tial enough to trigger a seasonal cycle as large as
±6 %, reflecting temperature changes of ±20 K
dur-ing the year. A compensation algorithm has therefore to be applied, but the related uncertainties have to be taken into account. Firstly, the Brewer is equipped with three temperature sensors, of which one is installed in the PMT assembly and representative of its tempera-ture. However, we noticed malfunctioning in Brewer #001 sensors, with random and unrealistic temperature spikes. Moreover, the series shows a constant trend of
−0.4 K year−1, with no evident physical cause. Hence,
temperature measurements inside the instrument should be carefully checked before taking them into account when applying temperature corrections to the Brewer data (both AOD and other kind of estimates). Secondly, the temperature correction itself is affected by uncer-tainties. When retrieving the correction using a series of measurements from a collocated reference instrument, covariates (e.g. internal polarisation, air mass, count rates) all varying throughout the day could increase or decrease the impact of temperature only. For example, a slight overcorrection is probably the reason behind the seasonal cycle identified in Sect. 4.2. A different char-acterisation method could make use of the tungsten-halogen lamp inside the Brewer. However, the main concern in this case is the stability of the 20 W lamp compared to the accuracy required for the temperature characterisation and more investigations are therefore required. Finally, it has to be observed that the temper-ature compensation does not substantially improve the results of the comparison when applied to the full period of overlapping measurements (Sect. 4.2), since proba-bly other factors affect the estimates more severely, such
as the effect of dirt accumulating on the quartz window (Sect. 4.5).
2. If not compensated, the effect of the internal polari-sation would reduce the Brewer sensitivity, especially at large SZAs, and the estimated AOD would thus ap-parently increase. However, since internal polarisation is also impacting the calibration, two different scenar-ios must be considered: if the instrument is calibrated by Langley extrapolation, the polarisation introduces a negative curvature to the plot and a resulting overesti-mation of the retrieved ETC (e.g. by 2–4 %), so that the overall effect is amplified; conversely, if a calibra-tion transfer from a reference instrument is done, then the ETC is underestimated at large SZAs and the er-ror on the final ETC will depend on the range of air masses used for averaging. Furthermore, it must be noticed that the Brewer sensitivity decreases at small air masses due to the instrumental temperature depen-dence, since higher temperatures are generally expected at noon. Therefore, the dependences of temperature and polarisation partially mask each other. If none of these effects are compensated, then the diurnal sensitivity will vary less than if only one factor is considered.
In this study, the effect of internal polarisation was com-pensated using the theoretical formula by Cede et al. (2006), which was successfully tested on MkIII Brew-ers supplied with a double monochromator. ConvBrew-ersely, MkIV Brewers are equipped with a single monochro-mator and a different grating. Experiments with instru-ments similar to Brewer #001 proved that the formula represents a good approximation in MkIV spectropho-tometers used in n2 mode for solar zenith angles lower than about 75(◦), but deviations of about 5 % (i.e. the theoretical formula overcorrects) were found (Diémoz, 2014), which need to be confirmed by more investiga-tions. Moreover, recent advances have shown that the formula by Cede et al. (2006) is inapplicable to MkII and MkIV Brewers in o3 mode due to different polari-sation properties of their diffraction gratings compared to the MkIII model (Diémoz and Carreño, 2015). 3. Frequent cleaning and accurate pointing were found to
4. Wavelength shifts occur owing to the monochroma-tor, which is the core component of the Brewers. If very accurate AOD estimates are needed, measurements through slit 2 and, to a lesser extent, slit 6 (Fig. 11) should be removed from the analysis.
5. Cloud screening. The uncertainties in AOD related to measurements perturbed by clouds are not strictly a Brewer issue. However, cloud screening algo-rithms operating within most aerosol networks such as AERONET rely on high-frequency measurements and remove data when the AOD (or its time derivative) abruptly changes. Conversely, the Brewer schedule is chosen by the operator based on the atmospheric param-eters of interest for the measuring station and DS mea-surements in the visible spectrum can be very sparse in a day. A Brewer cloud screening algorithm, valid on a net-work basis, should therefore be as independent as pos-sible from the running schedule. We developed the fol-lowing algorithm to filter the data for the period 2004– 2008, when the Cimel was not yet installed and thus the AERONET cloud mask could not be used. We shortly describe it here since it may be useful for other Brewer operators.
– Criteria 1–3 described in Sect. 4.3 are first applied. However, other criteria have to be developed to screen every single measurement instead of the full day as for a Langley. Moreover, we know the ex-traterrestrial constant at this point and we can ap-ply specific statistics tests on AOD instead of count rates.
– Negative AODs were removed.
– The stability criterion (Smirnov et al., 2000) is applied to every quintuplet. The original criterion used within AERONET presumes that the AOD should vary by less than 0.02 or 0.03τaerduring one
triplet of consecutive measurements by the Cimel, based on empirical evidence. These thresholds were loosened by a factor of 2.6 according to the larger amount of time taken for the Brewer to complete a quintuplet.
– The diurnal stability check (Smirnov et al., 2000) was used to classify the full days with a daily AOD standard deviation lower than 0.015 as clear. Oth-erwise, single measurements are removed when the corresponding AOD or Ångström exponent (calcu-lated from the data through all slits except slit 2) falls outside the daily mean plus or minus three standard deviations.
It must be noticed that the smoothness AERONET crite-rion, based on second time derivatives, was not applied since it was found to strongly depend on the measure-ment frequency of the selected schedule. Finally, crite-ria reported in the scientific literature and based on the
variability of nitrogen dioxide retrievals (Gröbner and Meleti, 2004) were not considered since NO2
measure-ments by MkIV Brewers are often uncalibrated. 6. The characterisation of each neutral density filter at
ev-ery slit wavelength is also fundamental, since the actual attenuation is very different from the nominal value. We calculated the spectral attenuation of each filter through each slit by analysing the count rates from the inter-nal lamp. A long series is necessary, since the SNR is low, especially at higher attenuations. An alternative method is to use the sun as a source and calculate the count rate variations when different filters are selected (“piecewise Langley”). In the present study, continuity between consecutive AODs measured with different fil-ters (not shown) provided an indication of the goodness of the characterisation.
7. Nonlinearity is evaluated in Brewers through the dead time test and corrected. Users should therefore regularly check the dead time value and, when possible, try to ad-ditionally use the sun as a source for the same test, thus checking the behaviour of the Brewer at higher count rates.
8. Circumsolar diffuse light entering the instrumental field of view. The full FOV of a Brewer is rather large, about 2.6◦ (Cede et al., 2003), more than twice the one of Cimel instruments, and may cause significant AOD er-rors in the UV range (Arola and Koskela, 2004) due to Mie scattered light entering the collimator. How-ever, this is a minor issue in the visible range and only accounts for few percentage points when the largest aerosol particles (e.g. desert dust) are to be measured, as calculated by Russell et al. (2004).
5.2 General contributors to uncertainty
-0.008 -0.006 -0.004 -0.002 0 0.002 0.004 0.006
-0.5 0 0.5 1 1.5 2
Scores mode 5
NO2 Brewer - climatology (DU)
Figure 16.Scatterplot between the scores of the fifth component
from the PCA and the difference between the measured and as-sumed nitrogen dioxide column, in Dobson units (DU).
which cannot be removed by simple averaging. A cali-bration transfer was successfully applied in the present work and allows envisaging that a travelling AOD stan-dard (a Brewer or a different instrument) could be set up within the Brewer network. In absence of a refer-ence, only high-altitude Langley extrapolations are rec-ommended.
2. The interference by atmospheric gases absorbing solar radiation in the measuring range can be completely re-moved only if their column concentrations, absorption cross sections, effective temperature and vertical pro-files (for air mass calculations) are perfectly known. The most effective absorbers in the measuring range of MkIV Brewers are nitrogen dioxide and water vapour. The former is considered in the AERONET processing using an NO2satellite climatology, whilst the latter can
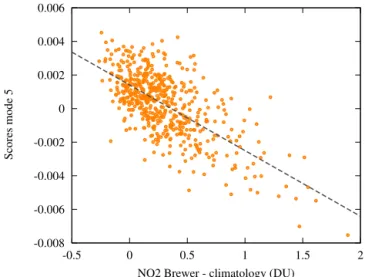
affect Brewer measurements through slits 3 and 4 up to 0.02 (in units of AOD) for a fully saturated atmosphere (Diémoz, 2014) and is not accounted for by AERONET. Interestingly, some hints of an incomplete removal of at-mospheric absorbers emerge from the PCA already de-scribed in Sect. 4.4. Although marginally contributing to the total variance (<1 %), one mode is clearly shaped
as the nitrogen dioxide cross sections (not shown) and its scores exhibit high correlation with the difference between the measured (by the Brewer) and assumed (AERONET climatology) NO2 column (ρ= −0.70,
Fig. 16). To exclude the possibility that the source of the correlation is a common cycle (e.g. annual cycle), the scaled correlation (e.g. Nikoli´c et al., 2012) was
cal-culated by splitting the series inKshort intervals, each
one consisting ofN=25 pairs of measurements.
ρs= 1 K
K
X
k=1
ρk (5)
This way of calculating the correlation index filters out any slow-varying component and enhances the high-frequency features common to both series. The obtained scaled correlation isρs= −0.70, which proves that the
series are connected in the short term. To give an idea of the influence of a potentially wrong AERONET NO2
climatology or diurnal patterns captured by the Brewer but missing from the satellite climatology, an extreme discrepancy of 2 Dobson units (DU) between the as-sumed and the actual nitrogen dioxide vertical densities would produce an error larger than 0.02 on the AOD cal-culated by AERONET at 440 nm. In fact, the RMSD be-tween the two NO2series is only 0.5 DU and the mean
bias 0.3 DU, which translate into errors of about 0.005 and 0.003 on AOD at 440 nm.
A weak link can again be noticed between the last component of the PCA and the total precipitable wa-ter vapour (PWV) measured by the Cimel at 940 nm (not shown), as expected from the theory. Although only a modest correlation is found between both variables (ρ=ρs=0.30), we believe that it is worth reporting
that the scores slightly increase as a function of the wa-ter vapour amount.
3. Removal of the Rayleigh scattering also brings some uncertainties with every instrument (e.g. due to uncer-tainties in the scattering cross sections and measured pressure), but their contribution is negligible in the visi-ble range. The Rayleigh compensation in Brewers, how-ever, deserves some attention. First, an obsolete spectro-scopic set of Rayleigh cross sections is used by default for ozone and nitrogen dioxide retrievals (Kipp&Zone, 2007). Therefore, these values should be recalculated by employing an updated Rayleigh spectroscopic data set to correctly remove the absorbers contribution. Inciden-tally, it must be noticed that the obsolete Rayleigh co-efficients normally employed in the standard ozone al-gorithm were replaced by the ones from Bodhaine et al. (1999) in the present work. Second, the Brewer adopts a climatological fixed value for pressure. In the case of Athens, if the climatological value (1000 hPa) were used instead of the measured pressure, then the AOD at 440 nm would deviate by up to 0.007, as evidenced by Eck et al. (1999) and also found in this work.
(2007) investigated the effects of the stray light on a single Brewer at UV wavelengths. However this is not expected to be an issue in the visible range due to the flatter shape of the solar spectrum measured at the ground in this region. For the same reason, the effects of using the Beer–Lambert–Bouguer law (rigorously de-fined for monochromatic radiation only) together with finite-bandwidth irradiances (e.g. Slusser et al., 2000) do not relevantly affect AOD measurements in the visi-ble range. Moreover, the Brewer bandwidth is generally narrower compared to the spectral resolution of filter ra-diometers.
6 Conclusions
The AERONET direct-sun processing scheme was taken as a basis to develop a new algorithm for AOD retrievals using MkIV Brewers in the visible range. Several effects have been found to impact the AOD estimates, such as changes in sensi-tivity of about 0.3 %◦C−1due to variations of the Brewer in-ternal temperature, slight radiometric instabilities, small mis-alignments of the wavelength scale, contamination of the ex-ternal optics and pointing inaccuracies. As proven by the re-sults of an intensive campaign, the Brewer, if carefully main-tained, is capable of high-quality AOD estimates in the visi-ble. The good agreement with AERONET is partly owed to the calibration transfer from the reference instrument to the Brewer. Indeed, initial calibration of the Brewer and follow-ing trackfollow-ing of its radiometric stability are crucial elements that must be accounted for if accurate retrievals are needed. We demonstrated that Langley extrapolations are problem-atic in polluted sites, notably if a diurnal cycle is present. Therefore, other methods, such as Langley plots in pristine environments (e.g. high altitude sites) should be preferred if possible. We also endorse the establishment of a travel-ling standard within EUBREWNET (e.g. an AOD-calibrated Brewer or a different kind of instrument) to improve the over-all quality of Brewer AOD measurements and to exploit the Brewer worldwide network at its best. In effect, due to the large number of available Brewers and their geographical spread, both new and historical (reprocessed) data sets will provide useful information for climate studies. On the other hand, Brewers can contribute to the progress of other aerosol monitoring networks owing to their ability to quantify the concentration of some atmospheric absorbers (ozone and sul-phur dioxide in the UV and nitrogen dioxide in the visible spectrum) and as a consequence, to correctly remove their influence on AOD retrievals.
The results obtained during this first study using the multi-year series of data collected by Brewer #001 will serve as a basis for more detailed analyses of the aerosol climatology in Athens.
Data availability
The AOD measurements by the Cimel sun-sky photome-ter in Athens are published as Aerosol Robotic Network (AERONET, 2016) and can be obtained via the AERONET website http://aeronet.gsfc.nasa.gov/.
Acknowledgements. This work was supported by a STSM Grant
from COST Action ES1207 (EUBREWNET – A European Brewer Network).
The authors thank John Rimmer and an anonymous reviewer for their helpful suggestions and valuable comments.
Edited by: A. Butz
References
Adamopoulos, A., Kambezidis, H., Kaskaoutis, D., and Giavis, G.: A study of aerosol particle sizes in the atmosphere of Athens, Greece, retrieved from solar spectral measurements, Atmos. Res., 86, 194–206, doi:10.1016/j.atmosres.2007.04.003, 2007. AERONET: Aerosol Optical Depth Measurements in Athens,
Greece from a Cimel sun-sky photometer Aerosol Robotic Network (AERONET) Principal Investigator: Vasillis Amiridis, available at: http://aeronet.gsfc.nasa.gov/cgi-bin/type_one_ station_opera_v2_new?site=ATHENS-NOA&nachal=2&level= 3&place_code=10, 2016.
Amiridis, V., Zerefos, C., Kazadzis, S., Gerasopoulos, E., Elefther-atos, K., Vrekoussis, M., Stohl, A., Mamouri, R., Kokkalis, P., Papayannis, A., Eleftheriadis, K., Diapouli, E., Keramitsoglou, I., Kontoes, C., Kotroni, V., Lagouvardos, K., Marinou, E., Gi-annakaki, E., Kostopoulou, E., Giannakopoulos, C., Richter, A., Burrows, J., and Mihalopoulos, N.: Impact of the 2009 Attica wild fires on the air quality in urban Athens, Atmos. Environ., 46, 536–544, doi:10.1016/j.atmosenv.2011.07.056, 2012. Arola, A. and Koskela, T.: On the sources of bias in aerosol optical
depth retrieval in the UV range, J. Geophys. Res., 109, D08209, doi:10.1029/2003JD004375, 2004.
Bais, A. F.: Absolute spectral measurements of direct solar ultravi-olet irradiance with a Brewer spectrophotometer, Appl. Opt., 36, 5199–5204, doi:10.1364/AO.36.005199, 1997.
Bodhaine, B. A., Wood, N. B., Dutton, E. G., and Slusser, J. R.: On Rayleigh optical depth calculations, J. At-mos. Ocean. Tech., 16, 1854–1861, doi:10.1175/1520-0426(1999)016<1854:ORODC>2.0.CO;2, 1999.
Bouguer, P.: Essai d’optique sur la gradation de la lumière, edited by: Jombert, C., Paris, France, 1729.
Burrows, J., Dehn, A., Deters, B., Himmelmann, S., Richter, A., Voigt, S., and Orphal, J.: Atmospheric remote-sensing reference data from GOME: Part 1. Temperature-dependent absorption cross-sections of NO2in the 231–794 nm range, J. Quant. Spec-trosc. Ra., 60, 1025–1031, doi:10.1016/S0022-4073(97)00197-0, 1998.
Carvalho, F. and Henriques, D.: Use of Brewer ozone spectropho-tometer for aerosol optical depth measurements on ultravio-let region, Adv. Space Res., 25, 997–1006, doi:10.1016/S0273-1177(99)00463-9, 2000.
Cede, A., Kazadzis, S., Kowalewski, M., Bais, A., Kouremeti, N., Blumthaler, M., and Herman, J.: Correction of direct irradi-ance measurements of Brewer spectrophotometers due to the ef-fect of internal polarization, Geophys. Res. Lett., 33, L02806, doi:10.1029/2005GL024860, 2006.
Cede, A. M., Labow, G., Kowalewski, M. G., Krotkov, N. A., and Dubovik, O.: Deriving aerosol parameters from absolute UV sky radiance measurements using a Brewer double spectrom-eter, in: Optical Science and Technology, SPIE’s 48th Annual Meeting, 323–329, International Society for Optics and Photon-ics, doi:10.1117/12.508788, 2003.
Cheymol, A. and De Backer, H.: Retrieval of the aerosol optical depth in the UV-B at Uccle from Brewer ozone measurements over a long time period 1984–2002, J. Geophys. Res., 108, 4800, doi:10.1029/2003JD003758, 2003.
Cheymol, A., De Backer, H., Josefsson, W., and Stüi, R.: Compar-ison and validation of the aerosol optical depth obtained with the Langley plot method in the UV-B from Brewer Ozone Spec-trophotometer measurements, J. Geophys. Res., 111, D16202, doi:10.1029/2006JD007131, 2006.
Cheymol, A., Gonzalez Sotelino, L., Lam, K. S., Kim, J., Fio-letov, V., Siani, A. M., and De Backer, H.: Intercomparison of Aerosol Optical Depth from Brewer Ozone spectrophotome-ters and CIMEL sunphotomespectrophotome-ters measurements, Atmos. Chem. Phys., 9, 733–741, doi:10.5194/acp-9-733-2009, 2009.
Colbeck, I., Chung, M.-C., and Eleftheriadis, K.: Formation and Transport of Atmospheric Aerosol over Athens, Greece, Wa-ter Air Soil Poll., 2, 223–235, doi:10.1023/A:1021335401558, 2002.
De Bock, V., De Backer, H., Mangold, A., and Delcloo, A.: Aerosol Optical Depth measurements at 340 nm with a Brewer spec-trophotometer and comparison with Cimel sunphotometer obser-vations at Uccle, Belgium, Atmos. Meas. Tech., 3, 1577–1588, doi:10.5194/amt-3-1577-2010, 2010.
De Bock, V., De Backer, H., Van Malderen, R., Mangold, A., and Delcloo, A.: Relations between erythemal UV dose, global solar radiation, total ozone column and aerosol optical depth at Uccle, Belgium, Atmos. Chem. Phys., 14, 12251–12270, doi:10.5194/acp-14-12251-2014, 2014.
Diémoz, H.: Improvements the nitrogen dioxide observations by means of the MKIV Brewer spectrophotometer, Ph.D. thesis, Sapienza – University of Rome, http://hdl.handle.net/10805/ 2491, 2014.
Diémoz, H. and Carreño, V.: Effects of the internal polarization in Brewers, Tech. rep., www.eubrewnet.org/cost1207/2015/01/30/ x-intercomparison-rbcce-campaign-and-eubrewnet-campaign/ #presentations, X Intercomparison RBCCE Campaign and Eubrewnet Campaign, 2015.
Diémoz, H., Savastiouk, V., and Siani, A. M.: Capability and limitations in measuring atmospheric nitrogen dioxide column amounts by means of the MKIV Brewer spectrophotometers, vol. 8890, 88 900D–88 900D–10, doi:10.1117/12.2028704, 2013. Diémoz, H., Siani, A. M., Redondas, A., Savastiouk, V., McElroy,
C. T., Navarro-Comas, M., and Hase, F.: Improved retrieval of nitrogen dioxide (NO2) column densities by means of MKIV
Brewer spectrophotometers, Atmos. Meas. Tech., 7, 4009–4022, doi:10.5194/amt-7-4009-2014, 2014.
Dubovik, O. and King, M. D.: A flexible inversion algorithm for retrieval of aerosol optical properties from Sun and sky radiance measurements, J. Geophys. Res., 105, 20673–20696, doi:10.1029/2000JD900282, 2000.
Dubovik, O., Smirnov, A., Holben, B. N., King, M. D., Kauf-man, Y. J., Eck, T. F., and Slutsker, I.: Accuracy assessments of aerosol optical properties retrieved from Aerosol Robotic Net-work (AERONET) Sun and sky radiance measurements, J. Geo-phys. Res., 105, 9791–9806, doi:10.1029/2000JD900040, 2000. Eck, T. F., Holben, B. N., Reid, J. S., Dubovik, O., Smirnov, A., O’Neill, N. T., Slutsker, I., and Kinne, S.: Wavelength dependence of the optical depth of biomass burning, urban, and desert dust aerosols, J. Geophys. Res., 104, 31333–31349, doi:10.1029/1999JD900923, 1999.
Eleftheriadis, K., Balis, D., Ziomas, I. C., ColBeck, I., and Man-alis, N.: Atmospheric aerosol and gaseous species in Athens, Greece, Atmos. Environ., 32, 2183–2191, doi:10.1016/S1352-2310(97)00412-3, 1998.
Gerasopoulos, E., Amiridis, V., Kazadzis, S., Kokkalis, P., Eleft-heratos, K., Andreae, M. O., Andreae, T. W., El-Askary, H., and Zerefos, C. S.: Three-year ground based measurements of aerosol optical depth over the Eastern Mediterranean: the urban environment of Athens, Atmos. Chem. Phys., 11, 2145–2159, doi:10.5194/acp-11-2145-2011, 2011.
Gröbner, J. and Meleti, C.: Aerosol optical depth in the UVB and visible wavelength range from Brewer spectrophotometer direct irradiance measurements: 1991–2002, J. Geophys. Res., 109, D09202, doi:10.1029/2003JD004409, 2004.
Gröbner, J., Wardle, D. I., McElroy, C. T., and Kerr, J. B.: Investiga-tion of the wavelength accuracy of Brewer spectrophotometers, Appl. Opt., 37, 8352–8360, doi:10.1364/AO.37.008352, 1998. Gröbner, J., Vergaz, R., Cachorro, V. E., Henriques, D. V.,
Lamb, K., Redondas, A., Vilaplana, J. M., and Rembges, D.: Intercomparison of aerosol optical depth measurements in the UVB using Brewer Spectrophotometers and a Li-Cor Spectrophotometer, Geophys. Res. Lett., 28, 1691–1694, doi:10.1029/2000GL012759, 2001.
Holben, B., Eck, T., Slutsker, I., Tanré, D., Buis, J., Setzer, A., Vermote, E., Reagan, J., Kaufman, Y., Nakajima, T., Lavenu, F., Jankowiak, I., and Smirnov, A.: AERONET – A Federated Instrument Network and Data Archive for Aerosol Character-ization, Remote Sens. Environ., 66, 1–16, doi:10.1016/S0034-4257(98)00031-5, 1998.
Holben, B., Eck, T., Slutsker, I., Smirnov, A., Sinyuk, A., Schafer, J., Giles, D., and Dubovik, O.: AERONET’s version 2.0 quality assurance criteria, in: Proc. SPIE 6408, Remote Sensing of the Atmosphere and Clouds, The International Society for Optical Engineering, 6408, doi:10.1117/12.706524, 2006.
IPCC: Climate change 2013: the physical science basis. Working Group I contribution to the Fifth Assessment Report of the Inter-governmental Panel on Climate Change, Tech. rep., Intergovern-mental Panel on Climate Change, 2014.
Jolliffe, I. T.: Principal component analysis, Springer New York, doi:10.1007/b98835, 2002.
Athens, Greece, based on MODIS data, Atmos. Environ., 41, 7315–7329, doi:10.1016/j.atmosenv.2007.05.017, 2007. Kasten, F. and Young, A. T.: Revised optical air mass tables
and approximation formula, Appl. Optics, 28, 4735–4738, doi:10.1364/AO.28.004735, 1989.
Kazadzis, S., Bais, A., Kouremeti, N., Gerasopoulos, E., Garane, K., Blumthaler, M., Schallhart, B., and Cede, A.: Direct spectral measurements with a Brewer spectroradiometer: absolute cali-bration and aerosol optical depth retrieval, Appl. Opt., 44, 1681– 1690, doi:10.1364/AO.44.001681, 2005.
Kazadzis, S., Bais, A., Amiridis, V., Balis, D., Meleti, C., Kouremeti, N., Zerefos, C. S., Rapsomanikis, S., Petrakakis, M., Kelesis, A., Tzoumaka, P., and Kelektsoglou, K.: Nine years of UV aerosol optical depth measurements at Thessaloniki, Greece, Atmos. Chem. Phys., 7, 2091–2101, doi:10.5194/acp-7-2091-2007, 2007.
Kazadzis, S., Veselovskii, I., Amiridis, V., Gröbner, J., Suvorina, A., Nyeki, S., Gerasopoulos, E., Kouremeti, N., Taylor, M., Tsek-eri, A., and Wehrli, C.: Aerosol microphysical retrievals from precision filter radiometer direct solar radiation measurements and comparison with AERONET, Atmos. Meas. Tech., 7, 2013– 2025, doi:10.5194/amt-7-2013-2014, 2014.
Kendall, M. G.: A New Measure of Rank Correlation, Biometrika, 30, 81–93, doi:10.2307/2332226, 1938.
Kerr, J., McElroy, C., Wardle, D., Olafson, R., and Evans, W.: The Automated Brewer Spectrophotometer, in: Atmospheric Ozone, edited by: Zerefos, C. and Ghazi, A., 396–401, Springer Nether-lands, doi:10.1007/978-94-009-5313-0_80, 1985.
Kerr, J. B.: New methodology for deriving total ozone and other atmospheric variables from Brewer spectrophotometer direct sun spectra, J. Geophys. Res., 107, ACH 22-1–ACH 22-17, doi:10.1029/2001JD001227, 2002.
Kosmopoulos, P., Kaskaoutis, D., Nastos, P., and Kambezidis, H.: Seasonal variation of columnar aerosol optical properties over Athens, Greece, based on MODIS data, Remote Sens. Environ., 112, 2354–2366, doi:10.1016/j.rse.2007.11.006, 2008.
Kumharn, W., Rimmer, J. S., Smedley, A. R., Ying, T. Y., and Webb, A. R.: Aerosol Optical Depth and the Global Brewer Network: A Study Using UK-and Malaysia-Based Brewer Spectropho-tometers, J. Atmos. Ocean. Tech., 29, doi:10.1175/JTECH-D-11-00029.1, 2012.
Langley, S. P.: The “solar constant” and related problems, Astro-phys. J., 17, 89–99, doi:10.1086/140999, 1903.
Levy, H., Horowitz, L. W., Schwarzkopf, M. D., Ming, Y., Golaz, J.-C., Naik, V., and Ramaswamy, V.: The roles of aerosol direct and indirect effects in past and future climate change, J. Geophys. Res., 118, 4521–4532, doi:10.1002/jgrd.50192, 2013.
Li, Z., Zhao, X., Kahn, R., Mishchenko, M., Remer, L., Lee, K.-H., Wang, M., Laszlo, I., Nakajima, T., and Maring, H.: Uncertain-ties in satellite remote sensing of aerosols and impact on monitor-ing its long-term trend: a review and perspective, Ann. Geophys., 27, 2755–2770, doi:10.5194/angeo-27-2755-2009, 2009. Liu, Y., Kahn, R. A., Chaloulakou, A., and Koutrakis, P.: Analysis
of the impact of the forest fires in August 2007 on air quality of Athens using multi-sensor aerosol remote sensing data, me-teorology and surface observations, Atmos. Environ., 43, 3310– 3318, doi:10.1016/j.atmosenv.2009.04.010, 2009.
Lohmann, U. and Feichter, J.: Global indirect aerosol effects: a re-view, Atmos. Chem. Phys., 5, 715–737, doi:10.5194/acp-5-715-2005, 2005.
Mann, H. B.: “Nonparametric Tests Against Trend”, Econometrica, 13, 245–259, doi:10.2307/1907187, 1945.
Marenco, F.: On Langley plots in the presence of a systematic diurnal aerosol cycle centered at noon: A comment on re-cently proposed methodologies, J. Geophys. Res., 112, d06205, doi:10.1029/2006JD007248, 2007.
Marenco, F., Santacesaria, V., Bais, A. F., Balis, D., di Sarra, A., Papayannis, A., and Zerefos, C.: Optical properties of tropospheric aerosols determined by lidar and spectrophoto-metric measurements (Photochemical Activity and Solar Ul-traviolet Radiation campaign), Appl. Opt., 36, 6875–6886, doi:10.1364/AO.36.006875, 1997.
Marenco, F., di Sarra, A., and Luisi, J. D.: Methodology for determining aerosol optical depth from Brewer 300– 320-nm ozone measurements, Appl. Opt., 41, 1805–1814, doi:10.1364/AO.41.001805, 2002.
Mayer, B. and Kylling, A.: Technical note: The libRadtran soft-ware package for radiative transfer calculations – description and examples of use, Atmos. Chem. Phys., 5, 1855–1877, doi:10.5194/acp-5-1855-2005, 2005.
Meltzer, R., Wilson, A., Kohn, B., and Rives, J.: Temperature de-pendence of the spectral response for the MKIV Brewers in the UGA/USEPA network, in: 6th Brewer Workshop, Tokyo, Japan, vol. 10, p. 12, 2000.
Michalsky, J. J.: The Astronomical Almanac’s algorithm for ap-proximate solar position (1950–2050), Sol. Energy, 40, 227–235, doi:10.1016/0038-092X(88)90045-X, 1988.
Mishchenko, M. I., Geogdzhayev, I. V., Rossow, W. B., Cairns, B., Carlson, B. E., Lacis, A. A., Liu, L., and Travis, L. D.: Long-Term Satellite Record Reveals Likely Recent Aerosol Trend, Sci-ence, 315, 1543, doi:10.1126/science.1136709, 2007.
NASA, U. and USAF, U.: Standard Atmosphere Supplements, US Government Printing Office, Washington, DC, 1976.
Nikoli´c, D., Mure¸san, R. C., Feng, W., and Singer, W.: Scaled correlation analysis: a better way to compute a cross-correlogram, Eur. J. Neurosci., 35, 742–762, doi:10.1111/j.1460-9568.2011.07987.x, 2012.
Pissimanis, D., Notaridou, V., and Viglas, P.: The behaviour of aerosol optical depth during clear summer days in Athens, Greece, Theor. Appl. Climatol., 49, 121–128, doi:10.1007/BF00865528, 1994.
Russell, P. B., Livingston, J. M., Dubovik, O., Ramirez, S. A., Wang, J., Redemann, J., Schmid, B., Box, M., and Holben, B. N.: Sunlight transmission through desert dust and marine aerosols: Diffuse light corrections to Sun photometry and pyrheliometry, J. Geophys. Res., 109, D08207, doi:10.1029/2003JD004292, 2004. Shettle, E. P.: Models of aerosols, clouds, and precipitation for at-mospheric propagation studies, in: AGARD, Atat-mospheric Propa-gation in the UV, Visible, IR, and MM-Wave Region and Related Systems Aspects 14 p (SEE N90-21907 15–32), vol. 1, 1989. Silva, A. A. and Kirchhoff, V. W. J. H.: Aerosol optical
thickness from Brewer spectrophotometers and an investiga-tion into the stray-light effect, Appl. Opt., 43, 2484–2489, doi:10.1364/AO.43.002484, 2004.