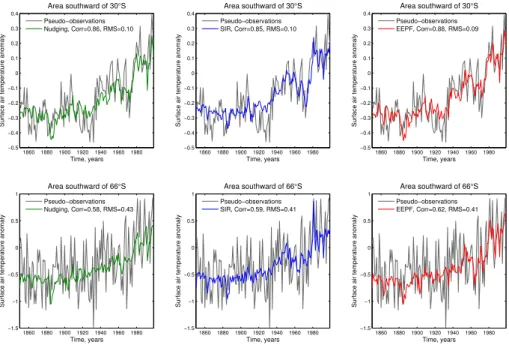
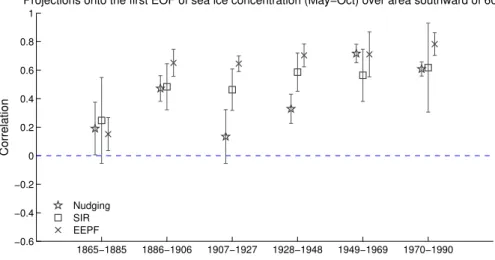
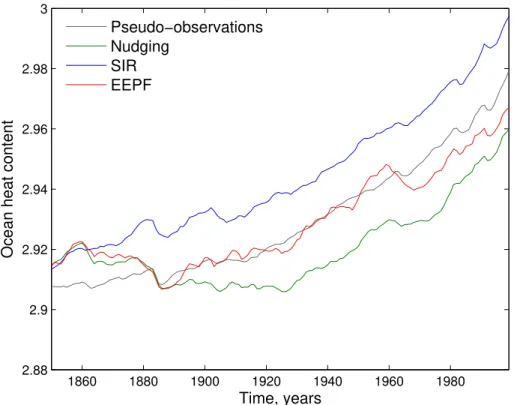
An assessment of climate state reconstructions obtained using particle filtering methods
Texto
Imagem



Documentos relacionados
The maintenance of the non-specific innate immune system (haptoglobin, hemagglutination- hemolysis), long-term stress (fault bar intensity) and inflam- mation (NOx,
SPM concentrations (average of each month) for three locations of Mumbai compared with annual and daily air quality standard (140 and 200 μg/m
Controller outputs are computed in order to optimise future behaviour of the greenhouse environment, regarding set-point tracking and minimisation of the control effort over
Figure 5 shows an association of the score of pododermatitis with litter humidity, air temperature, litter temperature and with maximum and minimum footpad surface temperature
vacariensis and hourly mean of environmental temperatures (air temperature: continuous line, substrate temperature: broken line) throughout the seasons in the study area,
Response surfaces of the surface temperature of broiler chickens (ts) as a function of air dry-bulb temperature (tdb) and the duration of thermal challenge (DTC) in fuzzy systems
The climate sensitivity and global mean annual surface air temperature warming of each of the models with simulations in the PlioMIP Experiment 2 ensemble.. Climate sensitivity is
Diurnal variability from 1 to 4 January 2010: (a) wind speed at 3 m (black line), air temperature at 1 m (blue line) and surface temperature of snow (red line), (b) NO mixing ratios
